2018 preliminary operating and capital budgets - Standing Policy Committee on Protection and Community Services and Parks December 4th, 2017
←
→
Page content transcription
If your browser does not render page correctly, please read the page content below
Slide 1
Standing Policy Committee on Protection and Community
Services and Parks
December 4th, 2017
2018 preliminary operating and capital budgets
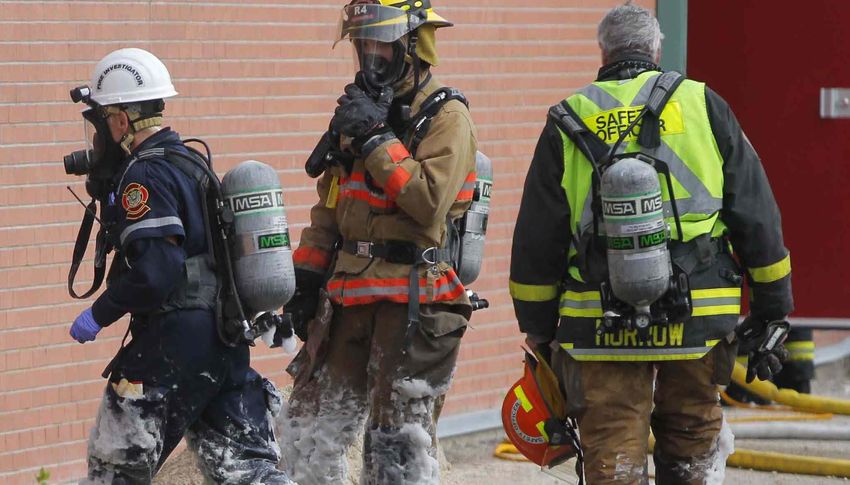
Winnipeg Fire Paramedic Service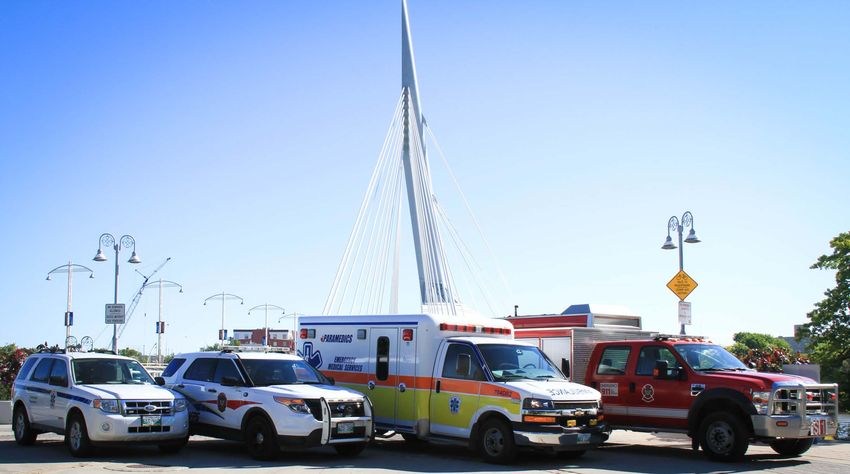
Slide 2

                Today’s situation – incident statistics
                  Dispatched incidents                                     Fire incidents                                           Medical incidents
  120,000                                                22,000                                              3,000   80,000
                                                                                                Total fire
                                                         20,000                                                                                                   Total medical
                                                Total                                                                70,000
  100,000                                                18,000                                              2,500

                                                                                             General fire            60,000
                                                         16,000
   80,000                                                                                                    2,000
                                                         14,000                                                      50,000
                                              Medical
                                                         12,000
   60,000                                                                                                    1,500   40,000
                                                         10,000                                                                                                    Fire and
                                                                                                                                                                   ambulance
                                                          8,000                                                      30,000
   40,000                                                                                                    1,000
                                                          6,000                                                      20,000
                                                                                          Hazardous fire
                                                                                                                                                                Ambulance only
                                                          4,000
   20,000                                                                                                    500                                                  Fire only
                                                                                            Specialty fire           10,000
                                         Fire / Rescue    2,000
                                                                                                                                                                   IFT
          -                                                  -                                               -           -
              2009 2010 2011 2012 2013 2014 2015 2016             2009 2010 2011 2012 2013 2014 2015 2016                     2009 2010 2011 2012 2013 2014 2015 2016
Slide 3

          Today’s situation - citizen survey 2017
                Public safety weighted highest importance by 82% of people
                Very satisfied & Somewhat satisfied percentage trends:

                  100%
                   90%
                   80%
                   70%
                   60%
                   50%
                   40%
                                Fire and rescue response
                   30%
                                Medical response
                   20%          Fire and injury prevention
                   10%          Disaster preparedness

                   0%
                         2010   2011        2012             2013   2014   2015   2016   2017
Slide 4

          Service insights
Slide 5

          Service overview
                                                                                                  Ambulance types
                                                                                       Type                              #
                                                                                       24-hour emergency                 16

          •   Service operates 24 / 7                                                  24-hour IFT                        2
                                                                                       Peak emergency                     9
          •   88% of departmental expenditure is staffing                              Peak IFT                           1
                                                                                       Multiple Incident Response
                                                                                                                          1
          •   Number of apparatus drives staffing need:                                Vehicle (MIRV)
                                                                                       Bariatric emergency                1
              •   49 Fire apparatus                                                    EPIC                               1

              •   31 Ambulances
          •   Need a higher staff complement to ensure minimum number of staff
              available to work (the effect of vacation, training, injury, sickness)
              •   Fire 2018 staffing ratio maintained at 1.29                                   Staffing ratio
                                                                                          The multiplier that helps
              •   Ambulance 2018 staffing ratio maintained at 1.34                     determine the number of Full
                                                                                       Time Equivalent staff required,
                                                                                          based on the number of
                                                                                         operational vehicles and an
                                                                                           estimate for expected /
                                                                                          unexpected staff absence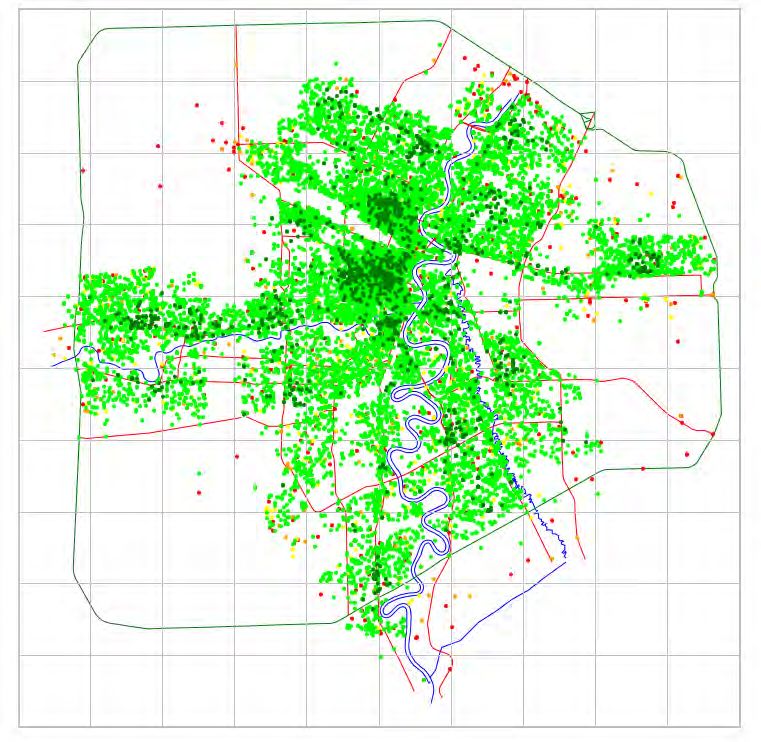
Travel time Travel time    Colour
Slide 6
                                                                                      (secs)      (mins)

                                                                                     0-120
Slide 7

          Integrated service outcomes
          This result is achieved without any             Ambulance AND Fire travel times
          additional staffing:
          •   There are NO EXTRA fire fighters as a
              result of the integrated service. Fire
              fighter staffing is based on fire
              coverage needs
          •   The use of fire fighters on medical calls
              is part funded by the WRHA in the
              same way as all other costs related to
              the Medical Response service – this
              provides a funding subsidy that reduces
              the overall Mill Rate cost of the fire
              service
                                                                                      2015 data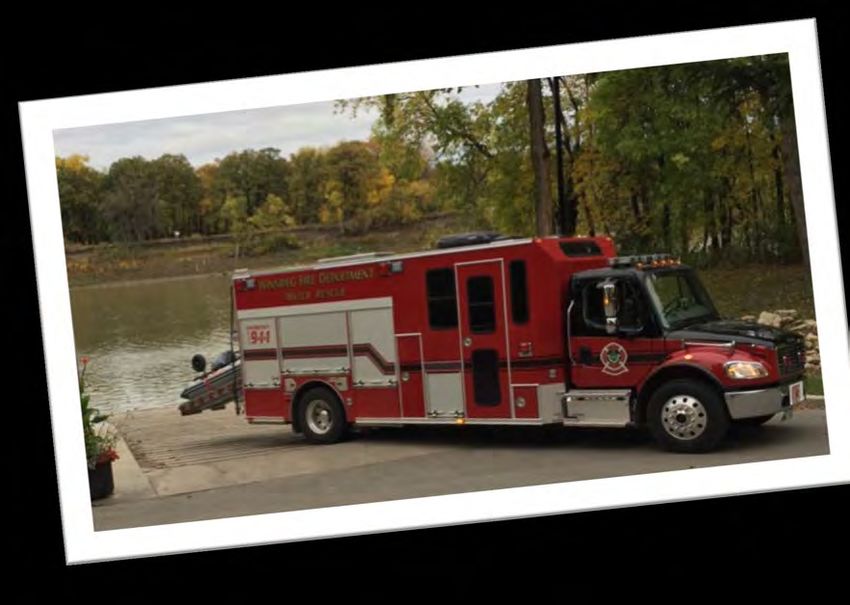
Slide 8

          Today’s situation – EMS insights (MBNC 2016)
                   Winnipeg                           Average
             Ambulance                         Ambulance
             Service cost:                     Service cost:
             $145/hour                         $217/hour

                                 Sudden                            Sudden
                      74.6%   cardiac arrest            67.2%   cardiac arrest
                              within 6 mins                     within 6 mins

                       23.1%                             19.8%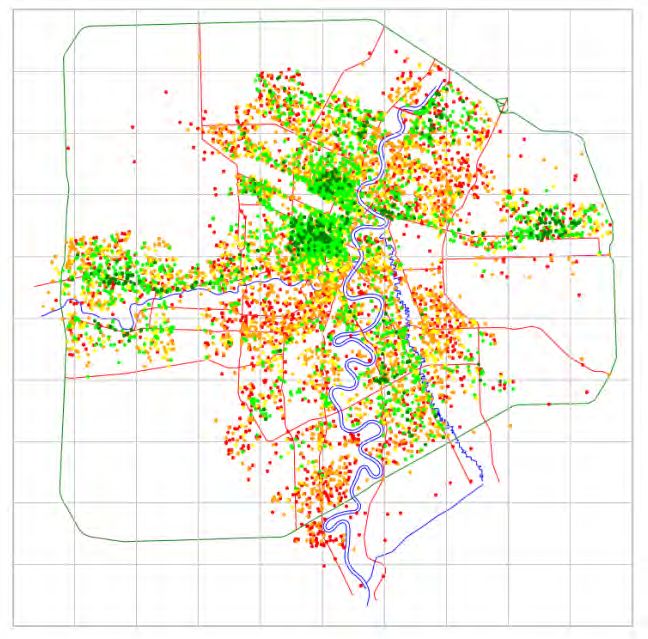
Slide 9

          Today’s situation – Fire insights (MBNC 2016)
                     Winnipeg                      Average
                         FIRETRUCK                     FIRETRUCK
                         SERVICE COST                  SERVICE COST
                         $275/hour URBAN               $308/hour URBAN

              6:57                          6:38

                          Injuries 8.16                 Injuries N/A
                          Fatalities 1.09               Fatalities 0.42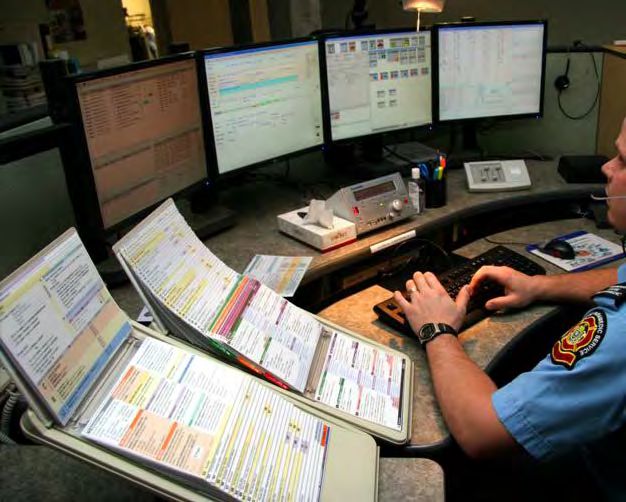
Slide 10

           Service accomplishments
Slide 11
2017 accomplishments
Company Officer Development Program
Implementation of accredited Fire Officer II for District Chiefs and Platoon Chiefs
commenced this year. All fire officer training will progress to accredited
programs exclusively in future years. This ensures program uniformity and is an
industry best practice
Auxiliary power units in fire apparatus
APUs were installed in the new Water Rescue and Ladder vehicles
to help reduce fuel consumption by powering essential systems when
the vehicles are on sceneSlide 12
2017 accomplishments
Water rescue replacement
Replacement of two 1986 Water Rescues apparatus
with improved ability to deploy quickly for water
and ice rescue operations
Automated CPR device trial
Throughout 2017, the trial of automated chest compression devices evaluated
multiple models for operational effectiveness. The selection of the preferred
model will be made by the end of the year. These devices will significantly
improve responder safety when performing CPR in a moving ambulance, and
are expected to improve the quality of CPR provided while moving cardiac
arrest patientsSlide 13
2017 accomplishments
Update of fire squad vehicles
Replacement of two Urban Squad vehicles to improve
responder and patient safety by providing an enclosed
treatment space within the vehicle while at the same time
reducing vehicle cost by 2/3rds
Specialty fire training scheduling
All new fire recruits receive accredited specialty rescue training in HazMat or
Technical Rescue while undertaking their regular program. This aims to reduce
overtime cost by reducing the incidence of backfill for staff attending these
training programs after entering operational dutySlide 14
2017 accomplishments
Spark Innovation Grant
The Community Paramedicine program received a grant to conduct research
utilizing specific assessment modules used by WRHA Home Care Services. The
goal was to improve overall care by allowing multiple providers to collect data
on common terms, using common language and therefore able to provide
continuous care during patient transitions. This helps improve patient referrals
to community support networks thereby avoiding over-reliance on emergency
resources
Replacement of water tanker
The 1986 Water Tanker ceased operation in 2016 and was
replaced in 2017, thereby restoring fire suppression
capability outside of the water districtSlide 15
Preliminary operating budgetSlide 16
2018 preliminary operating budget
– departmental financial overview
2017 adopted 2018 Change % 2019 forecast 2020 forecast
preliminary
Total expenditure 199.2m 193.5m - 5.7m - 2.9% 207.2m 211.0m
Total revenue 64.3m 62.7m - 1.6m - 2.5% 64.4m 65.6m
Mill rate support 134.9m 130.8m - 4.1m - 3.0% 142.8m 145.4m
2018 major expenditure changes 2018 major revenue changes
+ $3.0m salary increments + $7.8m ambulance fee reduction subsidy
+ $0.4m EOC upgrade + $0.3m provincial ambulance operating grant
+ $0.3m provincial ambulance operating cost + $0.4m building inspection fees
- $5.2m 2018 capital program funding - $7.4m ambulance revenue
- $3.2m EPIC and MSP expansion removal - $2.0m removal of transfer of care charges
- $0.8m fire apparatus replacement program - $0.9m WRHA cost shareSlide 17
2018 preliminary operating budget
– departmental financial overview
• Ambulance rates in 2018:
January to March
from April
Baseline 2017 rate
Patient $425 $340 These rate changes derive the ambulance
$529
revenue reduction of $7.4m
Province $104 $189 This new subsidy fills the funding gap created by
the rate change dollar for dollar
• No ambulance rate changes in 2018Slide 18
2018 preliminary operating budget
– expenditure summary ($193.5m)
Professional services
6.7% Services, $12.9 Property maintenance
Salaries and benefits, $169.5 Fleet rental costs
Other
expenditure, $24.0
Fleet operating costs
Materials, parts & supplies, $5.5
87.6% 12.4%
2.8% Medical supplies
Protective clothing
0.3% Assets & purchases, $0.6
1.8% Debt & financing, $3.5 Debt interest and principal
Bad debt expense
1.4% Grants, transfers & other, $2.8 Building rental
Radio network
-0.6% Recoveries, -$1.3Slide 19
2018 preliminary operating budget
– service area expenditure ($193.5m) Fire and Injury Prevention,
3% $6.3m
Disaster Preparedness
and Response, 1% $1.2m
Fire and Rescue Response,
61% $117.6m
Medical Response, 35%
$68.4mSlide 20
2018 preliminary operating budget
– service area expenditure year over year changes
-5.3% -2.2% 3.3% +100.0%
$120.0
$110.0
$100.0
$90.0
$80.0
$70.0
$60.0
$50.0 2017
$40.0 2018
$30.0
$20.0
$10.0
$0.0
Medical Response Fire and Rescue Response Fire and Injury Prevention Disaster Preparedness and
ResponseSlide 21
2018 preliminary operating budget
– revenue summary ($62.7m)
1% 32.2% 2.4% 0.2% 40.3% 11.5% 12.4%
25
}
$4.6
20
$25.3
15
10
$0.6 $20.2 $0.7 $0.9 $20.7 $7.2 $7.8
5
0
Regulation fees Ambulance fees Inspection fees Other WRHA grants Provincial grants Ambulance fee
reduction subsidySlide 22
2018 preliminary operating budget
– service area revenue ($62.7m)
Medical Response, 91%
Fire and Rescue Response,
$57.1m
7% $4.7m
Fire and Injury Prevention,
2% $0.9m
Disaster Preparedness
and Response, 0%
$0.0mSlide 23
2018 preliminary operating budget
– service area revenue overview
Revenue Source Fire Rescue Medical Fire Prevention /
Response Response Inspection
Provincial grants $4.1m $3.1m $0.0m
New fee reduction grant $7.8m
WRHA base grant (2016 level) $0.0m $20.7m $0.0m
Estimated shortfall $4.6m
Service revenue $0.6m $20.9m $0.9m
Total $4.7m $57.1m $0.9m $62.7mSlide 24
2018 preliminary operating budget
– service area revenue year over year changes
-4.0% +6.8% +80.0%
$60.0
$50.0
$40.0
$30.0
2017
$20.0 2018
$10.0
$0.0
Medical Response Fire and Rescue Response Fire and Injury Prevention Disaster Preparedness and
ResponseSlide 25
Service areasSlide 26
Fire and rescue response
Service description Citizen satisfaction 2017: 99%
To provide quick, proficient, emergency and non-emergency fire suppression
and rescue assistance
Financial overview
2017 2018 2019 2020
adopted preliminary forecast forecast
Total expenditure 120.3m 117.6m 126.7m 128.8m
Total revenue 4.4m 4.7m 4.7m 4.7m
Mill rate support 115.9m 112.9m 122.0m 124.1m
Mill rate change: -3.0m
Full time equivalents 851 852 852 852Slide 27
2018 preliminary operating budget
– Year over year change
Expenditure changes 2017 adopted Change 2018
preliminary
Total expenditure 120.3m
Salary and benefits 0.6m
Capital charges -2.6m
Fleet -0.8m
Miscellaneous other 0.1m
Total expenditure 117.6mSlide 28
2018 preliminary operating budget
– Year over year change
Revenue changes 2017 adopted Change 2018
preliminary
Total revenue 4.4m
Refinement of service based view +0.3m
Total revenue 4.7m
FTE changes 2017 adopted Change 2018
preliminary
One program manager – asset
851 +1 852
managementSlide 29
Fire and rescue response
Fleet funding supports replacement of ageing apparatus in accordance with industry
standards (target: no front line vehicle older than 15 years):
2017 replacements: 2018 replacements: 2019 replacements:
Apparatus Age Status Apparatus Age Status Apparatus Age Status
Water rescue x2 31 yrs Jul 17 Engine x2 20 yrs Apr 18 Engine x2 20 yrs Jan 19
Rescue x4 25 yrs
2x Dec 17 Hazmat 21 yrs Aug 18 Suburban squad 24 yrs Jan 19
2x Jan 19
Rehab vehicle 32 yrs Jan 19
This represents the continuation of the minimum replacement plan approved in 2016
Additions: 2018 additions: 2019 additions:
Apparatus # Apparatus #
Water tanker 1 Water tanker 1Slide 30
Medical response
Service description Citizen satisfaction 2017: 87%
To provide quick, proficient, primary response to all medical emergency
situations, including pre-hospital patient care, transport and standby at
critical Police, Fire and special events
Financial overview
2017 2018 2019 2020
adopted preliminary forecast forecast
Total expenditure 72.2m 68.4m 73.1m 74.5m
Total revenue 59.5m 57.1m 58.6m 59.8m
Mill rate support 12.7m 11.3m 14.5m 14.7m
Mill rate change: -1.4m
Full time equivalents 501 477 477 477Slide 31
2018 preliminary operating budget
– Medical Response revenue detail
Major changes:
• Provincial ambulance fee reduction funding introduced
• Baselined at 2017 rates
• Cessation of Transfer of Care delay charging
• The end of the funding formula for emergency ambulances
Major issues:
• Confirmed funding commitment from WRHA set at a 2016 baseline
• Creates a funding shortfall due to cost increases between 2016 and 2018
• Will need WRHA to increase funding or direct where service reductions are to be madeSlide 32
2018 preliminary operating budget
– Comparison of funding formula to baseline 2016
(OLD) Funding formula (NEW) Funding 2018
(preliminary budget) Issues:
Special EMS Programs fully funded by (*) Special ($9.4m)
WRHA WRHA Emergency Ambulance ($11.3m) 2016 baseline funding
Total ($20.7m)
City of Winnipeg ($11.3m)
Emergency Ambulance EMS Patient fees ($17.9m)
net cost
Provincial fee reduction ($7.8m)
Total: ($57.7m)
FUNDING GAP ($4.6m)
Patient fees 50.0%
Total EMS 2016 to 2018 cost increases: $4.6m
net cost
($62.3m)
City of WRHA 25.0%
Winnipeg each
(*) Indicative onlySlide 33
2018 preliminary operating budget
– Comparison of Provincial funding to 2016 baseline
2014 actual 2015 actual 2016 actual 2017 adopted 2017 forecast 2018 2019 forecast 2020 forecast
(funding (funding (funding (funding (October) preliminary (2016 (2016
formula) formula) formula) formula) (2016 baseline) baseline)
baseline)
WRHA cost share $17.29m $18.44m $21.64m $25.55m $23.21m $25.29m $26.82m $27.98m
WRHA grant $11.54m $12.69m $15.89m $19.80m
Provincial Fire EMS grant $0.50m $0.50m $0.50m $0.50m $20.68m $20.68m $20.68m $20.68m
Provincial EMS grant $5.25m $5.25m $5.25m $5.25m
Total $17.29m $18.44m $21.64m $25.55m $20.68m $20.68m $20.68m $20.68m
Shortfall $0.0m $0.0m $0.0m $0.0m $2.53m $4.60m $6.14m $7.30m
Unpaid as at Oct 2017 (^) $0.6m $1.0m $5.6m
Provincial grants $2.52m $2.83m $2.83m $2.83m $2.83m $3.1m $3.1m $3.1m
Ambulance fee reduction $0.0m $0.0m $0.0m $0.0m $3.00m $7.8m $11.88m $12.92m
Total Provincial (*) $19.81m $21.27m $24.47m $28.38m $26.5m $31.58m $35.66m $36.7m
(^) – plus $0.978m outstanding from 2013
(*) – excluding shortfallsSlide 34
2018 preliminary operating budget
– Year over year changes
Expenditure changes 2017 adopted Change 2018
preliminary
Total expenditure 72.2m
Increase in salary and benefits 2.0m
Ambulance operating cost 0.3m
Removal of EPIC and MSP expansion -3.2m
Capital charges -2.6m
Miscellaneous other -0.3m
Total expenditure 68.4mSlide 35
2018 preliminary operating budget
– Year over year changes
Revenue changes 2017 adopted Change 2018 preliminary
Total revenue 59.5m
Decrease in ambulance revenue -7.4m
Provincial ambulance fee reduction subsidy +7.8m
WRHA Grant
Decrease in grant arising from changes -5.5m
Increase above $20.7m baseline +4.6m
Provincial ambulance operating +0.3m
Removal of transfer of care charges -2.0m
Refinement of service based view -0.3m
Miscellaneous other +0.1m
Total revenue 57.1mSlide 36
Medical response
FTE changes 2017 adopted Change 2018
preliminary
7 MSP paramedics
501 -24 477
17 EPIC paramedicsSlide 37
Fire and injury prevention
Service description Citizen satisfaction 2017: 88%
To protect citizens and minimize loss of life and property through fire by
checking compliance with building standards and providing fire and life
safety education, and advice to reduce need for emergency intervention
Financial overview
2017 2018 2019 2020
adopted preliminary forecast forecast
Total expenditure 6.1m 6.3m 6.4m 6.6m
Total revenue 0.5m 0.9m 1.2m 1.2m
Mill rate support 5.6m 5.4m 5.2m 5.4m
Mill rate change: -0.2m
Full time equivalents 44 46 46 46Slide 38
2018 preliminary operating budget
– Year over year changes
Expenditure changes 2017 adopted Change 2018
preliminary
Total expenditure 6.1m
Increase in salary and benefits +0.2m
Total expenditure 6.3m
Revenue changes 2017 adopted Change 2018
preliminary
Total revenue 0.5m
Service fees +0.4m
Total revenue 0.9m
FTE changes 2017 adopted Change 2018
preliminary
Two fire inspectors 44 +2 46Slide 39
Disaster preparedness (jointly with Community Services)
Service description Citizen satisfaction 2017: 88%
To provide a prompt and co-ordinated response by the City of Winnipeg to
major peacetime disasters
Financial overview
2017 2018 2019 2020
adopted preliminary forecast forecast
Total expenditure 0.6m 1.2m 1.1m 1.1m
Total revenue 0.0m 0.0m 0.0m 0.0m
Mill rate support 0.6m 1.2m 1.1m 1.1m
Mill rate change: 0.6m
Full time equivalents 5 6 8 8Slide 40
Disaster preparedness (jointly with Community Services)
Expenditure changes 2017 adopted Change 2018
preliminary
Total expenditure 0.6m
Increase in salary and benefits +0.2m
Increase in EOC office costs +0.4m
Total expenditure 1.2m
FTE changes 2017 adopted Change 2018
preliminary
One Emergency Management
Officer and One Social Media
Officer 5 +1 6
Offset by refinement of the service
based viewSlide 41
Disaster preparedness
Assistant Chief
Emergency
Preparedness
2016
Administrative
Assistant
Emergency Public
2017 Management Information
Co-ordinator Officer
Emergency
2018 Social Media
Management
Officer
Officer
Future plan: 2019 Emergency
Management
Communications
Assistant
OfficerSlide 42 Preliminary capital budget
Slide 43

           2018 preliminary capital budget – overview
           Project / program                 2018      2019       2020       2021       2022       2023
                                         estimate   forecast   forecast   forecast   forecast   forecast
           Facilities optimization          0.6m      7.5m       2.2m       0.4m       7.2m       2.8m
           Equipment obsolescence           0.9m      1.0m       1.6m       1.1m       4.2m       6.9m
           Station capital maintenance      2.6m      2.7m       2.9m       3.0m       3.1m       1.7m
           EMS training equipment                                0.1m
           Total                            4.1m     11.2m       6.8m       4.5m      14.5m      11.4m

           Computer aided dispatch                    7.5m
Slide 44
Facilities optimization – overview
This program seeks to maximize the long term efficiency of the station
network
Ensures station coverage across the city so that all citizens benefit from a
common level of service
$20.7m program cost over 6 years provides:
• design and evaluation for three station optimizations
• land acquisition and construction for two station optimization
$0.6m in 2018 provides:
• evaluation and design for Station 9 (Marion) and 15 (Autumnwood) – includes
community engagementSlide 45
Equipment obsolescence – overview
This program seeks to replace the critical equipment used by fire fighters
and paramedics in a systematic and ongoing basis to ensure service
delivery can be maintained
$15.7m program cost over 6 years provides:
• cyclical replacement of specialized emergency equipment: cardiac
monitor/defibrillators; Toughbook portable computers; stair chairs; self
contained breathing apparatus; SimMan mannequins; rescue equipment;
power stretchers; decontamination units; radio equipment
$0.9m in 2018 provides:
• Annual program to replace cardiac monitor defibrillators
• 3 yearly replacement of stair chairsSlide 46
Computer aided dispatch – overview
These capital funds seek to replace the current CAD system that manages
emergency call taking and fire/ambulance dispatch functions
Removed from the capital program for 2018 – planned to resubmit into
2019 as part of the 2019 budget process once best option is fully scoped
There are no funds allocated in 2018 as we are still working through the options and
procurement/proposal phases of the project. This complex project is not yet at a stage
to determine a class 3 or better cost estimate and so has been deferred to meet policy
requirements.
What has become clear through this process is a significant interdependency between
the core CAD system and seven associated systems. This has changed the scope of the
project and will likely result in a broader program to ensure the systematic
replacement over a number of years of these associated systems. A number of options
are being explored to minimize the cost of replacing this essential and complex
system.Slide 47
Station capital maintenance – overview
These capital funds support the ongoing repair and structural maintenance of the
station network to ensure the asset lives are maximized
$16.0m program cost over 6 years provides:
• critical works identified to move station assets closer to a Facility Condition Index
classification of “managed care” – this is a below average target when compared
with other City Council assets
$2.6m in 2018 is planned to fund the following work (tender outcome dependent):
• Asbestos abatement and renovations $1.5m
• Roof repairs $0.4m
• Heating systems $0.5m
• Security system installation $0.2mSlide 48
QuestionsYou can also read