DEUTZ Investor presentation - February 2019 - Deutz AG
←
→
Page content transcription
If your browser does not render page correctly, please read the page content below
DEUTZ
Investor presentation
February 2019
Agenda

DEUTZ at a glance

Strategy & market position

Financials

Outlook

2
DEUTZ at a glance
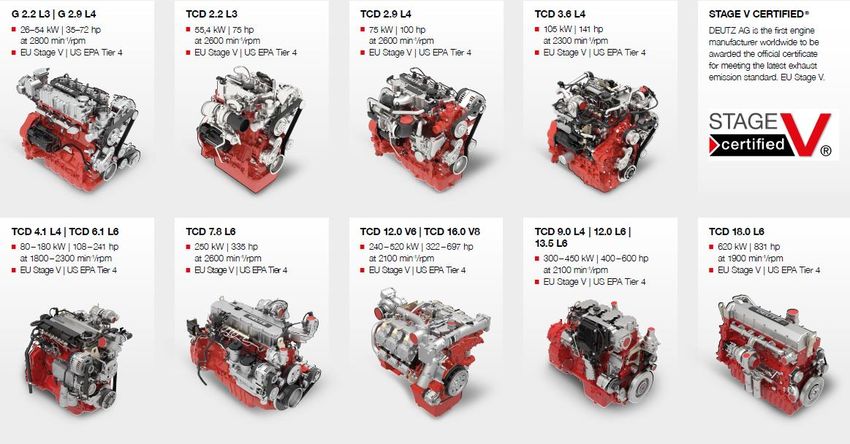
DEUTZ is the leading independent manufacturer of diesel
and gas engines in the power range from 19 to 620 kW
for off-highway applications – we are developing the technologies today
for the demands of tomorrow
■ Founded in 1864 in Cologne, DEUTZ is the world's oldest engine company
and one of the world's leading independent engine manufacturers
■ Otto, Langen, Daimler, Bugatti, Maybach – these pioneers
of engine technology all worked for DEUTZ
■ DEUTZ is synonymous with engineering spirit, passion
and a culture of innovation DEUTZ has always driven
change. Now, we are ready
■ From the world’s first engines, to the world’s cleanest
for the next step.
diesel engines, to introducing hybrid and electric solutions
for off-highway applications
3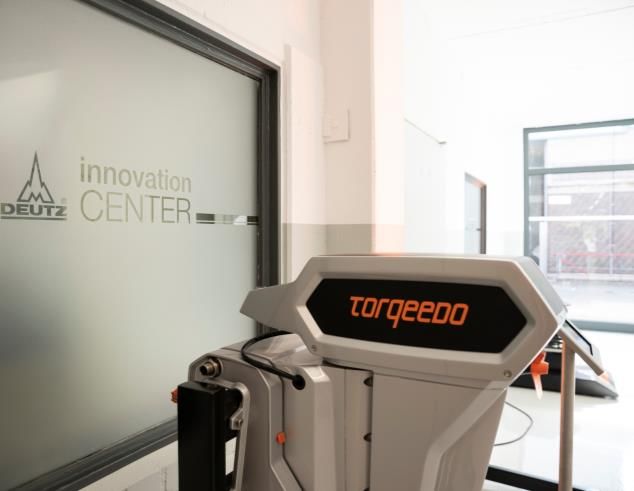
DEUTZ offers a broad range of engines
Expanded product offering in the
Start of series production in 2019
lower output range
New gas and bi-fuel engines
Expansion of product portfolio in
the upper output range
(200 to 620 kW)
Start of serial supply in 2019
Expansion of product portfolio for EU Stage V emissions standard in 2019
4DEUTZ is present in more than 130 countries worldwide
Production & service network
Production & assembly
Xchange centre
Sales company
Service centre
>800 sales & service partners
5DEUTZ is successfully expanding customer base worldwide
Long-standing customer relationships New customers & greater share of wallet
(not exhaustive) (not exhaustive)
6Agenda DEUTZ at a glance Strategy & market position Financials Outlook 7
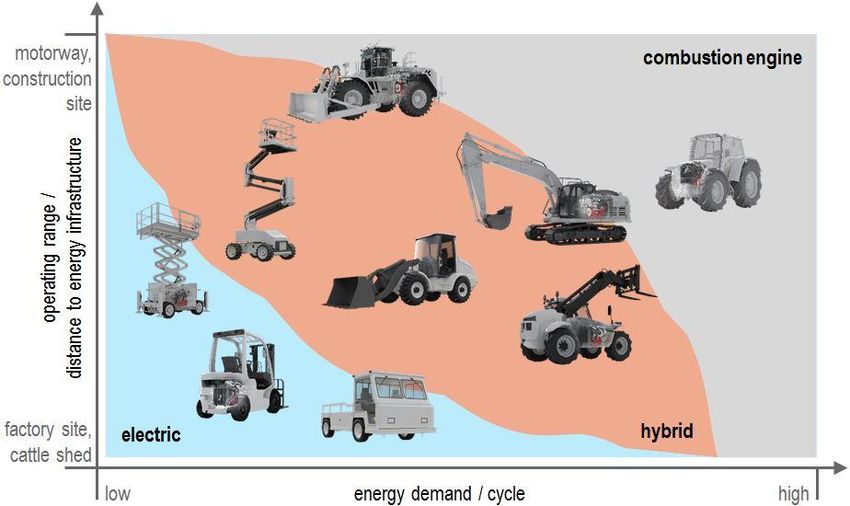
DEUTZ is well on track to become a leading provider
of innovative drive systems

    Combustion             Alternative drives
                           on the rise
    engines here to stay   Hybrid & electric, hybrid, gas, synthetic & bi-fuels
                           Reduction of complexity ,CO2 optimisation

    ~200,000 units         5-10% share of revenue
    per year expected
                           from electric and hybrid solutions in 2022

8
E-DEUTZ
Electrification strategy
Acquisition of Torqeedo (Sep 2017) is paying off
Successful know-how transfer –
DEUTZ saves 5 years development time
First prototype after 6 months
Marketable hybrid and full-electric products
expected at end of 2019 / early 2020
DEUTZ has taken on a pioneering role in the field of electrification
9E-DEUTZ
Electrification strategy
Electrification strategy is as “door opener” for
new customers
≥ DEUTZ has established expertise in all relevant
technological fields (e-motors, power electronics,
battery technology, systems integration etc.)
DEUTZ offers a modular kit solution for
customer-specific drive specifications
Key selling points: lower emissions & total cost
of ownership
DEUTZ leads the development of electrification solutions for off-highway applications
10DEUTZ performance programme
Further increase in revenue
> €2.0 billion
2022
> €1.6 billion
€1.26 billion 2018
2016
Key drivers
Growth of core business: Expansion of product Expansion of service Regional growth:
expanded portfolio of portfolio: business: improve market position in the
combustion engines for EU new innovative drive systems more than € 400 million USA, exploit growth potential in
Stage V emissions standard, (alternative drives & E-DEUTZ), revenue in 2022, Asia with strong focus on China
further expansion of customer win new customers digitalisation
base
11DEUTZ performance programme
Further improvement in profitability
7-8%
2022
≥4.5%
2018
1.9%
2016
Key drivers
Operational excellence: Investments in product Expansion of service Growth in core business and
Optimise global production portfolio: business: regions:
and sourcing network, better e.g. Torqeedo, E-DEUTZ, revenues of more than € 400 Optimise existing
efficiency in all operations, 9-18L engines million expected in 2022, portfolio/product mix,
reduction of complexity and digitalisation optimisation of distribution
improvement of quality
12Expansion of service business
€ million Service business showing resilience
>400 throughout the economic cycle
309.2 Expansion of service business
278.4 287.3
259.3 • New products
• Best-in-class availability of spare parts
• Optimised repair concepts (e.g. Xchange engines)
• Direct connection to our end customers via digital channels
• Investment in own service centres & acquisition of selected
dealers
• Digitalisation
2014 2015 2016 2017 2022
Revenue of more than € 400 million expected in 2022
13Digitalisation
“From data to value”
Where?
Production
Sales
Service
Administration
Quality
How? Improve efficiency
DEUTZ as a “learning organisation”
Data processing & analysis
& customer loyalty
14Regional growth strategy
Off-highway market 2017 Americas offers growth potential with full-electric, hybrid, gas and
in thousand units 1,738 bi-fuel drives. Focus on strengthening market position in the USA
EMEA: further development of OEMs, increase market
penetration with innovative drive systems such as full-electric &
hybrid
422
300
Asia-Pacific: China is the world`s largest individual market and
offers growth potential due to fast implementation of emissions
Americas EMEA Asia-Pacific standard China IV
Attainable market: Non-captive engine supply,
CE / AG / MH / StE segments, 19-620 kW, emission level
≥ Tier 3 (based on PSR 2017 database)
DEUTZ aims to further increase its market share
15China growth strategy
Three-pillar strategy
China`s biggest construction HORIZON is the largest First diesel engine company
equipment group rental company for material in China
handling in China
Large customer Contract manufacturing
Service partner cooperation
Joint venture partner
Partner for digitalisation Ability to satisfy additional
demand throughout Asia
Revenue target in China: ~€500 million in 2022(1)
16 (1) Whether this revenue will be fully consolidated is still to be reviewedFinancial strength
► Equity ratio to remain >40%
Strong balance sheet
► Medium- to long-term financing with undrawn facilities available
► Firepower for acquitisitions available
Potential acquisitions
► Focus on innovation, service & internationalisation
► Payout ratio ~30% of recurring profit over multi-year period
Attractive dividend policy
► Stable or growing dividend per share
Robust financial framework in volatile markets
17Key investment highlights
Well on track to become a leading provider of innovative drive systems
Leading position in the development of electrification solutions for off-highway applications
Successful expansion of customer base worldwide
Strongly growing service business to enhance resilience and profitability
Regional expansion of the business including three-pillar growth strategy in China
Robust financial framework in volatile markets
Clear strategy to further increase profitability
18Agenda DEUTZ at a glance Strategy & market position Financials Outlook 19
Highlights
■ Strong Q1-Q3 2018 performance
• Sharp order growth (+31.9% yoy)
• Double-digit revenue increase (+18.7% yoy)
• Ongoing growth in all regions and segments
• Substantial improvement of operating profit: EBIT (before exceptional items) +71.9% yoy
• Good Q3 result despite strike at supplier
■ Progress towards strategic targets
• DEUTZ sets course for further growth in China. JV DEUTZ Dalian (DDE) sold to former partner FAW in October.
DDE related P&L effects will be offset in Q4 (expected cash inflow approx. €10 million)
• New opportunities due to the implementation of China 4 emissions standard for off-highway applications, which
has been brought forward to 2020. Licence agreement with Norinco signed in November
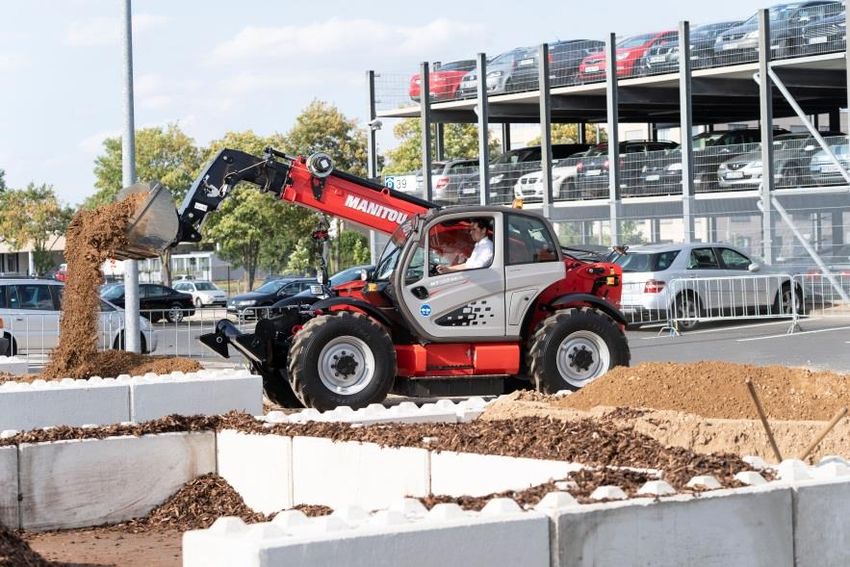
• E-DEUTZ strategy well on track: successful presentation of hybrid and full-electric prototypes at our ELECTRIP
event week in September. First E-DEUTZ customer project with Manitou
20Key figures (1)
Q1-Q3 2018 yoy Q3 2018 yoy
€ million
New orders 1,548.7 +31.9% 452.2 +22.0%
Revenue 1,297.3 +18.7% 419.7 +17.0%
Adjusted EBIT(2) 60.3 +115.4% 12.8 +146.2%
EBIT (before exceptional items) 45.9 +71.9% 12.5 +150.0%
Net income 35.6 +76.2% 10.3 +586.7%
(1) 2017 figures restated
(2) EBIT (before exceptional items) adjusted for DDE effects in 2018 (i.e. operating profit, adjustment of carrying amount and impairment)
Substantial improvement of operating profit
21Sales figures
New Orders Unit Sales Revenue
€ million Units € million
+31.9% +32.3% +18.7%
1,548.7 156,504
1,297.3
1,173.8 118,279
1,093.2
Q1-Q3 2017 Q1-Q32018 Q1-Q3 2017 Q1-Q3 2018 Q1-Q3 2017 Q1-Q3 2018
Torqeedo sold 8,977 electric drive systems in Q1-Q3 2018
Unit sales grew faster than revenue due to strong demand for smaller engine series
22Revenue by quarter
€ million
463.1
414.5 419.7
382.0 385.9
352.5 358.7
301.1 314.7
Q3 16 Q4 16 Q1 17 Q2 17 Q3 17 Q4 17 Q1 18 Q2 18 Q3 18
Double-digit revenue growth in Q3 yoy despite strike at a supplier
23Revenue by region
Strong growth supported by all regions
Q1-Q3 2018
(Q1-Q3 2017)
Africa/Middle East 3 % Europe (excl. Germany) 49 %
€37.7 million €641.9 million
(€36.4 million) (€530.0 million)
Asia-Pacific 9 %
€113.7 million
€1,297.3 million
(€109.3 million)
(€1,093.2 million)
Americas 20 % Germany 19 %
€259.5 million €244.5 million
(€206.1 million) (€211.4 million)
24Revenue by application
Substantial revenue growth in all off-highway applications
Q1-Q3 2018
(Q1-Q3 2017)
Other 3 % Construction Equipment 30 %
€37.6 million €395.3 million
(€18.6 million) (€322.2 million)
Automotive 3 %
€36.8 million
(€42.1 million)
Stationary Equipment 10 % €1,297.3 million Material Handling 21 %
€125.2 million (€1,093.2 million) €266.3 million
(€113.3 million) (€198.9 million)
Agricultural Machinery 14 % Service 19 %
€188.3 million €247.8 million
(€164.2 million) (€233.9 million)
25Operating profit & net income
Q1-Q3 2017(1) Q1-Q3 2018
€ million
119.3 59.0
89.4 62.7
60.3 14.4
45.9 1.7 8.6
35.6
26.7 0.1 26.8 2.0 4.6 20.2
EBITDA D&A EBIT Excep- EBIT Net Income Net Adj. D&A Adj. DDE EBIT Net Income Net
before before tional after interest taxes income EBITDA(2) EBIT(2) effects before interest taxes income
except. except. items except. expense except. expense
items items items items
Adj. EBITDA advanced by 33.4% and adj. EBIT more than doubled
€14.4 million drag on EBIT in Q1-Q3 2018 by DDE JV, but this will be recovered in Q4
Low interest expenses and tax rate
Net income increased by 76.2%
26 (1) Restated
(2) EBIT and EBITDA (before exceptional items) adjusted for DDE effects in 2018 (i.e. operating profit, adjustment of carrying amount and impairment)EBIT (before exceptional items)
€ million
60.3 Operating profit increase driven by DEUTZ
45.9
26.3 Compact Engines
26.3
26.7
Adjusted EBIT margin improved by 2.2%-points
21.9 42.6
28.2
5.6 Reported EBIT in the DEUTZ Compact Engines
-0.8 -8.6 -8.6
segment was affected by JV DDE
Q1-Q3 2017 Q1-Q3 2018 Q1-Q3 2018
restated adjusted for reported
DDE effects
EBIT margin 2.4% 4.6% 3.5%
DEUTZ Compact Engines DEUTZ Customised Solutions Other
27DEUTZ Compact Engines (1)
Q1-Q3 Q1-Q3 Change Q3 Q3 Change
€ million 2018 2017 in % € million 2018 2017 in %
New orders 1,312.2 969.3 35.4 New orders 381.8 307.7 24.1
Unit sales (units) 141,034 111,947 26.0 Unit sales (units) 46,571 36,465 27.7
Revenue 1,085.2 907.6 19.6 Revenue 347.5 294.0 18.2
Adjusted EBIT(2) 42.6 6.9 517.4 Adjusted EBIT(2) 7.8 -4.5 --
EBIT (before except. items) 28.2 5.6 403.6 EBIT (before except. items) 7.5 -4.7 --
Double-digit revenue growth in key applications: Material Handling (+35.9% yoy), Construction Equipment (+24.3% yoy) and
Agricultural Equipment (+14.6% yoy)
Service revenue increased by 5.5% yoy
Substantial improvement of underlying profitability
(1) 2017 figures restated
28 (2) EBIT (before exceptional items) adjusted for DDE effect (i.e. operating profit, adjustment of carrying amount and
impairment)DEUTZ Customised Solutions
Q1-Q3 Q1-Q3 Change Q3 Q3 Change
€ million 2018 2017 in % € million 2018 2017 in %
New orders 214.8 204.5 5.0 New orders 63.7 63.1 1.0
Unit sales (units) 6,493 6,332 2.5 Unit sales (units) 2,100 2,215 -5.2
Revenue 191.3 185.6 3.1 Revenue 65.8 64.7 1.7
EBIT (before except. items) 26.3 21.9 20.1 EBIT (before except. items) 8.4 10.3 -18.4
Good Q1-Q3 2018 performance
Service revenue advanced by 6.6% yoy
Strong EBIT growth (+20.1% yoy) attributable to better product mix, profitable service business and efficiency gains
29R&D spending & capital expenditure
R&D expenditure Capital expenditure (excl. R&D)
€ million
60.5
1.4
47.7
Gross expenditure 1.4 43.7 41.0
2.2 0.7
Reimbursements
59.1
Net expenditure 46.3 41.5 40.3
Net R&D Q1-Q3 2017 Q1-Q3 2018 Q1-Q3 2017 Q1-Q3 2018
expenditure
ratio(1) 4.2% 4.6%
Increase of R&D due to expansion of product range
Proportion of capitalised net R&D expenditure: €13.4 million (Q1-Q3 2017: €10.0 million)
(1) Ratio of net R&D expenditure to consolidated revenue
30Working capital & operating cash flow
Working capital Operating cash flow
€ million
296.3
190.7
96.4
55.5
30 Sep 2017 30 Sep 2018 Q1-Q3 2017 Q1-Q3 2018
Working
capital ratio 13.5% 17.6%
Working capital increase mainly due to higher business volume and higher inventory level
Higher working capital to meet production requirements in Q4
31Free cash flow & net financial position
Free cash flow(1) Net financial position
€ million
95.0
82.5 78.8
7.3
2017 Q3 2018 (LTM) 30 Sep 2017 30 Sep 2018
Decline of free cash flow due to working capital increase
Positive net financial position
(1) Free cash flow: cash flow from operating and investing activities less net interest expense
32Equity ratio & funding
€ million
1,198.2 1,215.3
48.8% 49.5%
584.3 601.4
160
20 19 4 1
(1)
31 Dec 2017 30 Sep 2018 up to up to up to up to
1 year 2 years 5 years 10 years
Total assets Equity xx.x% Equity ratio Repayment schedule Duration of credit line
Equity ratio increased to 49.5%
Medium- to long-term financing with undrawn facilities available:
• Credit line of €160 million until June 2023
• Loan from European Investment Bank repayable by July 2020
(1) Restated
33Agenda DEUTZ at a glance Strategy & market position Financials Outlook 34
Financial outlook
FY 2017 FY 2018
guidance(2)
€ million
Revenue 1,479.1 > 1,600
EBIT margin (before exceptional items) 2.7 %(3) ≥ 4.5 %
R&D expenditure(1) 67.0 70 - 80
Capex (excl. R&D)(1) 54.7 60 - 70
(1) Net of reimbursements
(2) Assuming no further supply shortage
(3) Restated
Guidance figures increased on 27 July 2018
35Financial calendar & contact details FY 2018 results 14 March 2019 Annual general meeting 30 April 2019 Q1 2019 results 7 May 2019 ► Contact details Leslie Isabelle Iltgen Tel:+49 (0) 221 822 3600 SVP Communications & Investor Relations Fax:+49 (0) 221 822 15 3600 Ottostrasse 1 Email: leslie.iltgen@deutz.com 51149 Cologne (Porz-Eil), Germany www.deutz.com 36
Disclaimer
This presentation contains forward-looking statements that are subject to various
risks and uncertainties. Future results could differ materially from those
described in these forward-looking statements due to certain factors, e.g.
changes in business, economic and competitive conditions, regulatory reforms,
foreign exchange rate fluctuations, uncertainties in litigation or investigative
proceedings, and the availability of financing. DEUTZ does not undertake any
responsibility to update the forward-looking statements in this presentation.

Thank you for your attention

37
You can also read