FY 2018 Results Presentation - Milan, March 15th 2019 - Prada Group
←
→
Page content transcription
If your browser does not render page correctly, please read the page content below
FY 2018 Results Presentation
      Milan, March 15th 2019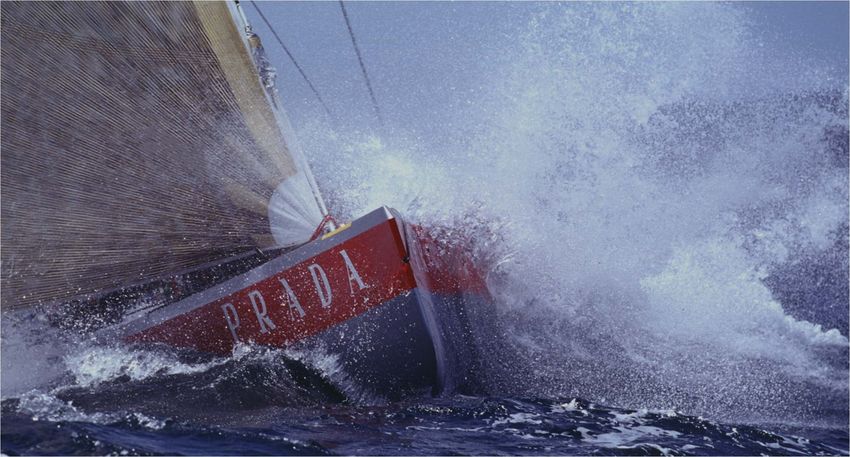
Agenda

       Presentation
       14:30 – 15:00

               Patrizio Bertelli – CEO
               • 2018 Overview and Business update

               Alessandra Cozzani – CFO
               • FY 2018 Financial Review

               Lorenzo Bertelli – Head of Marketing and Communication
               • Tech Roll-out

               Carlo Mazzi – Chairman
               • Outlook

       Q&A Session
       15:00 – 15:30

FY 2018 Results Presentation – March 15th 2019                          1
2018 Overview and Business update
                                                 Patrizio Bertelli
                                                       CEO

FY 2018 Results Presentation – March 15th 2019                       2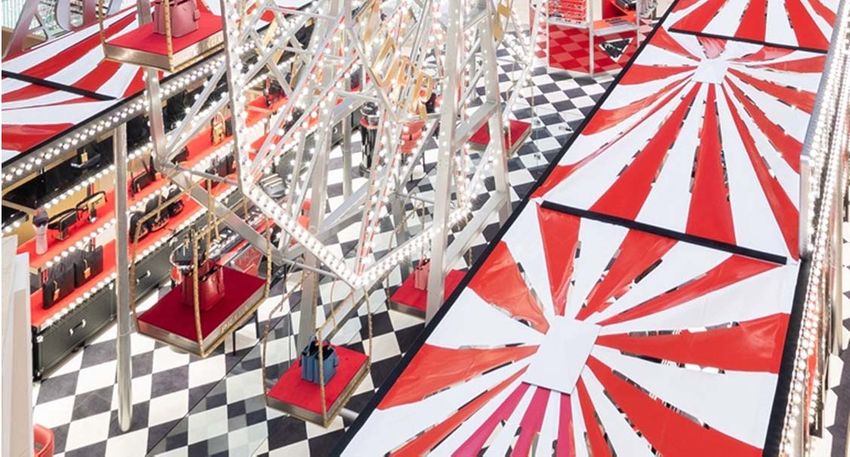
2018: focus on execution

Overall good performance in a challenging environment
   •   Positive sales trends across all regions and categories
   •   Increased full price sales
   •   Geopolitical environment causing uncertainty

Transformation plan demonstrated results
   •   Targeted execution of our plan: channels,
       merchandising, communication
   •   Investing in foundations of platform for growth
   •   Technology and digital strategy in place and delivering
   •   Enhanced human capital

Our Brands: a unique asset
   •   No compromise on our core values
   •   Brand integrity at the heart of any decisions

FY 2018 Results Presentation – March 15th 2019                    3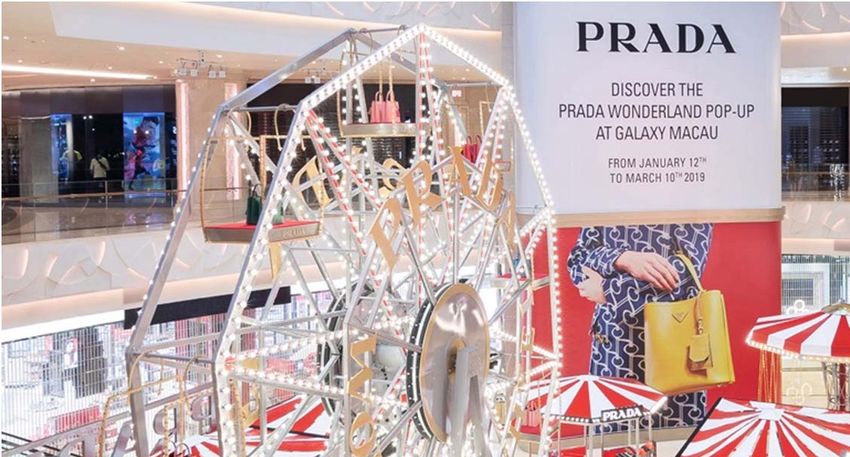
Brand integrity is our guiding principle

            CHANNELS                             MERCHANDISING    COMMUNICATION

                                     Investment in brand, technology,
                                       production and organisation

FY 2018 Results Presentation – March 15th 2019                                    4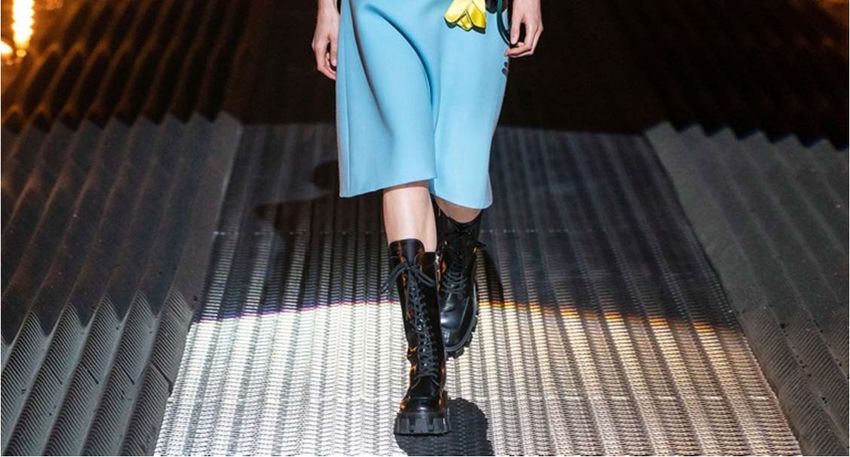
Channels
               Investment in pop-ups and events leveraging omnichannel portfolio
Driving excitement and customer engagement
through pop-ups and store events
  • Roll-out of 48 pop-up stores and 50 Linea Rossa
     2.0 special set ups in FY-18
  • Fully integrated with digital and social campaigns
  • More than 700 promotional events in FY-18 to
     strengthen relationships with local clients

Continuous optimisation of the retail network
  • 29 new openings and 20 closures in FY-18
  • ~ 120 renovation and relocation projects

Strong double-digit growth in e-commerce through
own on-line platforms

Selective approach when choosing our wholesale
partners to manage a controlled growth strategy
• Partnerships with e-tailers reinforced by exclusive
   capsule collections – 20 drops in FY-18
• Focus on top-tier wholesale partners

FY 2018 Results Presentation – March 15th 2019                                     5
Merchandising
                 Interpreting market trends leveraging our brands’ unique heritage

   Leather Goods – improved offer across all strategic pricing
   points
     • Broad-based organic growth driven by both iconic and new
       lines (i.e. Prada Sidonie, Margit, Sybille, Odette, Belle,
       Ouverture)
     • Bags and Viaggio outperforming

   RTW – double digit performance confirming design leadership
     • Prada Men and lifestyle collections outperformed
     • Positive response to the relaunch of Linea Rossa collection
     • High single-digit growth for Miu Miu ready-to-wear collection

   Footwear – successful collections building on longstanding
   expertise in lifestyle and sportwear
     • Outperformance of sneakers for both men and women

FY 2018 Results Presentation – March 15th 2019                                       6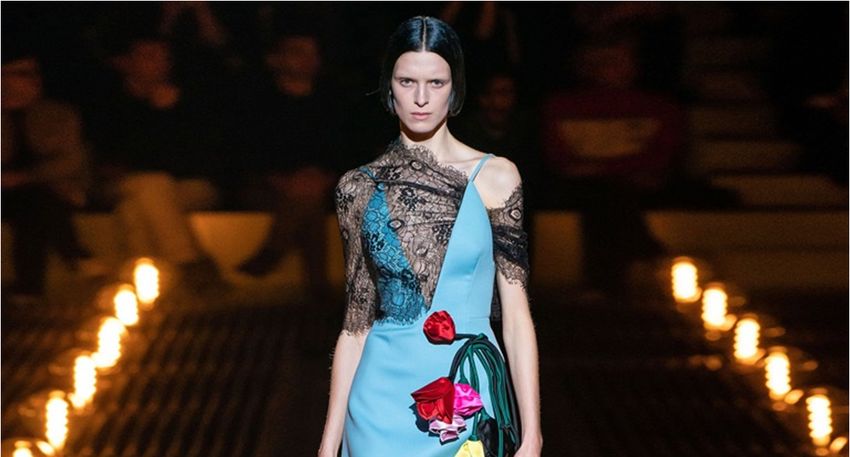
Communication
Targeting new audiences through brand experience
First Prada Mode
• Prada's roving club offering its members unique experiences with a focus
on contemporary culture
• An extension of major global cultural events (e.g. Art Basel Miami – Dec 2018)
enhancing brand visibility
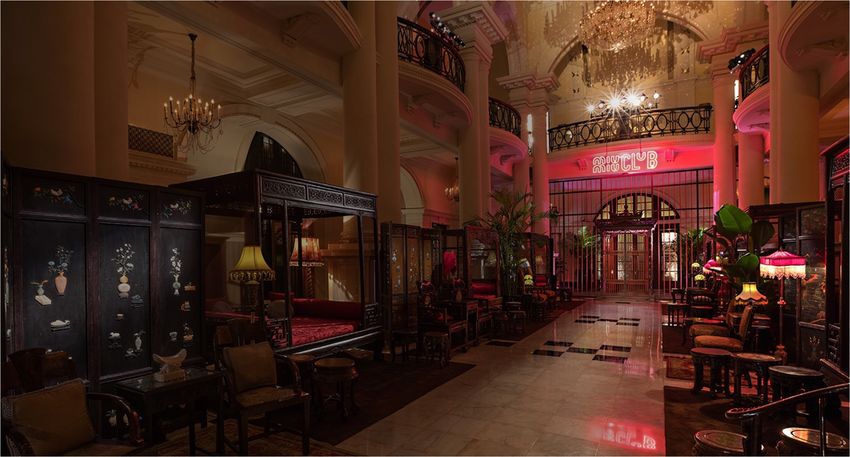
Miu Miu Club in Shanghai
• The Miu Miu Croisière 2019 collection travelled to Shanghai
• The show was held at the legendary Waldorf Astoria hotel in a unique setting
designed by artistic director Tu Nan
FY 2018 Results Presentation – March 15th 2019 7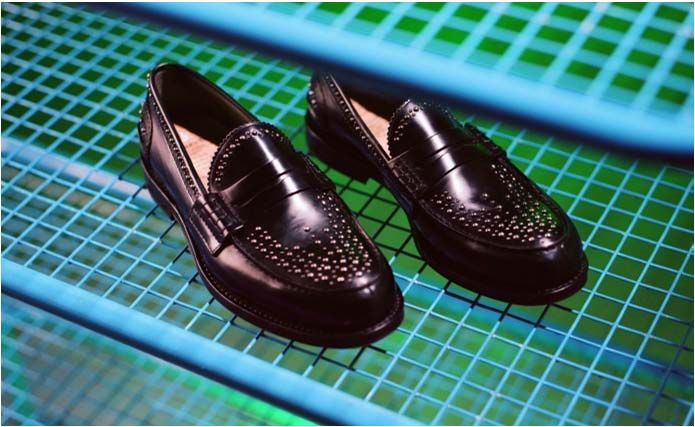
Communication
                Building brand identity and awareness through global sponsorship

   Prada to sponsor Luna Rossa and the 36th America’s Cup
   •   For the first time Prada is the Title and Presenting sponsor of the 36th America’s Cup
   •   Preliminary series to take place in 2019-2020
   •   The final competition will take place in Auckland in March 2021
   •   The sponsorship provides global brand exposure with events and social media campaigns

  The Prada Cup trophy
  •    For the first time the Challengers’ Selection Series for the America’s Cup, which will start in
       January 2021 in Auckland, will carry the Prada name

FY 2018 Results Presentation – March 15th 2019                                                           8
2018 Financial Review
                                                 Alessandra Cozzani
                                                        CFO

FY 2018 Results Presentation – March 15th 2019                        9
FY 2018: at a glance
Investment delivering growth
Condensed P&L
€m FY 2018 FY 2017 (*)
Net Revenues 3,142 100.0% 3,056 100.0%
COGS (880) 28.0% (811) 26.5%
Gross Margin 2,263 72.0% 2,246 73.5%
Selling (1,414) 45.0% (1,399) 45.8%
Advertising & Promotion (207) 6.6% (185) 6.0%
Product Development (125) 4.0% (130) 4.3%
G&A (192) 6.1% (171) 5.6%
Operating Expenses 1,939 61.7% 1,886 61.7%
EBIT 324 10.3% 360 11.8%
Tax rate% 31% 30%
Group Net Income 205 6.5% 249 8.1%
D&A 227 7.2% 228 7.5%
EBITDA 551 17.5% 588 19.2%
• Good Net Revenue performance - up by 6% at constant FX, mainly driven by full-price sales
• Opex increase mainly driven by brand investments in advertising and digital
• Margins impacted by negative FX / hedging: stable underlying trend
• 2019 fiscal year will benefit from Patent box
(*) 12 months ended December 31st
FY 2018 Results Presentation – March 15th 2019 10FY 2018: at a glance
Sound financial structure
Condensed Balance Sheet and Cash Flow
€m 31 Dec 18 31 Dec 17
Non current assets 2,700 2,565
Net operating working capital 638 546
Other current assets / (liabilities), net (38) (21)
Other non current assets / (liabilities), net (90) (121)
Net invested capital 3,211 2,970
Consolidated shareholders’ equity 2,897 2,866
Net financial position (surplus) / deficit 314 104
Equity + Net Financial Position 3,211 2,970
Operating cash flow 365 447 (*)
Capital expenditure 284 251 (*)
• Increase in working capital in line with merchandising strategy
• Gearing ratio low at 11%
• Increase in Capex driven by further investments in retail, software capabilities and industrial projects
(*) 11 months
FY 2018 Results Presentation – March 15th 2019 11Net Sales by Channel (€ mn) – Full Year
Full-price sales driving growth
% change % change
2017 2018 as reported same FX
Retail 2,444 81% 2,532 82% +4% +7%
Wholesale 565 19% 566 18% - +1%
Total 3,008 100% 3,098 100% +3% +6%
Retail
• Ongoing strategic reduction of markdown sales impacted by low single digit sales trends; more pronounced in H2 than H1
• Regular sales consistently up across the two semesters
• Strong double digit growth from e-commerce
Wholesale
• Positive performance from E-tailers throughout the year despite strong comparatives
• Continued selective approach to wholesale partners, notably in Europe
FY 2018 Results Presentation – March 15th 2019 12Net Sales by Geography (€ mn) – Full Year
Positive organic trends across all countries
% change % change
2017 2018
as reported same FX
Europe 1,170 39% 1,189 38% +2% +3%
Americas 432 14% 426 14% -1% +4%
Far East 973 32% 1,035 33% +6% +10%
Greater China 646 21% 675 22% +5% +8%
Japan 337 11% 350 11% +4% +7%
Middle East 93 3% 94 3% +1% +5%
Others 4 - 4 - -5% -3%
Total Sales 3,008 100% 3,098 100% +3% +6%
Europe
• Solid retail trends during the year, despite negative impact from social unrest in France
• Domestic consumption drove growth boosted by in-store initiatives
• Wholesale weighed on trends in H2
Far East
• Double digit growth in Asia Pacific mainly driven by Greater China and Korea
Americas
• Sound performance driven by domestic consumption
• Tourism weakened on back of USD strength in H2
Japan and Middle East
• Solid retail trends supported by both tourism and domestic consumption
FY 2018 Results Presentation – March 15th 2019 13Net Sales by Product (€ mn) – Full Year
Growth in all categories; successful product launches delivered
% change % change
2017 2018 as reported same FX
Leather Goods 1,703 57% 1,756 57% +3% +6%
Ready to Wear 625 21% 666 22% +7% +10%
Footwear 624 21% 616 20% -1% +2%
Others 57 2% 59 2% +4% +7%
Total 3,008 100% 3,098 100% +3% +6%
Leather goods
• Solid retail growth at Prada, driven by both iconic and new handbags
• Ongoing rebalancing of product portfolio through new launches in H2 (e.g. Sidonie, Belle, Sybille, Manuelle, Margit, Odette)
Ready to wear
• Positive trends across all brands and markets, with strong performance in Men’s RTW
• Lifestyle lines outperformed
Footwear
• Positive retail trend throughout the year
• Successful reception of sneaker collections and lifestyle for both Men and Women
FY 2018 Results Presentation – March 15th 2019 14Net Sales by Brand (€ mn) – Full Year
Prada brand driving growth
% change % change
2017 2018 as reported same FX
Prada 2,461 82% 2,558 83% +4% +7%
Miu Miu 459 15% 453 15% -1% +2%
Church’s 71 2% 69 2% -3% -2%
Other 17 1% 17 1% +4% +4%
Total 3,008 100% 3,098 100% +3% +6%
Prada
Good performance across all categories and markets throughout the year
Growth underpinned by consistent performance in leather goods
Miu Miu
RTW collections very well received; stable trend in footwear and leather goods
Wholesale trends in H2 weighed on retail performance
Church’s
Wholesale reorganisation offsetting consistent positive trends in retail
FY 2018 Results Presentation – March 15th 2019 15Gross margin development
Margins sustained despite FX headwinds
73.5% -0.1% -1.4% 72.0%
FY 2017 Other FX, hedging FY 2018
• Gross margins broadly in line with prior year at constant fx
• Ongoing investment in the supply chain, fully paid-for by contribution from increased full price sales
FY 2018 Results Presentation – March 15th 2019 16EBIT development
Stable underlying operating margins
+3.1% -2.9%
11.8% -1.4%
-0.3% 10.3%
2017 Gross Margin Opex Forex / Hedging One-off 2018
• Excluding FX and one off, operating margins remain stable
• Opex grew around €90 million, 5% at constant FX, of which circa 30% were variable costs
• The remaining Opex was allocated to costs such as advertising, promotional activities as well as retail events
to fuel sales, with the rest spent on growing the workforce to strengthen the organisation
FY 2018 Results Presentation – March 15th 2019 17Capex
Sustainable level of investment to support long term growth
284
Capex (€m)
(*) FY 2017 – 11 months 251
148
141
Corporate, IT Retail
&Industrial
136
110
FY-17 FY-18
• +9 net openings in FY-18: 29 openings and 20 closures
• ~120 renovation and relocation projects of which ~ 90 at Prada
• IT investment plan part of the Group’s broader digital transformation strategy
• Industrial projects: new Prada logistic hub in Tuscany
FY 2018 Results Presentation – March 15th 2019 18Net financial position
(€m)
(92)
227
(282)
208
(104)
(314)
(198) (314)
NFP
Jan-16
(111) (73)
NFP Net Income D&A Net Operating Capex Dividends Other NFP
Dec-17 Working Capital Dec-18
Positive Change
Negative Change
FY 2018 Results Presentation – March 15th 2019 19Dividend policy
(€m)
307
281 281 281
230
192
154
2012 2013 2014 2015 2016 2017 2018
Dividend
37% 45% 62% 85% 111% 77% 75%
payout (%)
Dividend 7.5 6.0
9 11 11 11 12
per share (€ cents)
FY 2018 Results Presentation – March 15th 2019 20Tech Roll-Out
Lorenzo Bertelli
Head of Marketing and Communication
FY 2018 Results Presentation – March 15th 2019 21Tech Roll-Out - 1
Ramping up e-commerce to reach global coverage by 2020
Successful steps in 2018
• New Miu Miu.com launched in Europe
• Enhanced access to Prada and Miu Miu experience
(Pradasphere and Miu Miu Club)
• New Church’s.com
Strong double digit growth in sales through our digital
channels
2019 activities
• Expanding omnichannel functions and improving user
experience
• New Miu Miu.com in US, Asia and Middle East
• Launch of Prada & Miu Miu e-commerce in new markets
• Launch of Car Shoe e-commerce
• Increasing collaborations with marketplaces
FY 2018 Results Presentation – March 15th 2019 22Tech Roll-Out - 2
Investing in technology to boost operational efficiency and effectiveness
Digital Retail
• Upgraded in-store app “Clientsphere”
New merchandising planning tool
• Technology supporting efficiency and effectiveness in the core processes
(merchandising planning, buying, replenishment)
Enhanced customer service
• Seamless remote customer experience
• New concierge functions launched in 5 regional hubs
Integrating CRM with AI
• Set up team of data scientists
• Cross-channel marketing automation to enable ad-hoc campaigns based on
behavioural customer analytics
• Increased incorporation of data between stores and social media channels
Implementing radio-frequency identification (RFID)
• Installation of RFID on our leather goods products to be rolled out on all
product lines
• App to identify product authenticity post sales & gather omnichannel
customer data
FY 2018 Results Presentation – March 15th 2019 23Tech Roll-Out - 3
Digital projects driving brand engagement
Ramp-up of digital communication
• Special launches for Prada Linea Rossa
• Prada Delivery Man
• Miu Miu Iconic Wardrobe
• Miu Miu Other Conversations
New digital channels
• Twitter Japan for both Prada and Miu Miu (2018)
• Kakao Talk (2019)
• Launch of Prada Spotify official profile (2019)
FY 2018 Results Presentation – March 15th 2019 24Outlook
Carlo Mazzi
Chairman
FY 2018 Results Presentation – March 15th 2019 25Outlook
• The process of business transformation started in 2017 is already delivering positive results. We are:
- Continuing the technological roll-out through the digitalization of client relationships to further leverage our competitive
advantage
- Enhancing the structure of our organization, taking significant necessary initiatives to fully deploy our brands’ potential
• As a result we expect a progressive return to volume and margin growth
FY 2018 Results Presentation – March 15th 2019 26Q&A SESSION
You can also read