Interim Report | Q2 & H1 2018 - Zalaris - Investor Relations
←
→
Page content transcription
If your browser does not render page correctly, please read the page content below

Interim Report | Q2 & H1 2018
16 August 2018

Presenters and agenda

  1. Highlights
  2. Financial performance in Q2/18 and
     H1/18
  3. Market trends
  4. Outlook

          Hans-Petter Mellerud
          Founder and CEO

© zalaris 2018                     Page: 2
Highlights | Strategy and operations
  Integration completed, well positioned for further growth

   ▪ Integration of new Zalaris entities
     prioritized in the first six months
   ▪ Technical onboarding and system
     integration is now successfully completed,
     GDPR compliant and with ISO certification
   ▪ Extended BPO agreement with SAP for
     another 5 years, a mutually beneficial
     partnership                                     ▪ Rebranding completed
   ▪ Successful launch of first BPO customer in
     UK – Statkraft                                  ▪ All acquired entities are
                                                       now flying the Zalaris flag
   ▪ Milestone contract signed with a leading
     German-based engineering and project
     management company. Scope includes
     optimising HR processes by using the
     highly recognised SAP SuccessFactors
     solutions.

© zalaris 2018                             Page: 3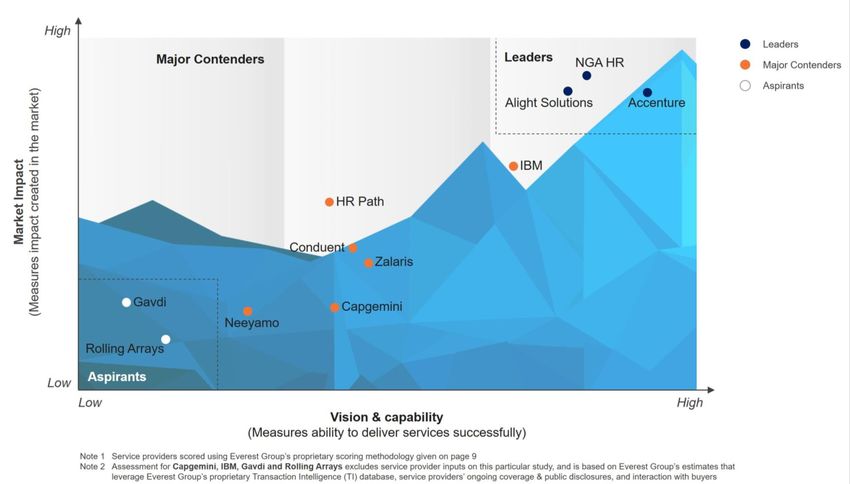
Highlights | Financial
  Growth in revenues, margins marked by integration

                                                                        ▪ Revenues reached NOK 189
    Key figures
                                                                          million, an increase of 49 %
                                     Apr-June           Jan-June          compared to Q2/17
    NOK million                     2018 2017          2018 2017
    Revenues                          189 127          375       233    ▪ Long-term revenues show
    Operating profit1                  1.5  7.2        12.8     18.0
    Profit for the period            -1.1 -4.6         10.3      0.8
                                                                          clear trend: Zalaris nearly
    EPS (NOK)                       -0.06 -0.23        0.51     0.04      doubled in size. H1/18
                                                                          revenues up 61 % vs H1/17.
 1 Operating     profit before other costs
                                                                        ▪ Margins transitorily marked by
    Revenues                                        194 186 189           integration activities
                                              151
                         105 106
                                        127                             ▪ Current priorities: Margin
         95       98
                                                                          improvement, continued
                                                                          organic and non-organic
                                                                          growth
      Q2 16            Q4 16          Q2 17         Q4 17       Q2 18

© zalaris 2018                                                Page: 4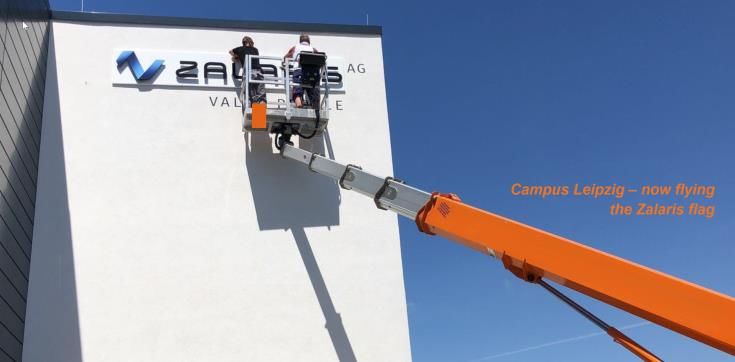
Revenue split
  Organic growth, well aligned with market demand

                  Distribution of revenues                              ▪ Growth through acquisitions, more
                 by geography (in per cent)                               balanced presence across Europe.

                                 3           4           2              ▪ Year-on-year organic growth was
        21                                                                8%, positively affected by timing of
                    32
                                 40          38          40               project revenues
                                                                        ▪ Nordics & Baltics growth mostly in
                                                                          HR Outsourcing segment
        79
                    68
                                 57          58          58
                                                                        ▪ Important wins in Central Europe in
                                                                          Q2, supporting region’s future growth
                                                                          ambitions
     Q2 17         Q3 17      Q4 17       Q1 18       Q2 18             ▪ UK & Ireland is building promising
        Nordics & Baltics    Central Europe       UK & Ireland            pipeline of potential contracts
          UK & Ireland included after acquisitions in Q4/17

© zalaris 2018                                                Page: 5
Customer reach
  Number of employees served by HR Outsourcing

                 Number of employees
                    served (1000’)            ▪ Number of employees and group full
                                                time equivalent at the end of the
                                       283      quarter were 840 and 779.
                               280            ▪ Number of customer employees
                                                served by HR Outsourcing per month
                                                is 283 000
       272
                         271                  ▪ Expansion into Ireland with Circle K in
                                                Q1/18, a long-term customer. New
                   266                          services provided in Norway, UK and
                                                Germany for Statkraft, a leading
                                                company in hydropower and Europe’s
                                                largest generator of renewable
                                                energy.
                                              ▪ New contract with Aker BP aiming to
     Q2 17 Q3 17 Q4 17 Q1 18 Q2 18
                                                build a state-of-the art human capital
                                                management system.
© zalaris 2018                               Page: 6
Key financials
Second quarter 2018
Group operating revenues. Y-o-y revenues up
  NOK 62 million to nearly NOK 190 million

             Operating revenues              ▪ Total revenue in Q2/18 was NOK 189
              (in NOK million)                 million, NOK 62 million or 49% growth
                                               compared to the same quarter previous
   200                       194
                                   186 189
                                               year.
                                             ▪ Corresponding organic growth was 8 %,
                       151                     positively affected by timing of project
   150
                 127                           revenues
                                             ▪ Operating revenues for H1/18 reached NOK
   100                                         375 million, up 61 per cent vs H1/17.
                                             ▪ Low variable project revenues in the quarter
     50                                        as consulting capacity was engaged in
                                               internal - and customer transformation
                                               projects, reducing potential billable time
       0
              Q2 Q3 Q4 Q1 Q2
             2017 2017 2017 2018 2018

© zalaris 2018                                 Page: 8
Group operating profit |
Integration activities affecting margins
Group operating profit ▪ Q2/18 operating profit for the group was NOK
(in NOK million) 1.5 million, representing a 0.8% margin
▪ While a decline in operating profit in the quarter
12,4 was expected, the level is not satisfactory
11,3
▪ Profit margin marked by post-merger integration
activities to capture synergies and enable
scalability.
7,2
6,7 ▪ Increased overhead costs driven by internal
projects, including GDPR and ISO certification,
and business development activities.
5.7 % Profit margin 0.8 % ▪ No significant currency effects on the operating
1,5 margin Q2/18
▪ Net financial cost was 0.5 million, including an
Q2 Q3 Q4 Q1 Q2
2017 2017 2017 2018 2018 unrealized currency profit of 3.3 million related
to euro debt. Tax expense in Q2/18 was 2
© zalaris 2018
million
Page: 9Financial position
Capital structure influenced by acquisitions
Cash and cash flows Q2/18
Changes in balance sheet and cash flows
(in NOK million)
60 0,6 8,9 ▪ Group cash and cash equivalents were
NOK 37.4 million at the end of Q2/18
8,7
50
55,5 ▪ Cash flow from financing activities reflects
repayment of borrowings (NOK 14.7 million) and
40 0,9 dividend payments (NOK 13.0 million), partly
offset by increased utilization of bank overdraft
(NOK 18.7 million).
30
▪ As of 30 June, total assets amounted to
NOK 564 million and total equity was NOK 106
20 37,4 million. This equals an equity ratio of 18.7%
(27.5%).
10
▪ Long term interest bearing-debt as of 30 June
amounted to NOK 199.4 million (NOK 161.7)
0
Beginning Operating Investing Net Foreign End of
million).
of period activities activities financing exch. period
activities Difference
© zalaris 2018 Page: 10Key financials | Business segment
Second quarter 2018
Segment reporting includes
only external revenues and external profitRevenues by segment
Growth in HR Outsourcing and Consulting
HR Outsourcing Consulting Cloud Services
(NOK million) (NOK million) (NOK million)
▪ Q2/18 revenues up 19.5% ▪ Revenues increased y-o-y with ▪ Cloud Services revenues growth
compared with the same quarter NOK 37 million, mainly due to is mainly related to acquisition of
previous year. acquired business in Central sumarum and ROC in May and
Europe October 2017, respectively.
▪ Growth mainly attributable to
acquired business in Central ▪ Consulting capacity in Q2/18 ▪ Recurring cloud revenues
Europe and timing of project engaged with customer increased while variable cloud
revenues. implementation projects and revenues decreased as a
internal system integration consequence of consulting
▪ Underlying organic growth was projects. resources being utilized in HR
4.0%, driven by BPO launches in outsourcing transformation
previous quarters, as well as an projects.
increase in change order activity.
106 108 110 54 54
96 47
92 34
29 31
26 26
16 19
Q2 Q3 Q4 Q1 Q2 Q2 Q3 Q4 Q1 Q2 Q2 Q3 Q4 Q1 Q2
2017 2017 2017 2018 2018 2017 2017 2017 2018 2018 2017 2017 2017 2018 2018
© zalaris 2018 Page: 12Profit by business segment ex. group overhead
Positioned to improve profit margins
HR Outsourcing Consulting Cloud Services
(NOK million) (NOK million) (NOK million)
▪ Operating profit in Q2/18 ▪ Operating loss of NOK 0.1 in ▪ Operating profit of NOK 2.0 million
amounted to NOK 15.3 million or Q2/18 in Q2/18, an increase of NOK 1.7
13.9% (NOK 11.7 million or million from Q2/17.
12.7%). ▪ The loss is mainly due to change
in accounting estimates affecting ▪ The positive development reflects
▪ The underlying business showed profit allocation between first and the increase in revenues.
a positive margin development second quarter in 2018.
compared to same quarter
previous year mainly driven by the
increased level of variable billing
with good margins.
15,9 16,3 15,3 7,0
12,7 3,4
11,7 3,3
1,9 2,5
1,7 2,0
-0,1 0,3
-3,3
Q2 Q3 Q4 Q1 Q2 Q2 Q3 Q4 Q1 Q2 Q2 Q3 Q4 Q1 Q2
2017 2017 2017 2018 2018 2017 2017 2017 2018 2018 2017 2017 2017 2018 2018
© zalaris 2018 Page: 13Market update and concluding remarks
Leading Analyst Firm Names Zalaris a ‘Major Contender’
  Recognition marks Zalaris’ position as top provider of SAP SuccessFactors-
  based HR solutions and services
  Everest Group SuccessFactors-based human resources business processs services –
  Service provider landscape with services PEAK MatrixTM assessment 2018

                                                                    This assessment has been
                                                                    licenced for exclusive use
                                                                    and distribution by Zalaris

© zalaris 2018                         Page: 15
Concluding remarks
Priorities: Margin improvement and continued growth
▪ Zalaris enters a new era as ROC Group and sumarum AG are fully
integrated; Stronger and better then ever before
▪ The integration efforts will enable synergy realization and margin
improvement
▪ Zalaris’ key financial targets with a clear focus on improving
operating margin and increase historic growth
▪ One key priority going forward is to take full advantage of investments
made in new systems, structures and geographical reach
▪ The pipeline of opportunities remains strong across the group and
management is optimistic about growth prospects in current and new
markets.
▪ Customers have transformation at the top of their minds as they seek to
advance in the data-driven culture of the future. Zalaris is well
positioned. We do not lean back to rest
© zalaris 2018 Page: 16Important notice
This Presentation includes certain forward-looking statements relating to the business, financial performance and results of the Company and/or the industry
in which it operates. Forward-looking statements relate to future circumstances and results and other statements that are not historical facts, sometimes
identified by the words “believes”, “expects”, “predicts”, “intends”, “projects”, “plans”, “estimates”, “aims”, “foresees”, “anticipates”, “targets”, and similar
expressions. The forward-looking statements contained in this Presentation, including assumptions, opinions and views of the Company or cited from third
party sources, are solely opinions and forecasts which are subject to material risks, uncertainties and other factors that may cause actual events to differ
materially from any anticipated development. Neither the Company nor any of its subsidiaries or any such person’s officers or employees provide any
assurance that the assumptions underlying such forward-looking statements are free from errors, nor do any of them accept any responsibility for the future
accuracy of the opinions expressed in this Presentation or the actual occurrence of the forecasted developments. The Company assumes no obligation,
except as required by law, to update any forward-looking statements or to conform these forward-looking statements to its actual results.
AN INVESTMENT IN THE COMPANY INVOLVES SIGNIFICANT RISK AND SEVERAL FACTORS COULD CAUSE THE ACTUAL RESULTS,
PERFORMANCE OR ACHIEVEMENTS OF THE COMPANY TO BE MATERIALLY DIFFERENT FROM ANY FUTURE RESULTS, PERFORMANCE OR
ACHIEVEMENTS THAT MAY BE EXPRESSED OR IMPLIED BY STATEMENTS AND INFORMATION IN THIS PRESENTATION. A NON-EXHAUSTIVE
OVERVIEW OF RELEVANT RISK FACTORS THAT SHOULD BE TAKEN INTO ACCOUNT WHEN CONSIDERING AN INVESTMENT IN THE SHARES
ISSUED BY THE COMPANY IS INCLUDED IN THIS PRESENTATION. SHOULD ONE OR MORE OF THESE RISKS OR UNCERTAINTIES MATERIALISE,
OR SHOULD UNDERLYING ASSUMPTIONS PROVE INCORRECT, ACTUAL RESULTS MAY VARY MATERIALLY FROM THOSE DESCRIBED IN THIS
PRESENTATION. THE COMPANY DOES NOT INTEND, AND DOES NOT ASSUME ANY OBLIGATION, TO UPDATE OR CORRECT THE INFORMATION
INCLUDED IN THIS PRESENTATION.
No representation or warranty (express or implied) is made as to, and no reliance should be placed on, any information, including projections, estimates,
targets and opinions, contained herein, and no liability whatsoever is accepted as to any errors, omissions or misstatements contained herein, and,
accordingly, neither the Company nor any of its subsidiaries nor any such person’s officers or employees accepts any liability whatsoever arising directly or
indirectly from the use of this Presentation.
The contents of this Presentation are not to be construed as legal, business, investment or tax advice. Each recipient should consult its own legal, business,
investment or tax adviser as to legal, business, investment or tax advice. By attending or receiving this Presentation you acknowledge that (i) you will be solely
responsible for your own assessment of the market and the market position of the Company and that you will conduct your own analysis and be solely
responsible for forming your own view of the potential future performance of the Company’s business, (ii) if you are a U.S. person, you are a QIB (as defined
below), and (iii) if you are a non-U.S. person, you are a Qualified Investor or a Relevant Person (as defined below).
This Presentation does not constitute an offer to sell, or a solicitation of an offer to buy, any securities in any jurisdiction or to any person in which or to whom
it is unlawful to make such an offer or solicitation. The distribution of this Presentation and the offering, subscription, purchase or sale of securities issued by
the Company are in certain jurisdictions restricted by law. Persons into whose possession this Presentation may come are required by the Company to inform
themselves about, and to comply with, all applicable laws and regulations in force in any jurisdiction in or from which it invests in the securities issued by the
Company or receives or possesses this Presentation and must obtain any consent, approval or permission required under the laws and regulations in force in
such jurisdiction. The Company shall not have any responsibility or liability whatsoever for these obligations.
© zalaris 2018 Page: 17We open for questions
Zalaris ASA
Thank you!                                                      PO Box 1053
                                                                NO-0218 Oslo
Hans-Petter                        Nina Stemshaug
Mellerud
CEO & Founder                      CFO                          +47 4000 3300
hans-petter.mellerud@zalaris.com   nina.stemshaug@zalaris.com   www.zalaris.com
You can also read