INFRONT ASA Q2 2019 Results - 22 August 2019
←
→
Page content transcription
If your browser does not render page correctly, please read the page content below

INFRONT ASA
Q2 2019 Results
22 August 2019

Disclaimer

This Presentation might include certain forward-looking statements relating to the business, financial performance and results of the Company and/or the industry in which it operates.
Forward-looking statements relate to future circumstances and results and other statements that are not historical facts, sometimes identified by the words “believes”, “expects”, “predicts”,
“intends”, “projects”, “plans”, “estimates”, “aims”, “foresees”, “anticipates”, “targets”, and similar expressions. The forward-looking statements contained in this Presentation, including
assumptions, opinions and views of the Company or cited from third party sources, are solely opinions and forecasts which are subject to material risks, uncertainties and other factors that
may cause actual events to differ materially from any anticipated development. Neither the Company nor any of its subsidiaries or any such person’s officers or employees provide any
assurance that the assumptions underlying such forward-looking statements are free from errors, nor do any of them accept any responsibility for the future accuracy of the opinions
expressed in this Presentation or the actual occurrence of the forecasted developments. The Company assumes no obligation, except as required by law, to update any forward-looking
statements or to conform these forward-looking statements to its actual results.

An investment in the company involves significant risk and several factors could cause the actual results, performance or achievements of the company to be materially different from any
future results, performance or achievements that may be expressed or implied by statements and information in this presentation. A non-exhaustive overview of relevant risk factors that
should be taken into account when considering an investment in the shares issued by the company is included in this presentation. Should one or more of these risks or uncertainties
materialise, or should underlying assumptions prove incorrect, actual results may vary materially from those described in this presentation. The company does not intend, and does not
assume any obligation, to update or correct the information included in this presentation.

No representation or warranty (expressed or implied) is made as to, and no reliance should be placed on, any information, including projections, estimates, targets and opinions, contained
herein, and no liability whatsoever is accepted as to any errors, omissions or misstatements contained herein, and, accordingly, neither the Company nor any of its subsidiaries nor any such
person’s officers or employees accepts any liability whatsoever arising directly or indirectly from the use of this Presentation. The contents of this Presentation are not to be construed as
legal, business, investment or tax advice. Each recipient should consult its own legal, business, investment or tax adviser as to legal, business, investment or tax advice. By attending or
receiving this Presentation you acknowledge that (i) you will be solely responsible for your own assessment of the market and the market position of the Company and that you will conduct
your own analysis and be solely responsible for forming your own view of the potential future performance of the Company’s business, (ii) if you are a U.S. person, you are a QIB (as defined
below), and (iii) if you are a non-U.S. person, you are a Qualified Investor or a Relevant Person (as defined below).

This Presentation does not constitute an offer to sell, or a solicitation of an offer to buy, any securities in any jurisdiction or to any person in which or to whom it is unlawful to make such an
offer or solicitation. The distribution of this Presentation and the offering, subscription, purchase or sale of securities issued by the Company are in certain jurisdictions restricted by law.
Persons into whose possession this Presentation may come are required by the Company to inform themselves about, and to comply with, all applicable laws and regulations in force in any
jurisdiction in or from which it invests in the securities issued by the Company or receives or possesses this Presentation and must obtain any consent, approval or permission required under
the laws and regulations in force in such jurisdiction. The Company shall not have any responsibility or liability whatsoever for these obligations.

                                                                                                                                                                                  2
Presenters and agenda

           Kristian Nesbak
           CEO & Co-founder
                              Agenda

                              • Q2 2019 Highlights

                              • VWD transaction

                              • Operations Review
              Max Hofer
                 CFO          • Financial Review

                              • Summary

                              ir@infrontfinance.com

                                                      3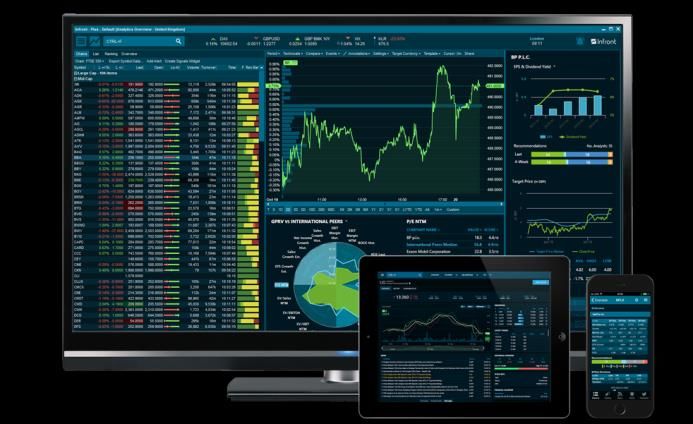
Q2 2019: Delivering on M&A strategy and underlying revenue growth
• Acquisition of VWD in Germany completed, securing Infront a top-3 financial terminal
  provider position in Europe

• Revenue at NOK 105.9 million, up 56% from NOK 68.1 million in Q2 2018

        • Driven by Market Connect acquisition in Italy and organic growth

• Adjusted EBITDA* of NOK 20.8 million compared to NOK 10.7 million in Q2 2018

        • Adj. EBITDA before IFRS 16 implementation of NOK 18.6 million

• Customer base doubled YoY measured by paying terminals and solutions users after
  inclusion of Infront Italia

  Quarterly revenue                                                                                  Adj.EBITDA* and margin
  NOK million                                                                                        NOK million                      Margin
                                56%
                                                                                                     25                                50%
  100                                                                                                                         20.8     45%
   80                                                                                                20                                40%
                                                                                                                                       35%
   60                                                                                                15                                30%
                                                  105.9                                                            10.7                25%
   40                                                                                                10                                20%
                    68.1                                                                                                      19.7%
                                                                                                                   15.7%               15%
   20
                                                                                                      5                                10%
    0                                                                                                                                  5%
                    Q2 18                         Q2 19                                               0                                0%
                                                                                                                   Q2 18      Q2 19

  *) EBITDA Q2 2019 adjusted for M&A-related costs of NOK 10.8 million and EBITDA Q2 2018 adjusted
                                                                                                                                        4
  for other income of NOK 0.3 million
Successfully executing on M&A strategy

                                         • Acquisition of vwd Group was completed on 17 July 2019

                                         • Final purchase price of EUR ~130 million on an enterprise
                                           value basis

                                         • Financed through issue of four-year EUR 105 million bond
                                           in April and oversubscribed NOK 242 million rights issue
                                           in June

                                         • Initial integration well underway and vwd Group financials
                                           will be included in the Q3 reporting

                                                                                                        5
The leading European provider of financial terminals and market data

                                             • More diversified revenue base with ~90 000 professional users,
                                               ~3 600 customers, broader product offering and more markets

                                             • Highly complementary operations with significant cross- and
                                               upselling opportunities

                                             • Exposure to the growing regulatory technology segment and
                                               the wealth and asset management market

                                             • More than 500 employees in 14 countries

                                             • Platform for growth across Europe and in other markets

Source: Company information, Burton Taylor
1) EMEA financial data terminal market                                                                          6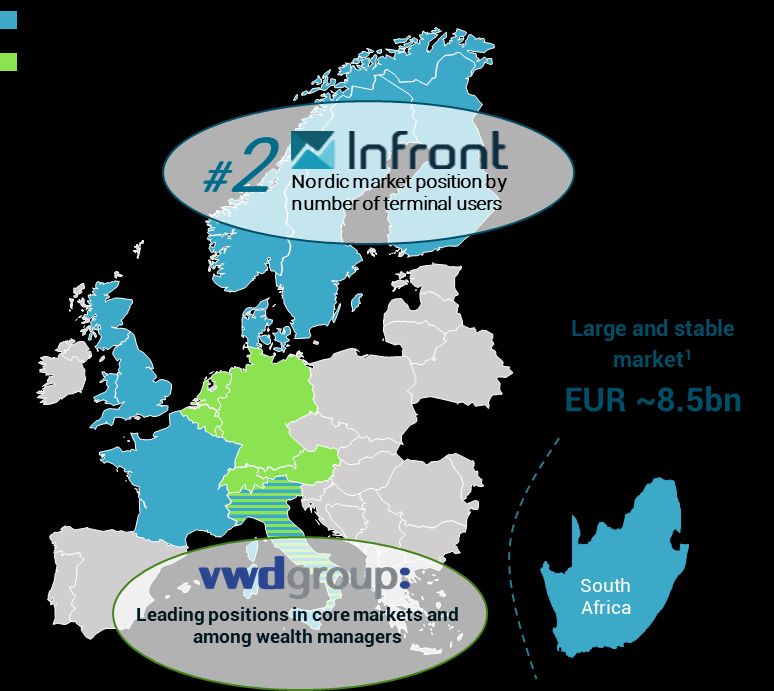
Integration process underway and initial synergies realized

  • Integration team appointed and work started to ensure efficient
    transition and combination efforts

       • Technology platform, organization, products and services

  • Successfully initiated consolidation of data feeds and licenses

       • Identified annual cost savings of NOK 20 million to be realised
         over the initial 12 months

       • Good traction in efforts and progress according to plan

  • Further estimated NOK 60-85 million in total cost savings over the
    next years

       • Additional operational efficiencies and scaling from
         strengthened position and product offering, and expanded
         reach in Europe

                                                                           7
Executing according to our long-term strategy
3
A top 3 vendor of
Product terminals to finance
R&D
professionals in
1 Europe
Strengthen
position in
the Nordics
4
European
expansion
through M&A
2
Growth in new and
newly established
markets
8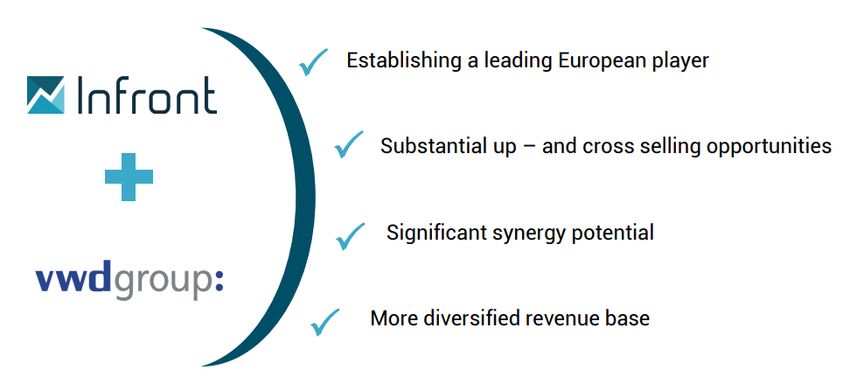
OPERATIONAL
  REVIEW
Continued growth for Terminals and Solutions from recent acquisition
                                                                             Number of users
                                                               ‘000s users

• Number of paying professional users more than doubled due
  to acquisition of Market Connect in Italy

• Web Technology agreements continued positive contribution
  to revenue through the Handelsbanken and SEB web solutions

• Revenue of NOK 81.8 million, up 82% from Q2 2018
     • ~34% of segment revenue in SEK and ~44% in EUR

                                                                             Quarterly revenues
                                                               NOK million
                                                               100.0
                                                                                                  81.8
                                                                 80.0

                                                                 60.0
                                                                              44.9
                                                                 40.0

                                                                 20.0

                                                                  0.0
                                                                                 Quarterly revenues
                                                                                                         10
Growth for Analytics & Other, overall stable development for News
Quarterly revenues
• News division revenue stable at-1% YoY NOK million Q2 2018
• 85% of segment revenue in Swedish krona Q2 2019
• Direkt again voted best financial news wire in Sweden 16
14.5 14.4
• Strong interest for the new Insight Direkt news service in 14
Sweden
12
• In Norway, Infront TDN showed good momentum, extending
its reach by launching a news feed for business media 9.7
10 8.7
8
• Analytics and Other division revenue increased by +11% YoY 6
• Organic growth for Infront Analytics and revenue synergies
from Infront Data integration 4
• Estimates platform launched on the Infront Professional 2
Terminal (IPT) with quarterly and annual earnings estimates
as well as historical data for 1,200 companies across Europe 0
News Analytics & Other
11FINANCIAL REVIEW
Q2 2019 financial highlights
• Revenue at NOK 105.9 million, up 56% from NOK 68.1 million in Q2 2018

       • 76% of Q2 2019 revenue was recognized in foreign currency

       • 99% was recurring subscription revenue

• Adjusted EBITDA* of NOK 20.8 million compared to NOK 10.7 million in Q2 2018

       • Adj. EBITDA before IFRS 16 implementation NOK 18.6 million

• Adjusted EBITDA margin of 19.7% compared to 15.7% in Q2 2018

       • Driven mainly by organic growth and synergies from acquired business of Market Connect

 Quarterly revenue                                                                                   Adj.EBITDA* and margin
 NOK million                                                                                         NOK million                      Margin
                              56%
                                                                                                     25                                50%
 100                                                                                                                          20.8     45%
                                                                                                     20                                40%
  80
                                                                                                                                       35%
  60                                                                                                 15                                30%
                                                105.9                                                              10.7                25%
  40                                                                                                 10                                20%
                  68.1                                                                                                        19.7%
                                                                                                                   15.7%               15%
  20
                                                                                                      5                                10%
   0                                                                                                                                   5%
                  Q2 18                         Q2 19                                                 0                                0%
                                                                                                                   Q2 18      Q2 19
  *) EBITDA Q2 2019 adjusted for M&A-related costs of NOK 10.8 million and EBITDA Q2 2018 adjusted
  for other income of NOK 0.3 million. Adj. EBITDA margin Q2 2019 before IFRS 16 implementation at                                      13
  17.5%
Recent acquisition of Infront Italia lifting revenues and EBITDA
Revenue Adj* Opex**
• 56% YoY revenue increase due to
NOK million NOK million
acquisition of Infront Italia, organic
100
120
104.8 105.9 86.4 85.1 customer growth, price increases and
90
implementation of retail trading solutions
100 80
70
80 68.3 70.8 57.4 57.2 58.8 • Gross margin negatively impacted by
68.1 60 inclusion of Infront Italia
60 50
40 • Adjusted Opex increased YoY, mainly
40 30 driven by Infront Italia, as well as higher
20 personnel costs across the Group to
20
10 support future growth.
0 0
Q2 18 Q3 18 Q4 18 Q1 19 Q2 19 Q2 18 Q3 18 Q4 18 Q1 19 Q2 19 • Adjusted EBITDA increased by 125% YoY
(incl. IFRS16 effects) positively impacted
Gross Margin % Adj. EBITDA* and margin** by inclusion of Infront Italia and synergy
NOK million effects across the Group
80% 71.7 % 25 25%
70% 67.5 % 20.8 • Infront Italia synergy capture on track
61.6 % 18.4
20 20% with consolidation of data feeds and
60% 66.9 %
59.9 % licenses expected to yield NOK 7m in
50% 15
12.0
15% annual cost savings, of which annualized
40% 10.7 11.0 savings of NOK 5m to be realized from
30% 10 10% Q2 2019. Additional operational
improvements expected to deliver further
20%
5 5% NOK 5-10m in annual cost savings in the
10% long-term
0% 0 0%
Q2 18 Q3 18 Q4 18 Q1 19 Q2 19 Q2 18 Q3 18 Q4 18 Q1 19 Q2 19
* Adjusted for M&A-related costs incurred and one-time adjustment for impairment (of acquired SIX contracts), Q1 2019
restated opex amounted to NOKm 86.9 due to a reclassification to depreciation and amortization
** Adj. EBITDA of NOK 18.6m and adj. EBITDA margin of 17.5% in Q2 2019 before IFRS 16 implementation, the IFRS 16 effects positively impacted Q2 2019 14
Opex by NOK 2.3mAcquisition driving revenue growth across regions and segments
Revenues per Region
• Norway: Revenue slightly down YoY at NOK
NOK million 25.6 million, affected by contract loss in
50 non-core business segment
45 42.9 42.5
37.8
40 35.4 35.9 36.6 35.4 • Sweden: Revenue increased to NOK 37.8
35 million, positive revenue contribution from
30 27.4 26.6 26.4 26.5 solution sales and organic growth in core
25.6
25 products
20
15 • Other regions: Revenue increased NOK 37.2
10 5.3 5.8
7.8 million YoY to NOK 42.5 million driven by
5 inclusion of Infront Italia and sales growth in
0 UK, Finland and South Africa
Q2 18 Q2 19 Q2 18 Q2 19 Q2 18 Q2 19
Norway Sweden Other regions
• Revenue per Segment: Terminal and
Revenues per Segment Solutions revenue up 82% YoY due to the
NOK million
acquisition of Infront Italia, organic growth
90
and new Infront Web Technology sales.
81.6 81.8 News down 1% and Analytics segments up
80 11% YoY, respectively
70
60
50 44.9 45.0 47.9
40
30
20 14.5 14.9 13.7 13.5 14.4
8.7 8.3 9.2 9.8 9.7
10
0 Q218 Q219 Q218 Q219 Q218 Q219
Terminals and Solutions News Analytics & Other
15Strong cash position throughout Q2
Cash Flow 2019 as of 30.06.2019
NOK million • Operating CF: NOK +1.1 million
( 2.8)
Profit before tax of NOK 0.1 million. NWC changes
reduced cash by NOK 15.1 million, mainly driven
1,200
by seasonality effects experienced at Infront
Italia. Other items had a net positive cash effect
of NOK 16.2 million, including taxes paid of NOK
1,000 1.8 million and depreciation and amortization of
NOK 17.3 million
800 • Investing CF: NOK -16.6 million
1 283.8
NOK 3.9 million paid for SIX related transaction
1 215.1
costs. NOK 12.6 million of PP&E investments &
600 capitalized R&D
• Financing CF: NOK +1 215.1 million
400 Mainly net proceeds from equity issue and bond
issue, NOK 227.2 million and NOK 991.2 million
respectively.
200
• End of the period cash position: NOK 1283.8 million
1.1 ( 16.6)
87.0
0
Cash, CF from CF from CF from Effects of FX Cash, End of
Beginning of Operations Investments Financing changes on the period
the year cash
16Summary
Quarterly Revenues
NOK million
• Leading European position secured with acquisitions of
vwd Group and Infront Italia
104.8 105.9
• Focus going forward on integration and synergy
capture
• Continued user growth supports recurring subscription 70.8
68.1 68.3
revenue base
• Positive sales pipeline across regions and upsell
potential supports long-term organic growth ambition
• Potential for further attractive M&A opportunities
Q2 18 Q3 18 Q4 18 Q1 19 Q2 19
17Q&A ir@infrontfinance.com
Next Quarterly Report
• Quarterly Report Q3 2019 to be published on 14 November 2019

• IR Mailing list

                                                                 19
You can also read