Results Presentation For the year ended 31 December 2017 - 6 MARCH 2018 - Aggreko plc

Page created by Eduardo Franklin
 
CONTINUE READING
Results Presentation For the year ended 31 December 2017 - 6 MARCH 2018 - Aggreko plc
6 MARCH 2018

Results
Presentation
For the year ended
31 December 2017

                     Results Presentation March 2018   1
Results Presentation For the year ended 31 December 2017 - 6 MARCH 2018 - Aggreko plc
Introduction
Chris Weston
CEO

               Results Presentation March 2018   2
Results Presentation For the year ended 31 December 2017 - 6 MARCH 2018 - Aggreko plc
Operating
& financial review
Heath Drewett
CFO

                     Results Presentation March 2018   3
Results Presentation For the year ended 31 December 2017 - 6 MARCH 2018 - Aggreko plc
Group summary
PBT in line with market expectations
                                                Movement                    Group revenue up 4%,
                                                              CHANGE
                                                                             9% excluding Argentina
                                                               excluding
£m
pre-exceptional items        FY17    FY16    CHANGE
                                                            pass-through    Exceptional charge of
                                                       fuel and currency

Revenue                      1,730   1,515      14%                 4%
                                                                             £41 million relating to
Operating profit              229     248      (8)%              (10)%
                                                                             investment in our business
Net interest expense          (34)    (27)    (28)%
                                                                             priorities programme
Profit before tax             195     221     (12)%
                                                                            Tax rate of 29%
Taxation                      (57)    (63)       9%
Profit after tax              138     158     (13)%                         Recommended final dividend in
Diluted earnings per share   53.9p   61.9p    (13)%                          line with 2016
Dividend per share           27.1p   27.1p         -
Operating margin              13%     16%      (3)pp
ROCE                          11%     13%      (2)pp

                                                                                          Results Presentation March 2018   4
Results Presentation For the year ended 31 December 2017 - 6 MARCH 2018 - Aggreko plc
Movement
 Business                                                                                                                                CHANGE
 performance                                pre-exceptional items                                 FY17        FY16   CHANGE
                                                                                                                                          excluding
                                                                                                                                           currency

                                            Revenue (£m)                                          720         629       15%                     9%
 RENTAL SOLUTIONS                           Operating profit (£m)                                  81          52       57%                    49%
                                            Operating margin                                      11%          8%
                                            ROCE                                                  12%          8%
 REVENUE
                                            Fleet capital expenditure (£m)                         55          68
 (% OF GROUP excl. pass-through fuel)

 45%                                        % REVENUE BY SECTOR FY17
                                                   Business services & construction                     21%
 FLEET
                                                          Petrochemical & refining                17%
 at 31 December (MW)
                                                                           Utilities        11%
                                                                            Events          10%
          FY17                      FY16                                 Oil & gas          9%
          2,396                  2,255                              Manufacturing       8%
                                                                            Mining     5%
    56%                       52%                                            Other                 19%
DIESEL     GAS                UTILISATION
                                                                                                                      Results Presentation March 2018   5
Results Presentation For the year ended 31 December 2017 - 6 MARCH 2018 - Aggreko plc
Movement
 Business                                                                                                                                   CHANGE
 performance                                  pre-exceptional items                                 FY17   FY16         CHANGE
                                                                                                                                             excluding
                                                                                                                                              currency

                                              Revenue (£m)                                          340    262             30%                    20%
 POWER SOLUTIONS                              Operating profit (£m)                                  55     32             71%                    53%
 INDUSTRIAL                                   Operating margin                                      16%    12%
                                              ROCE                                                  11%     7%
 REVENUE
                                              Fleet capital expenditure (£m)                         43     37
 (% OF GROUP excl. pass-through fuel)

 21%                                          % REVENUE BY SECTOR FY17
                                                                           Oil & Gas                              39%
 FLEET
                                                     Business services & construction               17%
 at 31 December (MW)
                                                                              Events          11%
                                                                      Manufacturing       8%
         FY17                       FY16                                     Utilities   7%
68%      2,521                    2,465                                       Mining     7%
                          63%                               Petrochemical & refining     2%
                                                                               Other          9%
DIESEL    GAS                   UTILISATION
                                                                                                                         Results Presentation March 2018   6
Results Presentation For the year ended 31 December 2017 - 6 MARCH 2018 - Aggreko plc
Movement
 Business                                                                                                        CHANGE
 performance                                 pre-exceptional items &
                                                                              FY17    FY16   CHANGE
                                                                                                            excluding pass-
                                                                                                               through fuel
                                             excluding pass-through fuel                                      and currency

 POWER SOLUTIONS                             Revenue (£m)                     531     564       (6)%                  (9)%

 UTILITY                                     Operating profit (£m)             96     164     (42)%                  (42)%
                                             Operating margin                 18%     29%
 REVENUE                                     ROCE                             10%     19%
 (% OF GROUP excl. pass-through fuel)        Fleet capital expenditure (£m)   148     136

 34%                                         % REVENUE BY SECTOR FY17
                                                      Utilities                      83%
 FLEET
                                                     Oil & gas 7%
 at 31 December (MW)
                                                       Mining 6%
                                                Manufacturing     3%
                         79%
74%      FY17                      FY16                 Other     1%
         5,004                   4,947

DIESEL    GAS    HFO           UTILISATION
                                                                                              Results Presentation March 2018   7
Results Presentation For the year ended 31 December 2017 - 6 MARCH 2018 - Aggreko plc
Cash flow

£m                                         FY17    FY16
EBITDA                                     529     533      Capital expenditure of £272 million
Working capital                             (51)   (119)
                                                                −   Fleet capex of £246 million
Cash flows relating to exceptional items    (30)    (23)
Other                                         2      (3)    Three acquisitions completed in year
Operating cash flow                        450     388
Tax                                         (69)    (64)
                                                                −   Younicos £45m
Net interest                                (34)    (26)        −   KBT £25m
Acquisitions                                (73)    (22)
                                                                −   TuCo £3m
Purchase of fixed assets                   (272)   (263)
Other fixed asset movements                   9      18
                                                            Net debt to EBITDA of 1.2 times, unchanged
Free cash flow                               11      31
Dividends                                   (69)    (69)
Changes in equity                             -      (8)
Net cash flow                               (58)    (46)
Exchange                                     55    (114)
Movement in net debt                         (3)   (160)
Net debt                                   (652)   (649)
                                                                                         Results Presentation March 2018   8
Results Presentation For the year ended 31 December 2017 - 6 MARCH 2018 - Aggreko plc
Working capital

Inventory                                                                             NET POSITION
 Increased activity driven by major events and growth in
  Eurasia, offset by improved inventory management                               INVENTORY
                                                                                          -1 2017
Payables                                                                              -21    2016
 Improvement in supplier terms; best practice employed
  to leverage scale                                                                              PAYABLES
                                                                                        2017                           +113
Receivables                                                                           -17    2016
 Revenue growth drove £90 million outflow
                                                                   RECEIVABLES
 £36 million outflow as a result of payment delays in      -163                             2017
  Africa                                                                   -81               2016

 Power Solutions Utility provision increased
  $23 million
                                                                                             Results Presentation March 2018   9
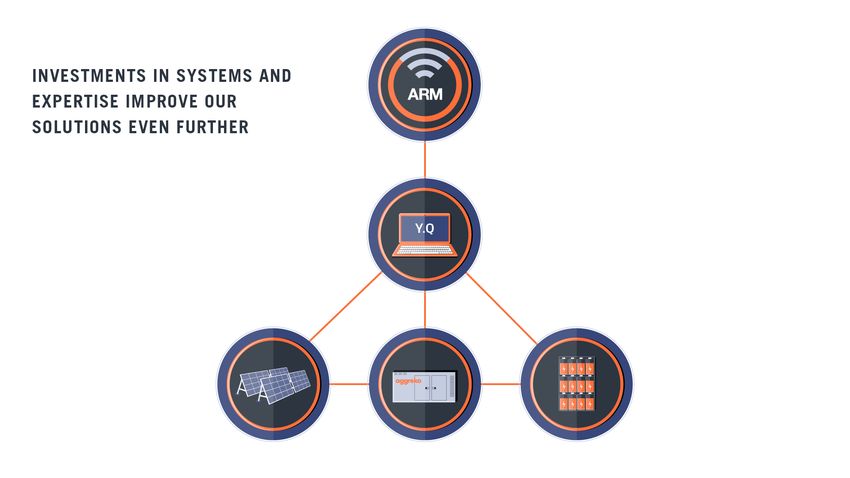
Results Presentation For the year ended 31 December 2017 - 6 MARCH 2018 - Aggreko plc
Reporting changes

 Reflecting the changes in our business
     −   focusing on what matters

 More emphasis on average MW on hire, reduced prominence of order intake
     −   no longer routinely announcing large individual contract wins

 Increased customer sector focus
     −   re-assign non utility work out of Power Solutions Utility into Industrial

 No future Q1 trading updates

                                                                                     Results Presentation March 2018   10
Outlook

 Continued growth expected in Rental Solutions and Power Solutions Industrial
     −   further benefits of the business priorities programme
     −   leveraging operational gearing

 Off-hires in Japan and discounted pricing in Argentina remain headwinds for Power Solutions Utility

 Recent strengthening of Sterling creates adverse translation effects
     −   continuation of current rates would drive a c. 8% adverse profit impact

         Overall, excluding currency effects, 2018 profit before tax expected to be in
                                        line with 2017

                                                                                    Results Presentation March 2018   11
Making a massive difference
for our customers

Chris Weston
CEO

                              Results Presentation March 2018   12
How we see our
business today

Making a massive difference
for our customers and the
communities we serve           Aggreko is a customer focused specialist provider of
                              power, temperature control and energy services on a
                                                  global basis

                               Customer          Technology          Efficiency

                                           People & Always Orange

                                                                      Results Presentation March 2018   13
Rental Solutions

What we’ve done                                            Market drivers                                      Going forward
 Introduced sector focus                                                                                       Continued sector focus and specialisation
                                                                        2.2
     −   387 dedicated sales employees across the                                                               Use new back office systems, remote
         business                                                                                                monitoring and data analytics to drive efficiency
                                                                              2.0
 Reorganised business operations                                                                               Drive to higher value, complex solutions
 £27 million cost removed across Rental                                                                        Increase utilisation to >60% via fleet
 Rebuilt customer journey                                                                                       management systems
                                                                                         1.8
     −   significant investment in new systems                   1.7                             1.7            Introduce e-commerce
 Selective acquisitions                                   GDP growth in developed markets 2017 - 2021

RESULTS TO DATE

    Revenue growing                              ROCE growing                          Utilisation improving
             +9%

                                                                12%                                    56%
                                                    8%

          2016       2017                           2016     2017                                UTILISATION                          Results Presentation March 2018   14
Power Solutions Industrial

What we’ve done                                          Market drivers                                          Going forward
 Sector focus                                                                                                    Continued sector focus and specialisation
     −   Closed 20 depots; remaining around key                                                                   Deploy systems proven in Rental Solutions
         sector locations                                                                     62 7,050
                                                                                                                      −   Use new back office systems and remote
     −   130 sector specialists employed                                                           61                     monitoring to drive efficiency
                                                                             60
 Removed £25m of costs                                                                                           Drive to higher value, complex solutions
 Fleet rationalization and redeployment to                         60
                                                                            6,800                                 Increase utilisation to over 70% via fleet
  improve utilisation                                                                                              management systems
                                                                  6,700              6,719
                                                         Copper price forecast $/mt 2018-2021
                                                         Oil price forecast $/BBL 2018-2021

RESULTS TO DATE

    Revenue growing                           ROCE growing                              Utilisation improving

           +20%
                                                            11%
                                                                                                         68%
                                                  7%

         2016       2017                          2016     2017                                    UTILISATION                          Results Presentation March 2018   15
Power Solutions Utility

What we’ve done                                         Market drivers                                       Going forward
 Market Intelligence Platform improves market           GDP growth & commodities                            Use new back office systems, remote monitoring
  understanding & customer insight                                                                             and data analytics to drive efficiency
                                                         Transmission & distribution
 58 dedicated regional specialists                                                                           Continued drive to reduce receivables and
                                                         Renewables penetration                               inventory
 Removed £44 million of cost
                                                                                                              Continue to develop sales discipline
 New products designed to meet customer needs
                                                                                                              Improve utilisation to above 80%
 Deployed CRM system
                                                                                                                  −   particular focus on HFO & NGG sales
 Enhanced sales discipline and focus

                                                                  Total market conversion 2 – 2.5GW

RESULTS TO DATE IMPACTED BY LEGACY CONTRACTS

    Revenue down                          ROCE decline                               Utilisation down

               (9)%                               8%
                                                           2%                                         74%
                                                 11%
                                                           8%
                                                                      Argentina
        2016          2017                       2016     2017                                 UTILISATION                          Results Presentation March 2018   16
The future: energy markets are
transforming
                                                  Cloud based data analytics
Our digitalisation
Opportunity as we digitalise Aggreko
 Operating data collection via the ROC
                                                  Energy market interface
                                                  (where applicable)
 Data analytics to benefit maintenance costs
  and customer focused product development
 Y.Q system significantly enhances our ability
  to understand customer profiles and tailor
  solutions

                                                                               Results Presentation March 2018   17
 Added capabilities to enhance our skills
The future: energy                     −   Younicos brings software to smoothly manage integration of thermal, renewable and
markets are                                storage

transforming                       Opportunity as renewables grow and need to be integrated
                                       −   Off grid & microgrid
                                       −   Commercial & Industrial behind the meter
Decarbonisation,                       −   Improve efficiency: driving down cost for customers, and through own use
decentralisation and
digitalisation are changing the
ways we generate and consume
energy, globally

                                                                           \\\\\\\\

                                                                                                      Results Presentation March 2018   18
Summary

 The group has been through significant, and
  necessary changes
 Rental Solutions & Power Solutions Industrial
  are performing well
 Utility is not where it needs to be
    −   Legacy issues now clearing
 Team and plan in place to deliver

                                                  Results Presentation March 2018   19
Aggreko is a customer focused specialist provider of power, temperature
control and energy services on a global basis. These services are based on
modular and mobile equipment operated on a digital platform with a
market leading integration capability.

                                                             Results Presentation March 2018   20
Appendix

           Results Presentation March 2018   21
Revenue mix

                                                                   Revenue                   % of Revenue mix (excl. fuel)
                                                                                      1
                                                           FY17    FY16      Underlying   FY17        FY16            Change
                                                            £m      £m          change       %           %                pp
Power                                                      1,010    966            (1)%   64%          66%                   (2)
Temperature control                                         182     161             7%    11%          11%                    -
Oil-free air                                                 31      28             6%     2%           2%                    -
Total rental                                               1,223   1,155            1%    77%          79%                   (2)
Service revenue                                             368     300            16%    23%          21%                   2
Revenue excl. pass-through fuel                            1,591   1,455            4%    100%        100%
Pass-through fuel                                           139      60             n/a
Total revenue                                              1,730   1,515            4%

1 Excluding revenue from pass–through fuel and currency.

                                                                                                                                   Results Presentation March 2018   22
Balance sheet

£m                                 FY17     FY16
Intangible assets / goodwill        215      183
Tangible fixed assets              1,214    1,309
Working capital                     586      603
Retirement benefit obligation       (25)     (30)
Derivative financial instruments      (3)      (6)
Provisions for taxes                (18)     (42)
Net debt                           (652)    (649)
Net assets                         1,317    1,368

                                                     Results Presentation March 2018   23
Foreign exchange impact

                                                                                                       FX RATES                                          REVENUE (£m)
                                                                                                                                                     FY17 Restated
                                                                                                                                                       at February
                                                                                              FY17                 February                  FY17             2018
                                                                                           average              2018 closing                actual    closing rates   Variance    % Variance
                                  US Dollar                                                    1.29                           1.39            834              771        (63)             (8)%
                                  Euro                                                         1.14                           1.13            213              214          1               1%
                                  Australian Dollar                                            1.68                           1.78             78               74         (4)             (5)%
                                  Argentinian Peso                                           21.36                          27.77              64               49         (15)          (23)%
                                  Brazilian Real                                               4.12                           4.54            217              197        (20)             (9)%
                                  Canadian Dollar                                              1.67                           1.77             24               22         (2)             (6)%
                                  Russian Rouble                                             75.19                          78.95              76               73         (3)             (5)%
                                  Other                                                                                                       224              216         (8)             (4)%
                                  Total revenue                                                                                             1,730            1,616       (114)             (7)%
                                  Total operating profit                                                                                      229              211        (18)             (8)%

Note: UAE Dirhams included within US Dollar as it is pegged to the US dollar; Argentinian Peso includes Power Solutions Utility contracts
which are pegged to the US Dollar but paid and reported in Argentinian Pesos.
                                                                                                                                                                                  Results Presentation March 2018   24
IFRS 15 impact

 Effective from 1 January 2018

 Revenue is recognised when we transfer control of goods/services to the customer

 The costs to fulfil the service to the customer (including mob/demob) will be amortised over the period of the initial contract

 In 2017, the effect of this would have been immaterial:
      −   revenue increase of £2m
      −   operating cost increase of £5m
      −   PBT reduction of £3m

 We will restate 2017 numbers as part of our 2018 reporting

 Further detail is included in the notes to the accounts in the Annual Report

                                                                                                          Results Presentation March 2018   25
Impact of US tax reforms

    Aggreko’s US business accounted for 17% of Group PBT and 10% of Group tax charge in 2017 so overall impact is limited

    We benefitted from a one off reduction in tax rate of c.5pp in 2017 due to the revaluation of deferred tax liabilities as a
         result of the permanent reduction in the US statutory corporate income tax rate from 35% to 21% (24.75% including state
         tax)
    Assuming no change to the relative proportion of business from the US, based on 2017 pre-exceptional PBT, the impact for
         Group is:
                   −     Reduction in the Group’s ETR of c.1.5pp
                   −     Assuming no increase in the current level of debt in our US business, we do not anticipate that there will be a material
                         restriction on the level of deductible interest
                   −     We do not anticipate that the Base Erosion & Anti Avoidance Tax (“BEAT”) will impact Aggreko assuming that the
                         current levels of annual gross receipts remain as now

Note: ETR is effective tax rate                                                                                           Results Presentation March 2018   26
Disclaimer

The information contained in this presentation has largely been extracted from the Results Announcement for the year ended 31
December 2017.

This presentation may contain certain “forward-looking” statements. By their nature, forward-looking statements involve risk and
uncertainty because they relate to future events and circumstances. Actual outcomes and results may differ materially from any
outcomes or results expressed or implied by such forward-looking statements. Any forward-looking statements made by or on behalf of
Aggreko speak only as of the date they are made and no representation or warranty is given in relation to them, including as to their
completeness or accuracy or the basis on which they were prepared.

This presentation is published solely for information purposes.

The distribution of this presentation in jurisdictions other than the UK may be restricted by law and therefore any persons who are
subject to the laws of any jurisdiction other than the UK should inform themselves about, and observe, any applicable requirements.

All opinions expressed in this presentation are subject to change without notice and may differ from opinions expressed elsewhere.

                                                                                                               Results Presentation March 2018   27
You can also read