KUKA Aktiengesellschaft - Company Presentation 2019 - KUKA Robotics

Page created by Tiffany Ramirez
 
CONTINUE READING
KUKA Aktiengesellschaft - Company Presentation 2019 - KUKA Robotics
KUKA Aktiengesellschaft

Company Presentation 2019

Company Presentation | www.kuka.com   Page: 1
KUKA Aktiengesellschaft - Company Presentation 2019 - KUKA Robotics
Agenda

 1. KUKA Group at a glance and Guidance 2019

 2. Business Segments and Strategy

 3. Action plan

 4. Shareholder Structure, Financials and Markets

 5. Appendix

Company Presentation | www.kuka.com                 Page: 2
KUKA Aktiengesellschaft - Company Presentation 2019 - KUKA Robotics
1. KUKA Group at a glance and Guidance 2019

Company Presentation | www.kuka.com           Page: 3
KUKA Aktiengesellschaft - Company Presentation 2019 - KUKA Robotics
Milestones in Our History

                                                                                  1973
                                                                                  Famulus, the pioneer                                2010                                          2016
                                                                                  With the world’s first industrial robot             Top-selling robot family                      One KUKA, many
                                                                                  using six electric motor-driven axes,               KR QUANTEC immediately becomes the            solutions
                                                                                  KUKA goes down in history as a                      world’s top-selling series of robots          KUKA is one of the world’s
                                                                                  pioneer in the field of robotics.                   thanks to its unique range capacity.          leading provider of
                                                                                                                                                                                    intelligent robot-based
                                                                                                                                                                                    automation.

   1898                                                                   1964
                                                                          Augsburg’s Princess
                                                                                                                                                          2013
                                                                                                                                                          Hand-in-hand with machines
   KUKA turns on the
                                                                          The “Princess” compact portable                                                 The highly-sensitive LBR iiwa is the first
   lights
                                                                          typewriter was a masterpiece of                                                 industrial, mass-produced series of
   Johann Josef Keller and
                                                                          machine tooling.                                                                lightweight robots capable of safely
   Jakob Knappich open
                                                                                                                                                          collaborating with humans.
   their acetylene gas
   plant, making residential
   and urban lighting                 1920                                                                              1996
   economical.                        Expertise drives growth                                                           Robot control by PC
                                      On the basis of its know-how in                                                   KUKA becomes the first manufacturer
                                      the areas of welding and cutting,                                                 to make the paradigm shift to a PC-
                                      the company begins                                                                based robot controller.
                                      manufacturing large containers.

Company Presentation | www.kuka.com                                                                                                                                                                              Page: 4
KUKA Aktiengesellschaft - Company Presentation 2019 - KUKA Robotics
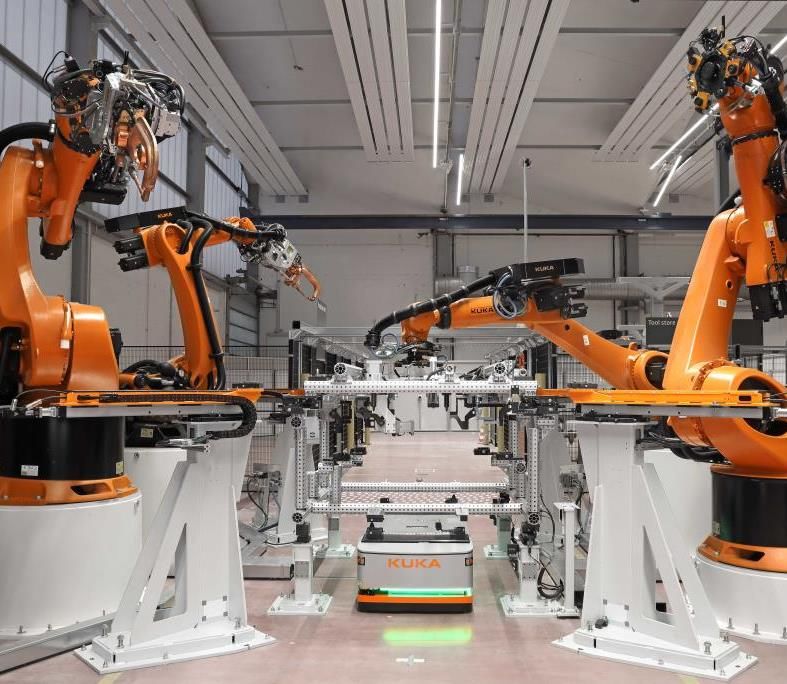
KUKA Group at a glance (FY 2018)

                                                                                                                     Regional mix
            €3.3 billion                                                            €3.2 billion                                    EMEA
            Orders received (-8.5%)                                                 Sales revenues(-6.8%)
                                                                                                                                    Americas
                                                                                                                                    Asia/Australia

             3.0% EBIT margin                                     1                  €16.6 million                   Business mix
             4.3% in 20172                                                           Earnings after taxes (-81.2%)
                                                                                                                                    Automotive
                                                                                                                                    General Industry

1)   Before purchase price allocations, before growth investments and before reorganization expenditure
2)   Before purchase price allocations and before growth investments
      Company Presentation | www.kuka.com                                                                                                   Page: 5
KUKA Aktiengesellschaft - Company Presentation 2019 - KUKA Robotics
Outlook 2019: KUKA Group

                                                                                 Sales revenues                                                                  EBIT margin
                                                         ~ €3.2 billion                                                                 > previous year´s level*
*) 2019: incl. all reorganization expenditures ; 2018: EBIT margin 1.1% ( incl.purchase price allocations, growth investments and reorganization expenditure))

     Company Presentation | www.kuka.com                                                                                                                                   Page: 6
KUKA Aktiengesellschaft - Company Presentation 2019 - KUKA Robotics
2. Business Segments and Strategy

Company Presentation | www.kuka.com   Page: 7
KUKA Aktiengesellschaft - Company Presentation 2019 - KUKA Robotics
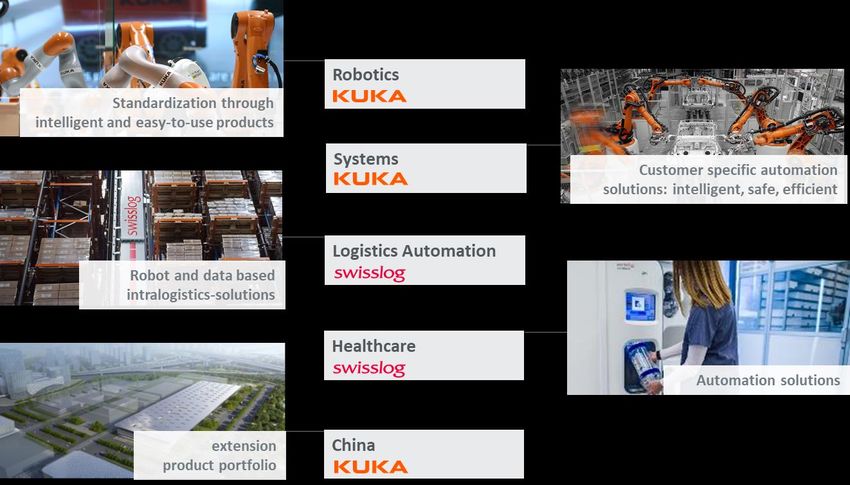
Customers Benefit from KUKA’s Unique Smart Automation Expertise

KUKA Group
                                                                                  Swisslog Logistics                 Swisslog
Systems                                      Robotics                                                                                               China
                                                                                  Automation                         Healthcare

Smart, safe & efficient                      Robots, cells & service for         Data & robotics-driven              Medication                     Automation for China –
production solutions                         intelligent automation              logistics automation                management solutions           from China

Global presence                                                     Focus industries

                                      KUKA HQ
                                      Augsburg, Germany

     >40               € 3.3bn.               14,200                Automotive/Tier1     Electronics      General Industry   E-Commerce/    Consumer Goods       Healthcare
     Countries         Order Intake (2018)    Employees                                                                          Retail

                                                                                                                    » The clear choice for smart automation.«
Company Presentation | www.kuka.com                                                                                                                                           Page: 8
KUKA Aktiengesellschaft - Company Presentation 2019 - KUKA Robotics
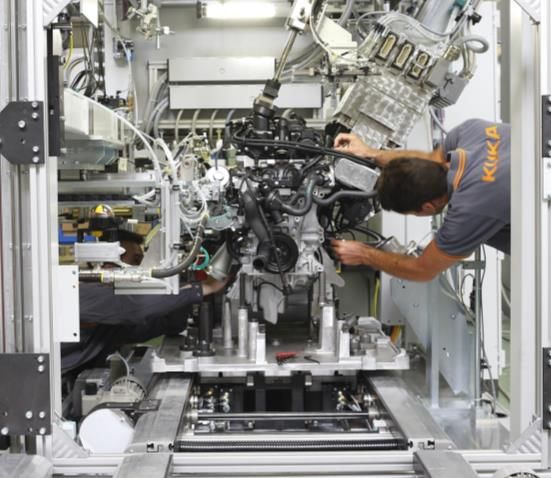
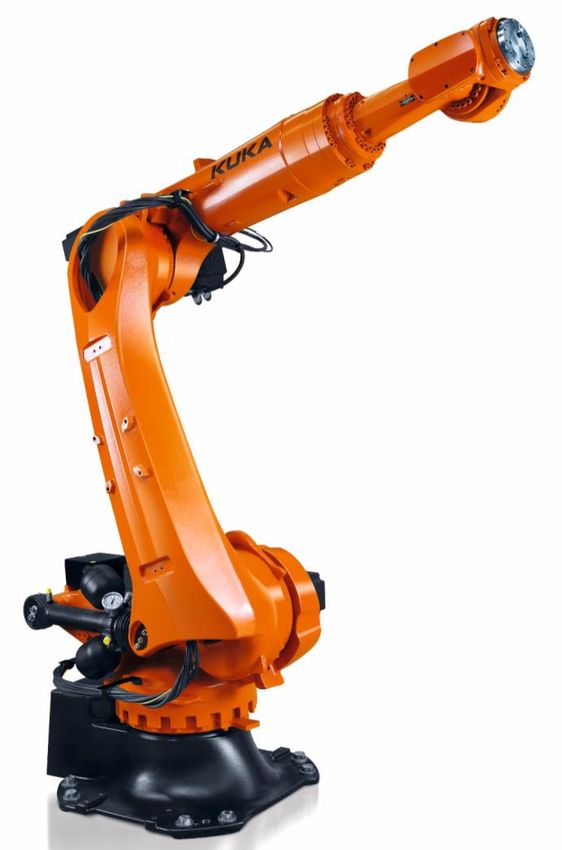
Business Segments – KUKA Robotics

The core components for the automation of manufacturing processes is supplied by our business
segment Robotics:
From industrial robots with software and control to manufacturing cells – KUKA Robotics offers
customer-specific solutions to respond optimally to the different requirements of its customers.

Industrial Robots                     Customized            Standardized Cells   Smart Software    Customer Service
                                      Manufacturing Cells

Company Presentation | www.kuka.com                                                                                   Page: 9
KUKA Aktiengesellschaft - Company Presentation 2019 - KUKA Robotics
Business Segments – KUKA Systems

  Body Structure                      Assembly & Test                          Batteries                        AGV – HRC – Industrial IoT

    Flexible and efficient            Automation and test                       Production processes for        AGV: Flexible
    production processes              solutions for all drive train             E-mobility and energy storage   mobility for smart
                                      modules, cars and trucks                                                  automotive
                                                                                                                production

                                                                                                                HRC: Shared work,
                                                                                                                space, tasks and
                                                                                                                capabilities

                                                                                                                Industrial IoT:
                                                                                                                Profitable digital
                                                                                                                change for industrial
                                                                                                                business

                                                                  Solution Execution

                                                                      Tech-Center

Company Presentation | www.kuka.com                                                                                                     Page: 10
Business Segments – Swisslog Logistics Automation

                                                              Automated storage &
                                                              retrieval systems

                                                               Future-ready warehouse
                                                               management systems

Picking & palletizing solutions

                                      Automated transport &
                                      conveyor systems
Company Presentation | www.kuka.com                                                     Page: 11
Business Segments – Swisslog Healthcare

                                                                                Our solutions create space for the
                                                                                limited time resources of care
                                                                                professionals and enable them to
                                                                                be where they are needed most:
                                                                                With the patients.

                                      Our product portfolio covers all steps of inpatient and
                                      outpatient medication management in hospitals.

                                      We are one of the leading global providers for both
                                      automation solutions for pharmacies and hospital
                                      logistics. These core technologies are networked through
                                      comprehensive software and analytics solutions.

Company Presentation | www.kuka.com                                                                             Page: 12
Business Segments – China

    With all four business                                    New Production Site
    segments in China, KUKA                                   in Shunde – potential
    China is speeding up                                      for global growth
    business in this dynamic
    market

                                      Market-tailored
                                      product portfolio for
                                      Asia

Company Presentation | www.kuka.com                                                   Page: 13
Focus Markets We Address

Company Presentation | www.kuka.com   Page: 14
Insight: Innovative Solutions - KUKA Smart Production

   Challenges:                                          Construction:
   •      increasing variety of types
   •      more frequent model changes                   Quickly-adaptable production cells instead
   •      quantity fluctuations                         of a rigid system: Different areas are
                                                        connected by autonomous transport
                                                        vehicles and intelligent software. The cells
                                                        are equipped with neutral equipment.
   Target:
   Manufacturing a wide variety of                      AGVs retrieve tools, equip robots and
   products in the same plant with a                    deliver components from the warehouse to
   short conversion time                                the production cells. Robots use them to
                                                        process a wide variety of components.

                                                        Intelligent software keeps the overview,
   Concept:                                             knows where the AGVs are, which
   A neutral, intelligent system that                   components they have to deliver to the
   can produce a wide variety of                        robots and prepares a changeover in a
   items with different tools.                          short time.

Company Presentation | www.kuka.com                                                             Page: 15
The industrial revolution has always shaped us –
and we are influencing it.

   KUKA the robot & process company                                           KUKA the robot, logistic, process and
                                                                              software company

                                                                                                        •   System of systems
                                                                              •   Systems
                                                          • Robot & Process                             •   Connected
                                                                              •   Connected
                                                          • Connected                                   •   Data Analysis
                                      • Robot & Process                       •   Data Analysis
     • Robot                                              • Data Analysis                               •   Optimized
                                      • Connected                             •   Optimized
                                                                                                        •   Digital Domain
                                                                              •   Digital Domain

Company Presentation | www.kuka.com                                                                                             Page: 16
Customers Benefit from Bringing Together KUKA´s Domain Know-How and
Innovative Strength
                                               Increasing Production Requirements

     Intelligent Robots               Process Expertise          Digital Services   Smart Solutions

                                                      Factory of the Future

Company Presentation | www.kuka.com                                                                   Page: 17
3. Action Plan

Company Presentation | www.kuka.com   Page: 18
Slower growth in
Target: Return to global profitable growth        China

              Challenges              Action plan               Target

             Slower growth in
                  China

                Trade dispute

          Negative influences
         from project business

                    Economic
                     cooling

Company Presentation | www.kuka.com                                      Page: 19
Action plan for four key areas

                                                       Four key areas

  Concentration on China –              Improvement of the        R&D investments     Increase efficiency
      China task force                organizational structure                       Goal: to save a total of
    The largest robotics              Customer-focused and         Steer and focus   more than 300 million
  market remains our focus                decentralized                                  euro by 2021
          market.                         departments

Company Presentation | www.kuka.com                                                                        Page: 20
We are reacting to market trends in China

                                      Robotics sales figures for China                   Push to expand the portfolio:
                                                                                           SCARA and delta robots
                                           2018                      2019 (first half)

                                                                                                  Delta

                                                                                                                 Cartesian
                                                                                         Scara
                All types of                        Delta, Scara,     All Types of
                  Robots                          Cartesian Robots      Robots
                                                                                           AGV

                                                                                                                Articulated

Company Presentation | www.kuka.com                                                                                      Page: 21
Strong customer-focused organizational structure

Company Presentation | www.kuka.com                Page: 22
Focus: Global R&D

     Global investments and
      central management
      of the R&D activities
    but also

     Localization of R&D for
      the respective markets

     Technology competencies
                                      North America   Cloud and IT software
      specialized worldwide           Germany         Robotics core, connectivity, software, sensitive
                                                      systems, mobility robotics
     Products that are specially
      tailored to the regional        Hungary         Mobility, tools, OS, system testing
      markets                         China           AGVs, SCARA, Delta
                                      Finland         Visual Components simulation
Company Presentation | www.kuka.com                                                                      Page: 23
Innovation: KR QUANTEC-2

                                      More than 100,000
                                      robots of the previous
                                      KR QUANTEC-1
                                      generation have been
                                      sold since 2010.

Company Presentation | www.kuka.com                            Page: 24
Increase efficiency Goal                                                Process
                                                                   optimization
                                                         Project                  € 300 million
                                                          focus

                                             Personnel
                                             measures

                                      Cost
                                savings

Company Presentation | www.kuka.com                                                         Page: 25
4. Shareholder Structure, Financials and Markets

Company Presentation | www.kuka.com                Page: 26
KUKA Group – Shareholder structure

    Other institutional and private investors 5.4%

                                                     Midea Group 94.6%

Company Presentation | www.kuka.com                                      Page: 27
2018 – KUKA AG key figures
   Orders received                        3,422.3 3,614.33,305.3                                                                EBIT                                          155.21
   (€ million)                      2,838.9                                                                                     (€ million)                   141.8 135.6              134.61
                                                                                                                                                   120.4
                              2,229.0
                 1,881.9                                                                                                                                                                        96.41

                                                                                          CAGR +12%
                  2013 2014 2015 2016 2017 2018                                                                                                     2013 2014 2015 2016 2017 2018

   Sales revenues                                      3,479.1                                                                  Earnings after taxes
                                                               3,242.1
   (€ million)                           2,965.9 2,948.9                                                                        (€ million)                               86.3 86.2    88.2
                                                                                                                                                               68.1
                       2,095.7                                                                                                                       58.3
                1,774.5

                                                                                                                                                                                                16.6
                                                                                          CAGR +13%
                  2013 2014 2015 2016 2017 2018                                                                                                     2013 2014 2015 2016 2017 2018
1) 2018: Before purchase price allocations, growth investments and reorganization expenditure; 2017: Before growth investments; 2016: Before purchase price allocations
   Company Presentation | www.kuka.com                                                                                                                                                                  Page: 28
KUKA Group: Q3 2019

  Orders received                                                                                 Revenues                             EBIT/EBIT-Margin
  (€ mn.)                                                                                         (€ mn.)                              (€ mn.)
           750.1                 624.8                                                                      851.0      832.9                          4.3%
                                                                                                                                        3.1%       35.6
                                                                                                                                            26.4

                                                        -16.7%                                                                 -2.1%                         +34.8%
         Q3/18                 Q3/19                                                                       Q3/18       Q3/19               Q3/181 Q3/192

 1)   Without one-off effects related to growth investments and reorganzations expenditure   2) none one-off effects
Company Presentation | www.kuka.com                                                                                                                                   Page: 29
Segment-Split: Key figures Q3 2019

            in Mio. €                 Orders Received          Sales Revenues                EBIT                     EBIT-Margin
                              Q3/18        Q3/19   Delta    Q3/18   Q3/19   Delta    Q3/18   Q3/19    Delta   Q3/18      Q3/19      Delta

   KUKA Group                 750.1        624.8   -16.7%   851.0   832.9   -2.1%    26.4    35.6    34.8%    3.1%       4.3%       12 Bp

   Systems                    310.9        186.9   -39.9%   273.5   217.3   -20.5%    3.8     9.9    >100%    1.4%       4.6%       32 Bp

   Robotics                   297.0        215.4   -27.5%   379.7   307.7   -19.0%   37.1    25.5    -31.3%   9.8%       8.3%       -15 Bp

   Logistic
   Automation                  92.0        128.6   39.8%    145.5   140.9   -3.2%     4.1     2.5    -39.0%   2.8%       1.8%       -10 Bp

   Healthcare                  50.6        58.4    15.4%    51.9    54.3    4.6%      0.3    -2.2    >-100%   0.6%       -4.1%      -47 Bp

   China                       85.5        55.9    -34.6%   159.2   154.1   -3.2%    -4.5     1.8    >100%    -2.8%      1.2%    +40 Bp

Company Presentation | www.kuka.com                                                                                                          Page: 30
KUKA Group  Key financial indicators for FY 2018 and 9M 2019
                                                                                                 (€ million)                     FY17                        FY18                       Delta        9M 2018    9M 2019     Delta
   Sales revenues                                                                                                            3,479.1                     3,242.1                       -6.8%          2,448.3    2,372.5     -3.1%
   Gross operating result                                                                                                      754.3                       725.9                       -3.8%            579.2      539.2     -6.9%
      in % of sales revenues                                                                                                    21.7                        22.4                      +70bp              23.7       22.7   -100bp
   EBITDA                                                                                                                      180.2                       121.2                     -32.7%             157.8      173.4      9.9%
      in % of sales revenues                                                                                                     5.2                         3.7                    -150bp                6.4        7.3     -90bp
   Earnings before interest and taxes (EBIT)                                                                                   102.7                        34.3                     -66.6%              93.9       81.4   -13.3%
      in % of sales revenues                                                                                                     3.0                         1.1                    -190bp                3.8        3.4     -40bp
   Earnings before interest and tax (EBIT)1                                                                                    148.3                        96.4                     -35.0%             111.9       81.4   -27.3%
      in % of sales revenues                                                                                                     4.3                         3.0                    -130bp                4.6        3.4   -120bp
   Earnings after taxes                                                                                                         88.2                        16.6                     -81.2%              73.4       62.4   -15.0%
   Capital expenditure                                                                                                         138.8                       295.4                     >100%              195.2      107.6   -44.9%
   Equity ratio (in %)                                                                                                          32.8                        41.6                      +88bp              42.3       40.4   -190bp
   Net liquidity                                                                                                               -45.2                        92.9                     >100%               93.7        8.7   -90.7%
   Employees (FTE)                                                                                                           14,256                      14,235                        -0.1%          14,076     14,075       0.0%
   Cash earnings                                                                                                               184.6                       129.0                     -30.1%             161.5      163.0      0.9%
   Cash flow from current business operations                                                                                   92.0                       -48.2                    >-100%             -117.7       60.6    >100%
   Cash flow from investment activities                                                                                       -227.7                      -165.5                    +27.3%              -92.5      -96.9     -4.8%
   Free cash flow                                                                                                             -135.7                      -213.7                     -57.5%            -210.2      -36.3     82.7%
 1 2017:   before purchase price allocations and before growth investments; 2018: before purchase price allocations, growth investments and reorganization expenditure; 2019: none one-off effects
Company Presentation | www.kuka.com                                                                                                                                                                                                  Page: 31
Automation and Digitization are global trends

                                                                                                     Europe

                                                                                                            GER
                                                                                                       Average robot
                                                                                                     density per 10,000
                                                                                                      employees: 338

                  Globalization                                                 • Industrie 4.0 and digitalization open up
                                                        Americas                  huge potential in manufacturing industry
                                                                                • High automation degree in production industry;                      APAC
                                                                USA               investments in manufacturing and resource efficiency
                                                           Average robot
                                                                                                                                                         CHN
                                                         density per 10,000
                                                                                                                                                    Average robot
                                                          employees: 217
                                                                                                                                                  density per 10,000
                                                                                                                                                   employees: 140

                                      • Modernization, expanding capacities, investment in
                                        advanced electronics and new technologies                                         • Rising labor costs and quality standards as well as higher
                    Digitization                                                                                            education levels through growing middle class China
                                      • Reshoring of capacities from abroad incentivized
                                                                                                                          • Transformation of the economy towards sustainable
                                                                                                                            growth models to strengthen competitiveness and
                                                                                                                            establishment as so-called "Smart Manufacturing Super
                                                                                                                            Power"

                   Automation
Company Presentation | www.kuka.com                                                                                                                                          Page: 32
Robotics – Low robot penetration in General Industry and emerging markets
  Robot density in 2018
  Robots per 10,000 employees
         1268                           1237
                                                            1165

                                                                         732        687

                                                                   245
                         195                                                                            193
                                                      130                                                                      99
                                                                               70              46                  6                      2

           Germany                            USA             Japan       China           UK              Brazil                  India
                                                                                           Automotive                  General Industry
Source: IFR World Robotics 2018 (published October 2019)

Company Presentation | www.kuka.com                                                                                                           Page: 33
5. Appendix

Company Presentation | www.kuka.com   Page: 34
Financial Calendar

March 26, 2020                        Annual press conference for fiscal year 2019

April 27,2020                         Interim update for the first quarter

June 19, 2020                         Annual General Meeting

August 5, 2020                        Interim update for the first half-year

October 29, 2020 Interim update for the third quarter

Company Presentation | www.kuka.com                                                  Page: 35
Investor Relations Contact
  The KUKA share                      Kerstin Heinrich, Head of Investor Relations
  • ISIN DE0006204407                 • Phone +49 (821) 797- 5481
  • Reuters KU2G.DE                   • Fax +49 (821) 797- 5213
  • Bloomberg KU2 GY (Xetra)          • Email: IR@kuka.com

Company Presentation | www.kuka.com                                                  Page: 36
Disclaimer
The presentation contains forecasts based on assumptions and estimates by the management of KUKA
Aktiengesellschaft. Even if the company management is of the opinion that these assumptions and estimates
are valid, the actual future developments and the actual future results may vary considerably from these
assumptions and estimates due to numerous factors.
These factors may include, for example, changes in the overall economic situation, exchange rates and
interest rates, and changes affecting individual markets. KUKA Aktiengesellschaft provides no guarantee that
the future development and the future results actually achieved will correspond to the assumptions and
estimates stated here and accepts no liability if they should fail to do so.
© Copyright 2019 – KUKA Aktiengesellschaft – All rights reserved.

Company Presentation | www.kuka.com                                                                            Page: 37
You can also read