Herbalife Nutrition Investor Presentation - September 2018 - Investor Relations
←
→
Page content transcription
If your browser does not render page correctly, please read the page content below
Herbalife Nutrition
Investor Presentation
September 2018
Forward-Looking Statements
This presentation contains, and our officers and representatives during this presentation may from time to
time make, forward-looking statements, such as statements relating to projections of results of operations
and financial condition, plans, strategies and objectives of management for future operations and proposed
new developments. Forward-looking statements may include the words “may,” “will,” “estimate,” “intend,”
“continue,” “believe,” “expect,” “anticipate” and any other similar words. Such forward-looking statements
are subject to change and to inherent risks and uncertainties that could cause Herbalife Nutrition’s actual
results, performance and achievements, or industry results, to differ materially from estimates or projections
in forward-looking statements made by or on behalf of Herbalife Nutrition. For more information regarding
these risks and uncertainties, please review Herbalife Nutrition's filings with the Securities and Exchange
Commission, or the “SEC,” including the risks disclosed under the headings “Risk Factors” and
“Management’s Discussion and Analysis of Financial Condition and Results of Operations” in Herbalife
Nutrition’s annual, quarterly and other reports. Herbalife Nutrition does not undertake to update or release
any revisions to any forward-looking statement or to report any events or circumstances after the date of
this presentation to reflect any changes in any forward-looking statement or the occurrence of unanticipated
events, except as required by law. In addition, this presentation may contain certain financial performance
measures that differ from comparable measures contained in our financial statements prepared in accordance
with US generally accepted accounting principles, referred to by the SEC as non-GAAP financial measures.
Herbalife Nutrition believes that these non-GAAP financial measures assist management and investors in
evaluating our performance and preparing period to period results of operations in a more meaningful and
consistent manner, as discussed in greater detail in the schedules to our earnings releases, which can be
found in the investor relations section of our website, ir.herbalife.com. In addition, a reconciliation of non-
GAAP financial measures to the most directly comparable GAAP measures is also contained in the Appendix
to this presentation. Additionally, when management makes reference to volumes in this presentation, it is
referring to volume points.

                                                                                                              [1]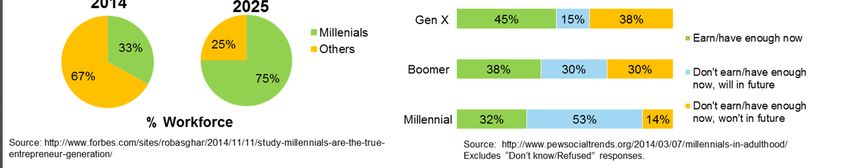
Herbalife Nutrition Today
Global Nutrition Company
Founded in 1980
2017 Net Sales of $4.4 billion
2017 EBITDA of $717 million
Strong Balance Sheet
Returned approximately $5.1 billion of capital to shareholders since 2007
Independent MLM Distributor network with operations in more than 90 countries
Approximately 8,300 employees worldwide
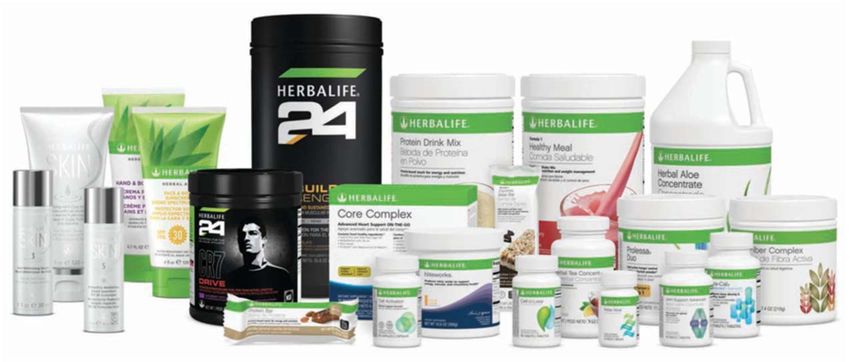
High quality products to pursue an active, healthy lifestyle
Approximately 120 products encompassing over 4,700 SKUs worldwide
Weight management, including the #1 meal replacement product¹
Vitamins & nutritional supplements
Sports & fitness nutrition
Skin and haircare products
Source: Herbalife Nutrition Filings
Note 1: Euromonitor International [2]
Why Herbalife Nutrition (NYSE: HLF)?
Herbalife Nutrition provides a long-term growth opportunity
Ideally positioned to take advantage of global trends in health and wellness and
rising entrepreneurship
Unique, effective and personalized distribution channel supported by education,
training and social support communities to help drive customer results
Great-tasting, quality products and industry-leading infrastructure
Core Strategies:
Leveraging Technology
Creating a culture of innovation
Accelerating the launch of new products
Strengthening our distributor difference through education and training
[3]
Financial performance and cash flow

Geographically Diversified – Net Sales by Region
(in millions)

                                                       China                    North America
                                                        20%                          19%

                                                               $927      $886

                               EMEA                                              $454   Mexico
                                20%                                                      10%
                                                      $942

                                                                          $959
                                                                  $473

                                                                                 APAC
                                                                                  21%
                                       South and Central
                                           America
                                              10%

  Source: Herbalife Nutrition Filings
  Note:   Net sales is for TTM 2018, ending June 30, 2018
                                                                                                 [5]
Global Volume Points / Net Sales
                                                         Volume Points                                                                                Net Sales

                               Q1 2018                YOY %                 Q2 2018               YOY %                 Q1 2018               YOY %                  Q2 2018                YOY %

  NORTH
                                  303.2                 0.2%                  336.4               18.4%                 $231.2                  0.6%                 $262.5                 20.2%
 AMERICA

  MEXICO                          221.8              (1.6%)                   237.1                 3.6%                $114.0                  8.8%                 $118.2                  2.2%

ASIA PACIFIC                      286.6                 9.9%                  302.8                 9.7%                $245.6                11.8%                  $253.0                  7.4%

SOUTH AND
 CENTRAL                          148.5              (3.1%)                   136.3               (0.9%)                $125.7                  2.7%                 $105.0                 (4.5%)
 AMERICA

   EMEA                           294.7                 7.5%                  319.5               12.7%                 $248.2                18.3%                  $260.0                 15.7%

  CHINA                           141.1             (22.5%)                   196.1               27.4%                 $212.2                (1.6%)                 $286.8                 18.2%

  TOTAL                      1,395.9*               (0.2%)*               1,528.2*               12.0%*              $1,176.9                   6.8%              $1,285.5                  12.1%

  Source: Herbalife Nutrition Filings
  * During 2018, the Company adjusted volume point values for certain products in Mexico and South & Central America. Excluding these adjustments, the volume point decrease for Q1 would     [6]
           have been (0.5%) and for Q2 the increase would have been 11.6%.
Strong Balance Sheet
(in millions)
                                                               2016                                   2017     Q2 2018

             CASH                                           $844.0                                 $1,278.8    $839.4

              DEBT                                       $1,447.9                                  $2,268.1   $2,200.7

         NET DEBT                                           $603.9                                  $989.3    $1,361.3

       LTM EBITDA
                                                            $556.4                                  $717.3     $689.3
       (REPORTED)

       LTM EBITDA
                                                            $738.2                                  $702.3     $710.1
      (ADJUSTED ¹)

        NET DEBT /
         EBITDA                                                1.1x                                    1.4x       2.0x
       (REPORTED)

      GROSS DEBT /
         EBITDA                                                2.6x                                    3.2x       3.2x
       (REPORTED)

  Source: Herbalife Nutrition Filings
  Note:   Some data is non-GAAP; See Appendix: “Reconciliation for GAAP and Adjusted Financials”
                                                                                                                         [7]
Cumulative Use of Cash
(in millions)

                                        2007 – Q2 2018

                                                                90%
                NET INCOME
                (REPORTED)                 $3,612.2

                                                         TOTAL CASH RETURNED TO
                 CHANGE IN
                                           $2,015.3         SHAREHOLDERS AS A
                 TOTAL DEBT
                                                            PERCENTAGE OF NET
                                                          INCOME + INCREMENTAL
                 TOTAL                                            DEBT
                                          $5,627.5
            AVAILABLE CASH

                  BUYBACKS                 $4,503.9

                                                              Q2 2018
                  DIVIDENDS                 $568.7       • $600 MILLION TENDER
                                                           OFFER EXPIRED MAY 24,
                 BUYBACKS /                                2018
                 DIVIDENDS                $5,072.6       • EXECUTED $1.4BN OF
                 COMBINED                                  $1.5BN SHARE BUYBACK
                                                           AUTHORIZATION

  Source: Herbalife Nutrition Filings
                                                                               [8]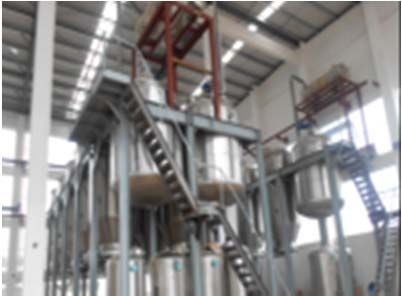
Appendix
Key Megatrends Affecting Consumers

                     Addressable and Diverse
                        Consumer Base

                OBESITY                PUBLIC HEALTH

                  RISING
                                      HEALTHY AGING
             ENTREPRENEURSHIP

                                                       [ 10 ]
Families Living in Lower Income Neighborhoods Are More
Likely to be Obese
HEALTH STATUS
2X
LESS LIKELY TO EAT FIVE OR MORE SERVINGS OF FRUITS
SOUTH L.A. ADULTS ARE AND VEGETABLES A DAY THAN ADULTS IN WEST L.A.
SOUTH L.A. CHILDREN ARE 2X & ADULTS ARE 3X AS LIKELY TO BE OBESE
SOUTH L.A.’S
DIABETES DEATH RATE IS 3.5X HIGHER THAN WEST L.A.’S
Example
WEST L.A. SOUTH L.A.
3,763 5,957
PEOPLE PER GROCERY STORE
PEOPLE PER GROCERY STORE
WEST L.A. SOUTH L.A.
16 population population 6
FARMERS MARKETS
637,129 1,009,550 FARMERS MARKETS
41% 72%
OF RESTAURANTS ARE FAST FOOD
OF RESTAURANTS ARE FAST FOOD
(or limited service)
(or limited service)
Source: American Nutrition Association; Community Coalition Feast or Famine Infographic
[ 11 ]The Opportunity to Divert Spending from Medical Services to
Nutrition and Wellness
2013 US health-related spend ¹:
What we on What us
being healthy healthy
Access to Care 6%
Genetics
20%
Medical Services
Socio-economical
& Physical Global Consumer
Health Spend was
90% Environment
22%
$217 Billion in 2016 ²
Healthy
Behaviors
37%
Other 15%
Healthy Behaviors 9%
Other 1%
Note:
1. Better Policies for a Healthier America 2014
2. Euromonitor International
[ 12 ]Healthy aging appeals to all generations
Percentage of each generation seeking healthy aging products:
74%
71% 70%
66%
Millennials Gen X Boomers WWII
Source: Health, Anti-Aging, Sustainability Top Consumer Concerns
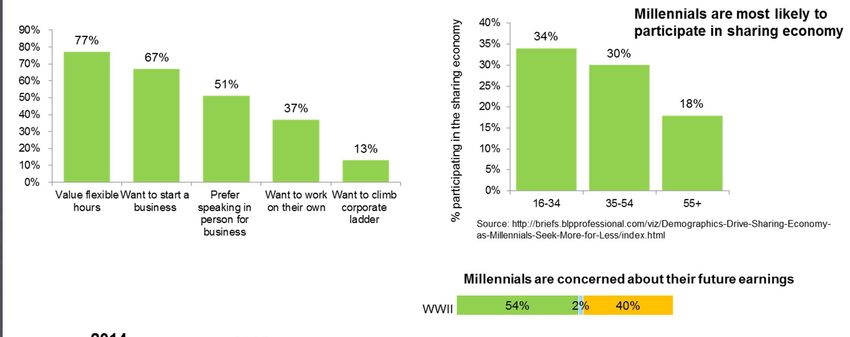
[ 13 ]Rising Entrepreneurship: Millennials Lead
[ 14 ]Herbalife Nutrition – The Last Mile:
Traditional Consumer The Competitive
Packaged Goods (CPG) Alternative
Distribution Model
VS. Broad Range of Products
+ +
Limited Customer The Last Mile
Engagement (Direct Sales Channel)
= =
[ 15 ]Our Last Mile Value Add:
People lose weight and achieve nutritional goals
much better as part of a social group
Herbalife Nutrition Meal Plans
products & Recipes
Healthy
Personal
Active
Lifestyle Customer Coach
Results
Education Supportive
& Training Community
[ 16 ]Research: Social Support Can Help You Lose Weight People lose weight and achieve nutritional goals much better as part of a social group Researchers at the University of Pennsylvania recruited 166 people to participate in a weight-loss program either alone or with three friends or family members. Among those who embarked on the program with friends, 95 percent completed the program compared to only 76 percent of those who dieted solo. After 10 months, 66 percent of the group dieters had maintained their weight loss compared to only 24 percent of those who were on their own ¹ “It’s easier to stick with a weight loss plan when you have support” ² “The studies are unequivocal - people who attend support groups as part of a comprehensive weight-loss program lose more weight than those who go it alone. Some things are hard to do alone” ³ Source: CBS News; Science Daily Note: 1. University of Pennsylvania 2. American Psychology Association 3. Reader’s Digest [ 17 ]
Leader in Providing High Quality Products
Top Suppliers
Ingredient traceability
Leverage strength of large global companies
Division of
Top Selling
Sales by Category Product
Outer Other
Nutrition 3.2% Archer Daniels
2.1% Midland
Energy,
Sports and
Fitness Weight
6.0% Management
64.2%
Targeted
Nutrition
24.5%
Division of
Source: Herbalife Nutrition 2017 Form 10-K
[ 18 ]Industry-Leading Manufacturing
H.I.M. H.I.M.
H.I.M. H.I.M. H.I.M.
Winston-Salem, U.S. Nanjing, China
Suzhou, China Lake Forest, U.S. Changsha, China
building #1
2000 2009 2012 2013 2014 2015 2016 2020
H.I.M. H.I.M. H.I.M. H.I.M. Potential H.I.M.
Suzhou Lake Forest Suzhou building Suzhou additional
building #2 2rd liquid line #2 equipment locations
expansion upgrade
% of product self- ≈ 0% ≈ 30% ≈ 40% ≈ 65%+
manufactured:
≈ 0% [ 19 ]Reconciliation for GAAP and Adjusted Financials
TTM 2018 Im pact of Carve-outs ($m m )
Net Sales COGS Royalties SG&A Other OI Interest/Other Tax Net Income EPS
Non-cash interest expense related to convertible notes $0.0 $0.0 $0.0 $0.0 $0.0 $52.3 ($0.7) $51.6 $0.34
Contingent value rights revaluation $0.0 $0.0 $0.0 $0.0 $0.0 $15.6 ($2.8) $12.8 $0.08
Loss on extinguishment of convertible debt $0.0 $0.0 $0.0 $0.0 $0.0 $13.1 ($2.1) $11.0 $0.07
Venezuela devaluation $0.0 $0.0 $0.0 $4.7 $0.0 $0.0 ($1.4) $3.3 $0.02
Expenses related to regulatory implementation $3.0 $0.0 $0.0 $0.9 $0.0 $0.0 ($1.5) $2.5 $0.02
Expenses related to regulatory inquires $0.0 $0.0 $0.0 $11.3 $0.0 $0.0 ($2.1) $9.2 $0.06
Expenses related to short-seller activities $0.0 $0.0 $0.0 $1.9 $0.0 $0.0 ($0.4) $1.5 $0.01
Sharecount adjustment $0.0 $0.0 $0.0 $0.0 $0.0 $0.0 $0.0 $0.0 $0.00
China Grant Income $0.0 $0.0 $0.0 $0.0 ($29.8) $0.0 $9.6 ($20.2) ($0.13)
US Tax Reform $0.0 $0.0 $0.0 $0.0 $0.0 $0.0 $153.3 $153.3 $1.01
YTD Dec'17 Im pact of Carve-outs ($m m )
Net Sales COGS Royalties SG&A Other OI Interest Tax Net Income EPS
Non-cash interest expense related to convertible notes $0.0 $0.0 $0.0 $0.0 $0.0 $47.7 $0.0 $47.7 $0.58
Expenses related to regulatory implementation $3.0 $0.0 $0.0 $14.7 $0.0 $0.0 ($6.1) $11.6 $0.14
Expenses related to regulatory inquires $0.0 $0.0 $0.0 $13.7 $0.0 $0.0 ($4.7) $9.0 $0.11
Expenses related to short-seller activities $0.0 $0.0 $0.0 $5.0 $0.0 $0.0 ($1.2) $3.8 $0.05
China Grant Income $0.0 $0.0 $0.0 $0.0 ($50.8) $0.0 $14.6 ($36.2) ($0.44)
US Tax Reform $0.0 $0.0 $0.0 $0.0 $0.0 $0.0 $153.3 $153.3 $1.85
YTD Dec'16 Im pact of Carve-outs ($m m )
Net Sales COGS Royalties SG&A Other OI Interest Tax Net Income EPS
Regulatory Settlements $0.0 $0.0 $0.0 $203.0 $0.0 $0.0 ($70.0) $133.0 $1.54
Non-cash interest expense related to convertible notes $0.0 $0.0 $0.0 $0.0 $0.0 $45.1 $0.0 $45.1 $0.52
Expenses related to regulatory inquires $0.0 $0.0 $0.0 $16.3 $0.0 $0.0 ($5.5) $10.8 $0.13
Expenses related to short-seller activities $0.0 $0.0 $0.0 $12.1 $0.0 $0.0 ($3.0) $9.0 $0.11
Expenses related to regulatory implementation $1.7 $0.0 $0.0 $9.0 $0.0 $0.0 ($3.6) $7.1 $0.08
KPMG Recovery $0.0 $0.0 $0.0 $3.6 $0.0 $0.0 ($1.0) $2.6 $0.03
China Grant Income $0.0 $0.0 $0.0 $0.0 ($34.2) $0.0 $9.8 ($24.3) ($0.28)
KPMG Aw ard $0.0 $0.0 $0.0 $0.0 ($29.7) $0.0 $3.9 ($25.8) ($0.30)
[ 20 ]
Source: Herbalife Nutrition Press ReleasesYou can also read