Southwest IDEAS Investor Conference - Dallas, TX November 20, 2019 - cloudfront.net
←
→
Page content transcription
If your browser does not render page correctly, please read the page content below
Southwest IDEAS Investor
Conference
Dallas, TX
November 20, 2019

                           NASDAQ-CM: CRWS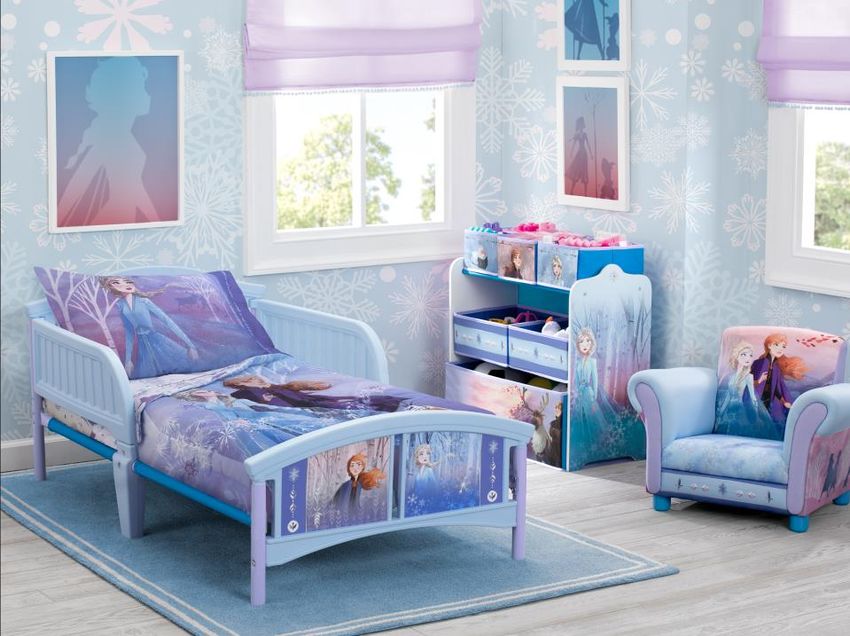
Cautionary Notice Regarding
Forward-Looking Statements

This presentation contains forward-looking statements by Crown Crafts, Inc. (the “Company”) within the meaning of the Securities
Act of 1933, the Securities Exchange Act of 1934, the Private Securities Litigation Reform Act of 1995, and all Rules and Regulations
issued thereto. Such statements are based upon management's current expectations, projections, estimates and assumptions.
Words such as "expects," "believes," "anticipates" and variations of such words and similar expressions identify such forward-
looking statements. Forward-looking statements involve known and unknown risks and uncertainties that may cause future results
to differ materially from those suggested by the forward-looking statements. These risks include, but are not limited to, general
economic conditions, including changes in interest rates, the overall level of consumer spending and the price of oil, cotton and
other raw materials used in the Company’s products, changing competition, changes in federal and state governmental regulations
with respect to the consumer products industry, changes in the retail environment, the level and pricing of future orders from the
Company's customers, the Company's dependence upon third-party suppliers, including some located in foreign countries with
unstable political climates, the Company’s ability to successfully implement new information technologies, customer acceptance of
both new designs and newly-introduced product lines, actions of competitors that may impact the Company’s business, disruptions
to transportation systems or shipping lanes used by the Company or its suppliers, and the Company’s dependence upon licenses
from third parties. Reference is also made to the Company’s periodic filings with the Securities and Exchange Commission for
additional risk factors that may impact the Company’s results of operations and financial condition. The Company does not
undertake to update the forward-looking statements contained herein to conform to actual results or changes in our expectations,
whether as a result of new information, future events or otherwise.

                                                                                                     Crown Crafts 2019 Investor Presentation   2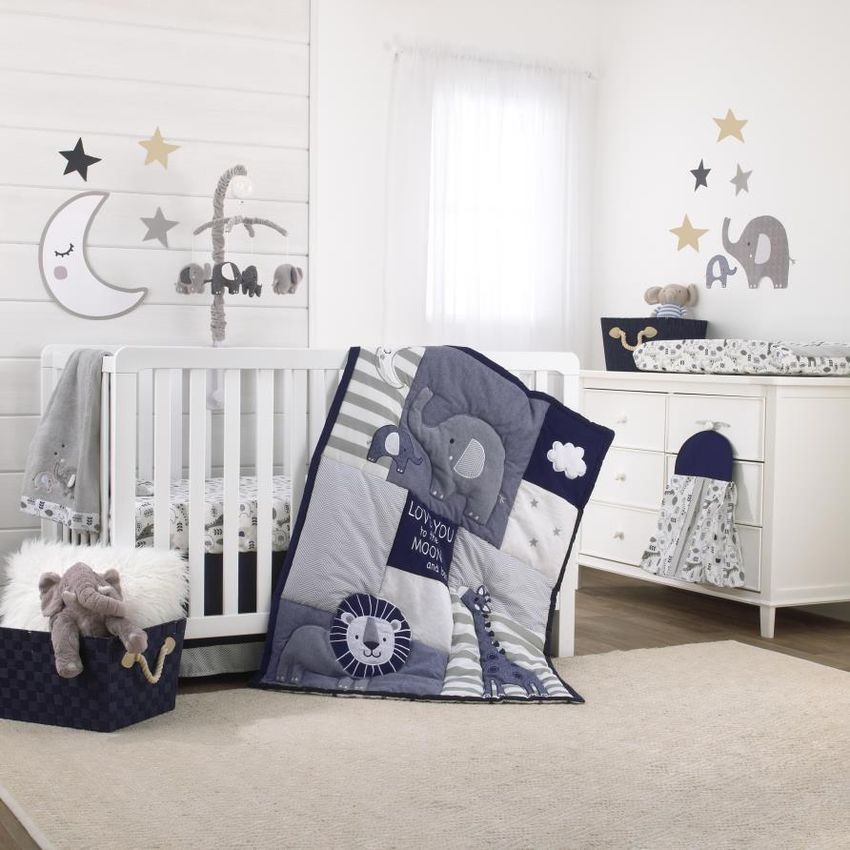
Crown Crafts – Who We Are

   • One of America’s largest producers of infant, toddler
     and juvenile consumer products
   • Attractive lines of leading name-brand and private-label
     merchandise
   • Steady profitability in a traditionally stable niche of the
     retail industry
   • Sustained market leadership and product innovation
   • Strong licensing and retail relationships
   • Well-positioned for continued future growth
   • “Doing the right thing”

                                                    Crown Crafts 2019 Investor Presentation   3
Crown Crafts’ Company History

                                              Relocated Corporate
                                                Headquarters to
       Company Founded                           Gonzales, LA
       in Northern GA              Entered                                          Acquired Neat Solutions
                                   Infant &
                                                                     Listed on                   Resumption                Acquired
                                   Juvenile
                                                                     NASDAQ                      of Dividends              Carousel
                                   Products
                                                                                                                           Designs
                                   Business

1957       1968      1994          1995        2001        2006       2007         2009            2010                  2017

                                                                        Acquired Toddler
                                                                                                                                Acquired
                                                                       Bedding Business
                       Listed on                                                                                                 Sassy
                                                                      from Springs Global
                        NYSE
                                                           Refinanced Debt and
                                                           Extinguished Warrants
              Initial Public                                                                  Acquired Bibsters from The
            Offering - AMEX                     Reorganized and                               Procter & Gamble Company
                                                 Sold Off Adult
                                                   Bedding

                                                                                            Crown Crafts 2019 Investor Presentation   4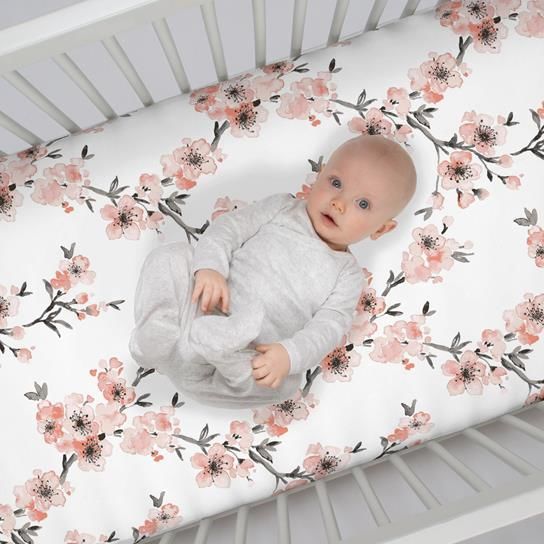
Six Company Locations Handle Distribution,
Global Sourcing, Customer Service

 Compton, CA
 Headquarters of NoJo
      Baby & Kids;
   warehousing and
  distribution for the
    entire company                    Grand Rapids, MI
                                      Product development and
                                      sales office of Sassy brand       Shanghai, PRC
                                                                    Foreign Representative Office

                                        Douglasville, GA
                                        Headquarters of Carousel
                                         Designs; manufacturing
                                            and distribution

 Bentonville, AR
 Administrative office in   Gonzales, LA
   support of sales to      Headquarters of Sassy
        Walmart              Baby and Corporate
                                Headquarters

                                                                      Crown Crafts 2019 Investor Presentation   5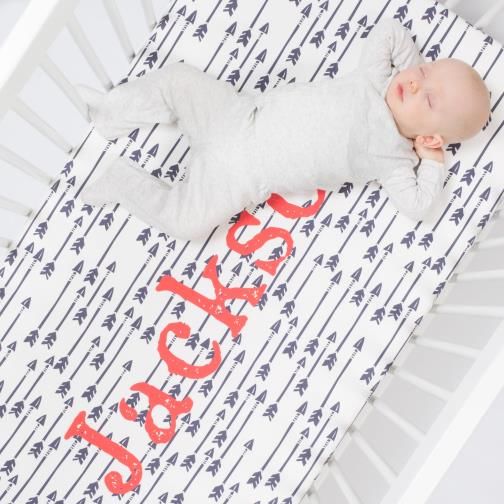
Serving a Wide Range of Infant, Toddler and
Juvenile Product Categories

                Net Sales by                                     Gross Sales by Product
             Operating Subsidiary                                Category (Unaudited)
  Carousel
  Designs
     8%                                                                       21%
                                                                              Infant
                           NoJo Baby                                         Bedding          18%
                             & Kids                                                       Toddler
                              45%                                   22%                   Bedding
                                                                    Bibs
              Sassy Baby
                 47%

                                                      Accessories                                            14%
                                                                                                      Developmental
                                                          7%                                               Toys
                                                               Disposables
                                                                   8%                   10%
                                                                                       Blankets

              Percentages based on operating results for the fiscal year ended March 31, 2019

                                                                                         Crown Crafts 2019 Investor Presentation   6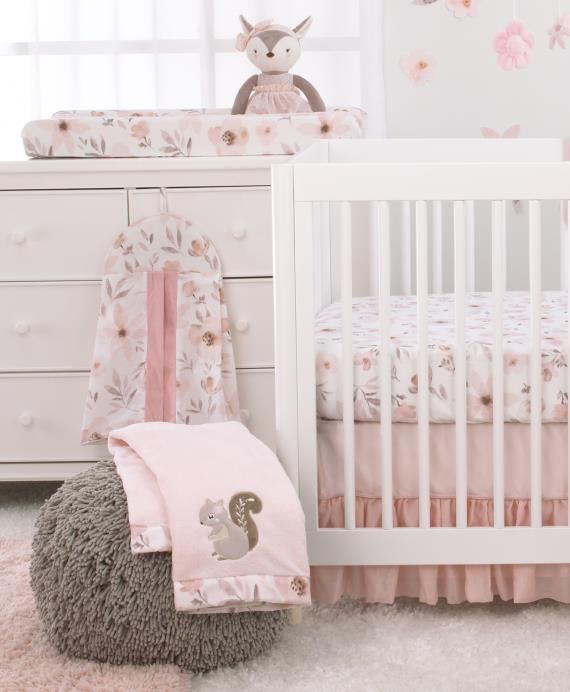
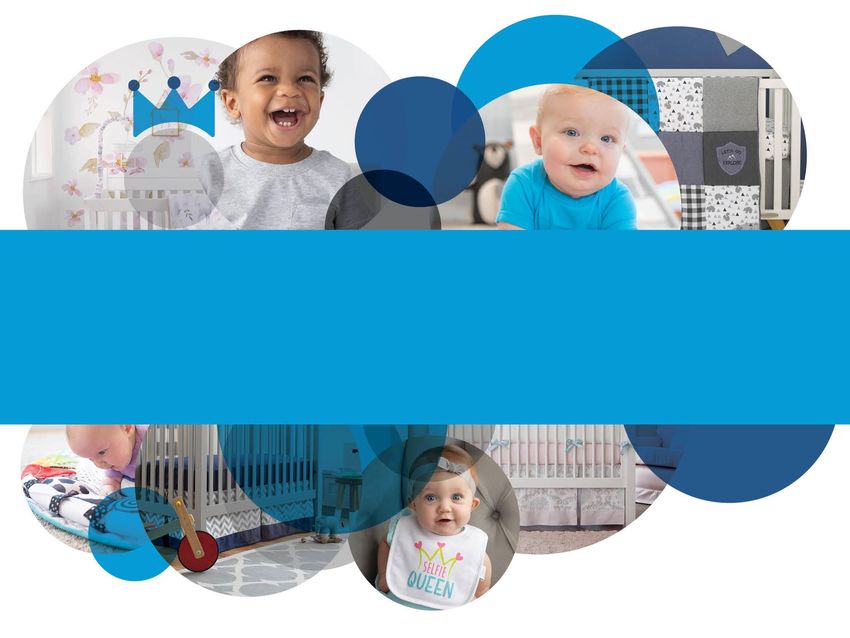
NoJo Baby & Kids – Comfort and Quality Inside the
Crib; Licensed Characters Popular with Toddlers
Crib Bedding – Generally used until age 2      Toddler Bedding – Generally used from ages 2-4
• Designs include traditional, contemporary,   • Designs are almost entirely driven by licenses as
     textured and whimsical patterns               children experience movies, TV, etc.

                                                                        Crown Crafts 2019 Investor Presentation   7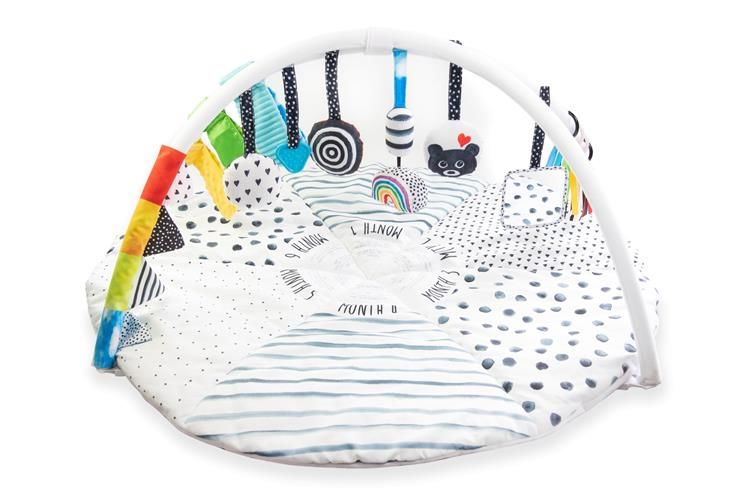
NoJo Baby & Kids – Designing the Whole Nursery

                                                 Crown Crafts 2019 Investor Presentation   8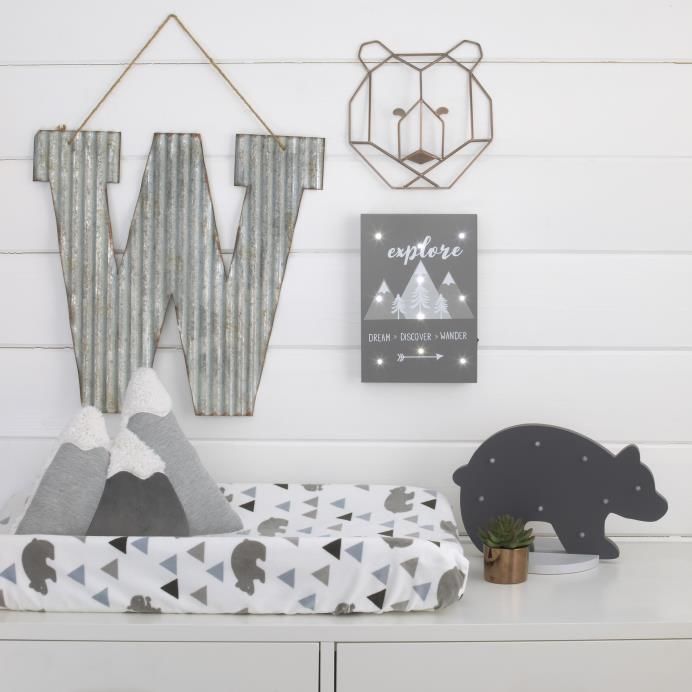
Sassy Baby Products – Soft Bibs and Bath

 More than 24 Million Bibs Sold Annually   Hooded Towels, Washcloths
                                                 & Bath Robes

                                                    Crown Crafts 2019 Investor Presentation   9
Developmental Toys,
                           Feeding and Care Products
•   Dominant player for more than 30 years
•   Opportunities for strategic growth                    Bath Toys
•   Innovative products that align with babies’
    developmental milestones
•   Products are sold worldwide in over 30 countries
                Developmental Toys

                                                       Play Gyms

                                                       Crown Crafts 2019 Investor Presentation   10
Sassy Baby Products - Neat Solutions for Messy Occasions;
Convenience and Cleanliness at Home or Away
Diaper Sacks
Crown Crafts 2019 Investor Presentation 11Carousel Designs –
Mom Gets What Mom Wants
• Founded in 1988, Carousel Designs is a leading domestic
manufacturer of premium baby bedding, fabric and home décor
• Highly trusted premium brand that establishes customer loyalty
• Direct-to-Consumer Sales Channel through www.babybedding.com
• Customers create their own bedding online using the exclusive
Nursery Designer® tool
• Thousands of product customization and personalization options
• Strong social media following
Crown Crafts 2019 Investor Presentation 12Supplying Retailers Where Parents Shop
Gross Sales by Customer
For the Fiscal Year Ended March 31, 2019
(Unaudited)
16%
41% 10%
9%
Direct-to-Consumer
6%
4%
11% 3%
All Others International
Crown Crafts 2019 Investor Presentation 13Strong Line of Company-Owned Brands
Crown Crafts 2019 Investor Presentation 14World-Class Licensed Collections
Crown Crafts 2019 Investor Presentation 15Financial Highlights
Crown Crafts 2019 Investor Presentation 16Operating Highlights – Fiscal Years 2017 - 2019
Reported Diluted Earnings per Share
Net Sales (in millions)
Adjusted Diluted Earnings per Share
$100.0
$90.0 $1.00
$76.4 $0.80
$80.0 $0.55 $0.55 $0.53 $0.50 $0.51
$66.0 $70.3 $0.60
$70.0 $0.40
$0.30
$60.0 $0.20
$50.0 $0.00
2017 2018 2019 2017 2018 2019
Fiscal Year Fiscal Year
Net Sales:
$12.0 20.0% Percentage of Net Sales • Sales from acquisitions were $7.5 million and $18.3 million
$9.7 $9.5 in FY 2018 and 2019, respectively.
Adjusted EBITDA
Adjusted EBITDA as a
$8.8 17.0%
$9.0 • Toys “R” Us sales were $11.2 million and $9.7 million in FY
($ millions)
2017 and FY 2018, respectively.
14.0% Net Income and EBITDA:
$6.0 14.6%
13.5% 11.0% • FY 2018 - $2.8 million ($2.4 million after-tax or $0.23 DEPS)
11.5% in non-recurring costs including acquisition costs, the
$3.0 8.0% impact of Toys “R” Us’ bankruptcy and subsequent
liquidation (including licensing royalty shortfalls resulting
$0.0 5.0% from lower sales) and a revaluation of deferred tax assets
2017 2018 2019 and reserves for unrecognized tax benefits of $498,000.
• FY 2019 - $210,000 in non-recurring costs to move Sassy
Fiscal Year branded inventory from Grand Rapids, MI to Compton, CA.
Crown Crafts 2019 Investor Presentation 17Operating Highlights - Fiscal 2019 and 2020 2nd
Quarter (Unaudited)
Net Sales (in millions) Diluted Earnings per Share
$25.0 $0.20
$20.5 $0.18 $0.18
$20.0 $18.6
$0.15
$15.0
$0.10
$10.0
$5.0 $0.05
2019 2020 2019 2020
Fiscal Year Fiscal Year
16.0%
EBITDA as a Percentage
$2.9
EBITDA ($ millions)
$3.0 $2.8
15.0%
of Net Sales
15.1%
$2.0
14.2% 14.0%
$1.0 13.0%
$0.0 12.0%
2019 2020
Fiscal Year
Crown Crafts 2019 Investor Presentation 18Operating Highlights - Fiscal 2019 and 2020 Six
Months (Unaudited)
Reported Diluted Earnings per Share
Net Sales (in millions)
Adjusted Diluted Earnings per Share
$40.0 $36.0
$34.5
$35.0 $0.28
$0.30
$0.25
$30.0 $0.25
$0.21 $0.22
$25.0 $0.20
$20.0 $0.15
2019 2020 2019 2020
Fiscal Year Fiscal Year
• FY 2019 included $210,000 $5.0 14.0%
Percentage of Net Sales
($156,000 after-tax, or $0.015
Adjusted EBITDA as a
$4.3
Adjusted EBITDA
DEPS) in costs to move Sassy 13.0%
$3.9
($ millions)
branded inventory from Grand $4.0
Rapids, MI to Compton, CA. 12.5% 12.0%
• FY 2020 included $292,000, or
$3.0
$0.03 DEPS favorable impact 11.0%
related to the reversal of 10.8%
unrecognized tax benefits, $2.0 10.0%
interest and penalties (no EBITDA 2019 2020
impact). Fiscal Year
Crown Crafts 2019 Investor Presentation 19By the End of FY 2020, Will Have Returned $40.4
Million in Dividends to Stockholders Since 2010
Dividends Paid Per Share
$0.97
$1.00
$0.78
$0.80
$0.57
$0.60
$0.40
$0.32 $0.32 $0.32 $0.32 $0.32
$0.20 $0.13
$0.08
$0.00 (2) (3)
(1)
2011 2012 2013 2014 2015 2016 2017 2018 2019 2020
Fiscal Year
1. Dividends paid included a special dividend of $0.50 per share.
2. Dividends paid included special dividends of $0.65 per share.
3. Includes recently declared $0.08 quarterly dividend and $0.25 special dividend
payable January 3, 2020 to stockholders of record on December 13, 2019.
Crown Crafts 2019 Investor Presentation 20For Additional Information
Attendees and other viewers of this presentation are advised to read
all reports and other filings made by the Company with the Securities
and Exchange Commission under the Securities Act of 1933 and the
Securities Exchange Act of 1934. Copies of these filings may be
obtained, without charge, by directing a request to Halliburton Investor
Relations & Communications, 2140 Lake Park Boulevard, Suite 112,
Richardson, TX 75080, or at www.sec.gov.
Crown Crafts 2019 Investor Presentation 21The Presentation of Non-GAAP
Financial Measures
In addition to the Company’s presentation of its financial position and results of operations in conformity with accounting principles generally
accepted in the United States (“GAAP”), the Company has also presented measures of its financial position and results of operations which are
not determined in accordance with GAAP. These non-GAAP financial measures include earnings before interest, taxes, depreciation and
amortization (“EBITDA”). Additionally, with respect to the fiscal years ended April 1, 2018 and March 31, 2019, the Company has presented what
its net income, earnings per share and EBITDA would have been if certain non-recurring costs had not been recognized (to arrive at “Adjusted Net
Income”, “Adjusted Earnings per Share” and “Adjusted EBITDA”, respectively). The charges excluded to calculate Adjusted Net Income, Adjusted
Earnings per Share and Adjusted EBITDA are significant components to be considered in an understanding and assessment of the Company’s
results of operations. The Company believes that the non-GAAP financial measures included in this presentation provide useful information and
are important indicators of the Company’s ability to generate cash sufficient to service its debt, declare and pay dividends, make strategic
investments and capital expenditures and meet working capital requirements and other obligations as they become due. The Company uses
these non-GAAP financial measures internally to monitor the Company’s operating results and cash flow and to evaluate the performance of its
businesses. These non-GAAP financial measures are provided as supplemental information and should be considered in addition to, and not as a
substitute for, the Company’s GAAP measures, including its net income, earnings per share, cash flow provided by or used in operating, investing
or financing activities, and other measures of the Company’s financial position or results of operations reported in accordance with GAAP.
Because these non-GAAP financial measures are, by definition, not calculated in accordance with GAAP, another company using the same GAAP
financial information could possibly arrive at a different calculation of these non-GAAP financial measures. Therefore, the non-GAAP financial
measures as presented by the Company may not be comparable to similarly-titled measures that may be presented by another company.
Crown Crafts 2019 Investor Presentation 22Operating Highlights
(In thousands, except percentages – unaudited)
Fiscal Year Fiscal 2nd Quarter Fiscal Six Months
Non-GAAP Reconciliation of
Net Income to EBITDA and
Adjusted EBITDA: 2017 2018 2019 2019 2020 2019 2020
Net income $ 5,572 $ 3,021 $ 5,019 $ 1,809 $ 1,779 $ 2,073 $ 2,858
Interest expense 68 162 325 88 21 187 (3)
Interest income (134) (79) - - 2 - (3)
Income tax expense 3,224 2,400 1,772 647 603 727 660
Depreciation 178 333 640 155 178 293 357
Amortization 754 836 840 214 213 414 427
EBITDA $ 9,662 $ 6,673 $ 8,596 $ 2,913 $ 2,796 $ 3,694 $ 4,296
Non-recurring costs - 2,845 210 - - 210 -
Adjusted EBITDA $ 9,662 $ 9,518 $ 8,806 $ 2,913 $ 2,796 $ 3,904 $ 4,296
Net sales $ 65,978 $ 70,270 $ 76,381 $ 20,536 $ 18,560 $ 35,996 $ 34,502
Adjusted EBITDA as a
Percentage of Net Sales 14.6% 13.5% 11.5% 14.2% 15.1% 10.8% 12.5%
Crown Crafts 2019 Investor Presentation 23Operating Highlights
(In thousands, except percentages – unaudited)
Fiscal Year Fiscal 2nd Quarter Fiscal Six Months
Non-GAAP Reconciliation of
Net Income to Adjusted Net Income: 2017 2018 2019 2019 2020 2019 2020
Net income $ 5,572 $ 3,021 $ 5,019 $ 1,809 $ 1,779 $ 2,073 $ 2,858
Non-recurring costs - 2,845 210 - - 210 (78)
Income tax impact of non-recurring costs - (475) (49) - - (54) (214)
Adjusted net income $ 5,572 $ 5,391 $ 5,180 $ 1,809 $ 1,779 $ 2,229 $ 2,566
Non-GAAP Reconciliation of
Earnings per Share to Adjusted Earnings per
Share:
Weighted Average Shares Outstanding:
Basic 10,013 10,072 10,092 10,086 10,143 10,078 10,131
Diluted 10,041 10,079 10,094 10,088 10,143 10,080 10,131
Earnings per Share as Reported:
Basic $ 0.56 $ 0.30 $ 0.50 $ 0.18 $ 0.18 $ 0.21 $ 0.28
Diluted $ 0.55 $ 0.30 $ 0.50 $ 0.18 $ 0.18 $ 0.21 $ 0.28
Adjusted Earnings per Share:
Basic $ 0.56 $ 0.54 $ 0.51 $ 0.18 $ 0.18 $ 0.22 $ 0.25
Diluted $ 0.55 $ 0.53 $ 0.51 $ 0.18 $ 0.18 $ 0.22 $ 0.25
Crown Crafts 2019 Investor Presentation 24You can also read