Investors Presentation - October 2021 Dr Stephan Meeder, CEO/CFO Heike Baumbach, Head of Investor Relations - CropEnergies AG
←
→
Page content transcription
If your browser does not render page correctly, please read the page content below

Investors Presentation
                          October 2021
                      Dr Stephan Meeder, CEO/CFO
           Heike Baumbach, Head of Investor Relations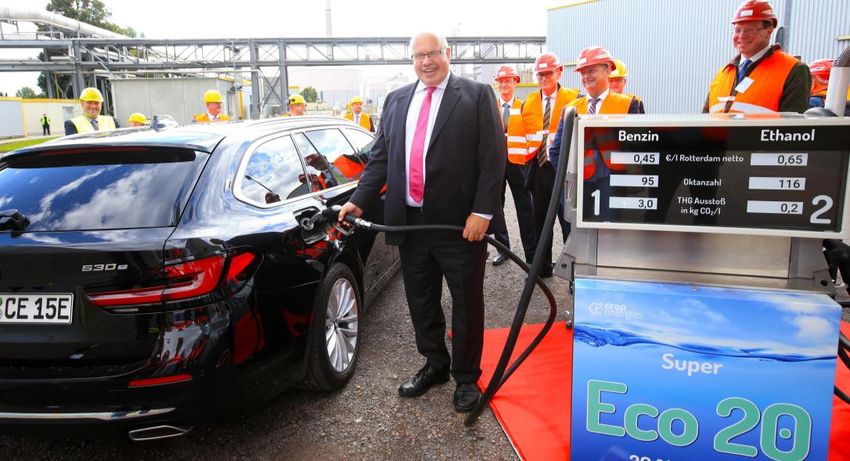
EU: European Green Deal

European Parliament gave green light to first-ever EU climate law on 24 June 2021
• Interim target: Reduction of GHG emissions of at least 55% by 2030 (on 1990 levels)
• Climate-neutrality by 2050

“Fit for 55” legislative package
• Proposals to make the EU's climate, energy, land use, transport and taxation
  policies fit for reducing net greenhouse gas emissions by at least 55%
  by 2030, compared to 1990 levels

Revision of various regulations and directives planned, i.e.
• Emissions Trading System (ETS)
• Effort Sharing Regulation (ESR)
• Revision of the Energy Tax Directive (ETD)
• Amendment to the Renewable Energy Directive (RED II)

October 2021

Renewable Ethanol
As fuel

• Produced from local, renewable raw
  materials
• High-quality fuel for petrol engines
• Ensures that fossil carbons remain in
  the ground permanently and do not
  continue to drive climate change
• Less greenhouse gas emissions,
  nitrogen oxides & particulate matter
  emissions compared to fossil fuels
• CropEnergies ethanol reduces
  CO2 emissions by an average of more
  than 70% compared to fossil fuel.

October 2021

Ethanol
>70% less GHG emissions compared to fossil fuels*

• The GHG values of all elements in the value-added chain are added up
• The emissions from ethanol when used in combustion engines is zero
• European ethanol reduces annual GHG emissions by >10 Mt**

     Cultivation                     Transport    Ethanol      Ethanol        CO2
       Grain                           Grain     Production   Transport   Liquefaction

*83,8 gCO2eq/MJ **Own calculations

October 2021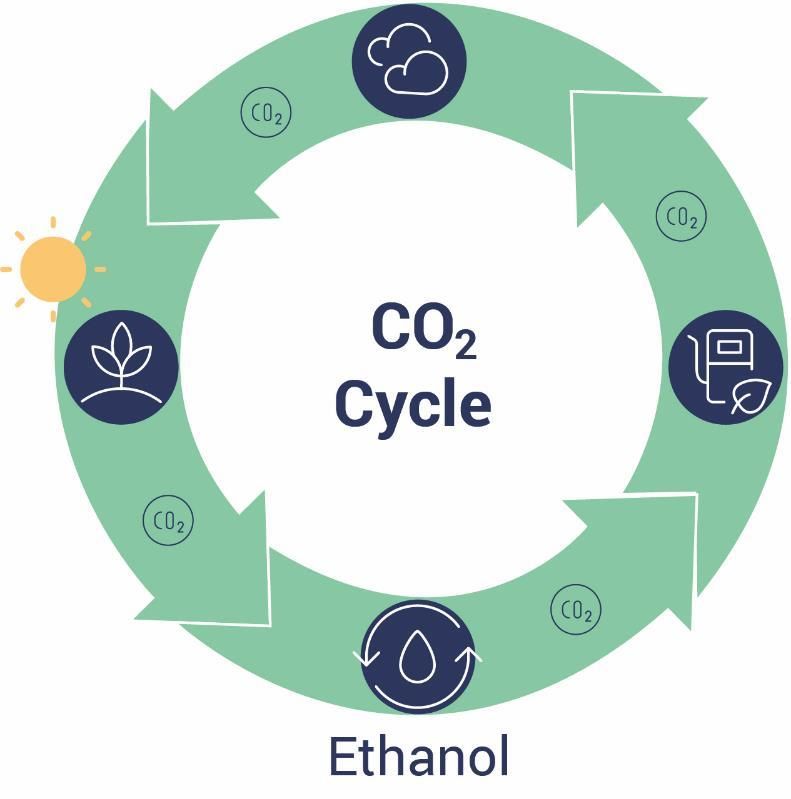
Range of products
Renewable Ethanol

                                         As an additive to petrol to improve the
                                         greenhouse gas balance

                                         As neutral alcohol for beverages and
                                         foods

                                         As neutral alcohol for the processing
                                         industry: cosmetics, pharmaceuticals,
                                         disinfectant and technical applications

                                         As a raw material for the chemical
               High-quality, renewable   industry
                  ethanol (alcohol)

October 2021
Range of products
Food and animal feed

   ProtiGrain® & Ensus-      CDS – ProtiWanze®               Gluten             Liquefied biogenic
           DDGS              liquid protein animal   Protein product for the            CO2
     dried high-quality               feed           food and animal feed      for food and industrial
   animal feed, in form of                                  industry                 applications
     powder or pellets

October 2021
The ethanol markets
EU & UK production

• World production                                                                    • EU & UK production
   • 2021e: 122 million m3 (+3%)                                                          • 2021e: 7.7 million m3 (+3%)
         o Fuel applications: 102 million m³ (+3%)                                            o Fuel applications: 5.3 million m³ (+5%)
   • 2022e: 128 million m3 (+5%)                                                          • 2022e: 8.1 million m3 (+5%)
         o Fuel applications: 108 million m³ (+5%)                                            o Fuel applications: 5.8 million m³ (+8%)

               World production of ethanol [M m3]                                                   EU production of ethanol [M m3]
150                                                                                      9

100                                                                                      6

                                                                                                                                               Source: FO Licht (2021)
                                                            Source: FO Licht (2021)

 50                                                                                      3

       2017      2018     2019      2020    2021e   2022e                                    2017   2018     2019      2020    2021e   2022e
                 USA    Brasil   EU & UK   other                                                             fuel   non-fuel
October 2021                                                                                                                           7
Market development (I)
Volumes

• Ethanol market in the EU27 & UK in 2021 (in million m³)                                 EU27 & UK: ethanol sales [1,000 m3]
• Consumption:      8.6       +3%       (5.7 fuel | 2.9 non-fuel)                     8,599                                     8,560               8,951

                                                                                                                                                                    Source: IHS Markit (2021)
                                                                            ,
                                                                           9.000                              8,317
                                                                                       982                                       965                 965
                                                                                                               955
• Production:       7.7       +3%       (5.3 fuel | 2.3 non-fuel)                     1,618                   1,950             1,890               1,860

• 2021 only slight recovery in fuel ethanol sales expected                  ,
                                                                           4.500
                                                                                      5,999                   5,412             5,705               6,126
• Net imports around 0.9 million m³ foreseen in 2021 (PY 1.0 million m³)
• Outlook: Strong increase in fuel ethanol sales in 2022                      0
                                                                                          2019                2020              2021                2022
                                                                                    Fuel            Industrial            Potable

• Premium E10 continues to be on the rise in Europe                                   E10 shares in selected countries

                                                                                                                                                                           Source: ePURE (2021)
                                                                           100%
• E10 already established as #1 petrol in many European countries

                                                                                   100%
                                                                                           100%
                                                                                                  98%
                                                                                                        95%
                                                                                                              95%
                                                                                                                    95%
                                                                                                                          90%
                                                                                                                                80%
• Launch in Sweden and UK in August and September, respectively

                                                                                                                                      72%
                                                                                                                                            70%
                                                                            50%

                                                                                                                                                              16%
                                                                                                                                                  47%
                                                                                                                                                        45%
                                                                             0%

October 2021                                                                                                               8
Market development (II)
Prices and feedstock market
European ethanol prices [€/m3]
850
• European ethanol price* on the rise
• Due to increased mobility in many countries
o But also reflects higher global energy and grain prices 600
• Average ethanol price € 656 (665) /m³ in Q2
FY 19/20 FY 20/21 FY 21/22
350
• Feedstock market 2021/22
• Grain prices**: € 221 (183) /t in Q2
• EU grain harvest: 291 Mt (+4%) exceeds consumption of 263 Mt Euronext Paris Wheat [€/t]
280
• World grain harvest***: 2.283 Mt (+3%) with slightly lower stocks (589 Mt)
• Still high price level despite promising harvest estimations
200
FY 19/20 FY 20/21 FY 21/22
120
* T2 FOB Rdam ** Wheat (Euronext), next expiry *** all types, without rice
October 2021 9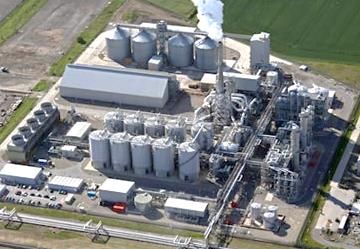
Market development (III)
Energy markets
                                                                                 Natural Gas FR [€/MWh]
                                                                        100
                                                                              FY 19/20   FY 20/21   FY 21/22
• National gas prices severely increased in Europe
    • Low storage levels due to long and cold winter 2021
    • LNG exports from the US rather heading to Japan/Corea             50
    • Supply of LNG from Russia to the European market decreased
    • Low renewable power generation esp. in UK shifts gas volumes to
       electricity generation                                            0

    • Start of supply by new North Stream 2 pipeline remains unclear
    • Price development in winter season will be weather-driven
                                                                                 Natural Gas UK [€/MWh]
                                                                        120
                                                                              FY 19/20   FY 20/21   FY 21/22

                                                                        60

                                                                         0

October 2021                                                                                10
State of EU energy and transport policies Before Fit for 55 October 2021 11
Renewable Energy Directive-II
The “toolbox“

  Arable crops               Annex IX-A                Annex IX-B                Electricity

• 2020 level, max. 7%     • Min. 0.2% in 2022       • Max. 1.7%, but still   • Important component
• Local, sustainable      • Min. 1.0 % in 2025        x2 versus today          in the future

• Proteins                • At least 3.5% in 2030   • UCO imports: 10x       • But: discretionary
                                                      within last 10 years     multiplier (x4) does not
• Commitment to 1G        • Strong market                                      save a single gram of
  as reliable basis for     potential               • Compatibility with
                                                                               CO2
  low-emission                                        law on waste needs
                          • Very capital intense      to be ensured          • Extension only
  transport sector
  necessary                                                                    reasonable if
                          • Investment security                                additional green
                            and investment                                     electricity will be
                            incentives decisive                                produced

October 2021                                                                                              12
State of EU energy and transport policies After Fit for 55 (proposal) October 2021 13
Vision and mission

OUR VISION
Our vision is a climate friendly world in which
renewable resources are key to ensuring the welfare
of today‘s and future generations.

OUR MISSION
Our mission is to be the most trusted partner for our
customers delivering sustainable products made out
of biomass.

Our new appearance:

October 2021                                            14
Preliminaries Q2 and Outlook 2021/22

• Outlook (published on 15 September 2021)
    • High raw material and energy costs with higher ethanol
      revenues
    • Revenues between € 970 and 1,010 million
    • EBITDA in a range of € 105 to 135 million
    • Operating profit between € 65 and 90 million

• Preliminaries Q2 2021/21
    • Revenues on record level at € 249.2 (228.5) million
    • Operating profit below record level of previous year‘s
       period at € 23.3 (42.6) million

October 2021                                                   15
CropEnergies
Innovation from Biomass
For our future:
Sustainability and climate neutrality
• in its traditional core business of mobility - with
sustainable and climate-friendly fuels
• in a completely new business area based on
ethanol derivatives as an alternative to fossil
raw materials
• with biogenic CO2 as the raw material of the
future and as capital for the company's further
development
• to serve a clear growth market with protein
products for the food and animal feed industry
and to deepen the value chain
October 2021 16Communication
Update
• E20
• Four Motors sponsoring going well
• Sponsoring ADAC 1.000 km race at Nürburgring
18 Sept – pace cars and two participants were
powered by CropEnergies‘ Super Eco 20
• Federal Minister of Economics Peter Altmaier visited
CropEnergies in Zeitz on 26 August 2021
• #umtanken (umtanken.de) went online beginning of July –
facts and figures about ethanol
October 2021 17Q1 2021/22
Overview 1st quarter 2021/22

 • Ethanol production                                                               235 (208) ,000 m³             + 13%
 • Revenues                                                                         € 214 (171) million           + 25%

 • EBITDA                                                                          € 25.5 (18.2) million   + € 7 million
 • Operating profit                                                                 € 15.1 (8.1) million   + € 7 million
 • Net earnings                                                                     € 10.1 (7.9) million   + € 2 million

 • Net financial assets (vs. 28.02.2021)                                         € 182.6 (154.6) million + € 28 million

   Note: Figures in parentheses relate to the corresponding prior-year period.

October 2021                                                                                                 19
Operating profit

                                                                                            Revenues / Production
                                                                                               [M€ / 1,000 m3]
                                                                                    400
 (in € million)                                  Q1 2021/22   Q1 2020/21    Δ
                                                                                    300               272
                                                                                                255         251
 Revenues                                            214.1        170.7    + 25%                                  235
                                                                                          208
 Overall performance                                 210.5        169.6    + 24%    200         229   226
                                                                                                            208   214
 Cost of materials*                                  -163.0       -131.3   - 24%          171
                                                                                    100
 Spread (gross)                                       47.5         38.3    + 24%

    in % of overall performance                     22.6%        22.6%          -     0
                                                                                           Q1    Q2    Q3    Q4    Q1
 Further
*without    operating
         restructuring    expenses/income*
                       costs and special items        -22.0        -20.1   - 10%          20/21 20/21 20/21 20/21 21/22
                                                                                             Operating profit [M€]
 EBITDA*                                              25.5         18.2    + 40%     50
  Margin                                            11.9%        10.7%          -                43
                                                                                     40
 Depreciation*                                        -10.4        -10.1    - 3%
                                                                                                       29    28
                                                                                     30
 Operating profit                                     15.1          8.1    + 86%
*without restructuring costs and special items                                       20                            15
• Significant increase in sales prices and quantities                                10    8

• Higher specific raw material and energy costs                                       0
                                                                                           Q1    Q2    Q3    Q4    Q1
                                                                                          20/21 20/21 20/21 20/21 21/22

October 2021                                                                                    20
Net earnings
Net earnings [Mio. €]
50
(in € million) Q1 2021/22 Q1 2020/21 Δ
40
Operating profit 15.1 8.1 + 86% 32
30
Restructuring costs / special items 0.0 0.0 - 24
22
At-equity result -0.1 0.1 - 20
10
Income from operations 15.0 8.2 + 83% 10 8
Financial result -0.9 2.3 - 0
Q1 Q2 Q3 Q4 Q1
Earnings before income taxes 14.1 10.5 + 34% 20/21 20/21 20/21 20/21 21/22
Taxes on income -3.9 -2.6 - 50%
Net earnings for the period 10.1 7.9 + 28%
Earnings per share (in €) 0.12 0.09 + 28%
• Unrealised currency effects included in financial result
• EPS increased to € 0.12 (0.09)
October 2021 21Cash flow
Cash flow (+) / Investments* (-)
[M€]
50 *in PPE
(in € million) 2020/21 2019/20 Δ 40
Cash flow 21.2 15.5 + 5.7 30
Change in net working capital 12.9 18.5 - 5.6 21
20 16
Net cash flow from operating activities 34.1 34.0 + 0.1 10
Investments in property, plant et al. -4.7 -10.1 + 5.4
0
Cash received on divestments 0.0 0.0 + 0.0
-10 -5
Payments into financial receivables -18.1 -16.9 - 1.2
Q1 Q1
Payments into current financial investments 0.1 0.0 + 0.1 20/21 21/22
Net financial asset [M€]
Cash flow from investing activities -22.6 -26.9 + 4.3 250
Cash flow from financing activities -1.4 -0.9 - 0.5
200 183
Changes in exchange rates / consolidation basis 0.0 -0.1 + 0.1 165
155
150 130
Change in cash and cash equivalents 10.1 6.1 + 4.0
100 92
31/05/2021 31/05/2020 Δ
50
Net financial assets 182.6 130.2 + 52.4
0
• Significant increase in net financial assets
October 2021 22Appendix
23Climate-friendly liquid fuels will be essential
Development of car registrations and vehicles in use
New car registrations EU27 New car registrations DE Vehicles in use DE
2% 2% 2% 0.4% 1% 0.4% 0.5%
100% 1% 100% 50 Mio. 1% 1% 1%
5% 2% 7% 0.1% 0.2% 0.6%
2% 8% 12%
5% 7%
7% 0.2% 0.3% 0.6%
32% 11% 40 Mio.
32% 32% 32% 31%
75% 28% 75%
22% 28%
22% 1% 1.5%
6% 5% 30 Mio. 0.6%
12% 19% 50% 11%
50%
16%
20 Mio.
59% 66% 66% 65%
58% 25%
25% 47% 47%
42% 39% 10 Mio.
0% 0% Mio.
2019 2020 Jan-Jun 2021 2019 2020 Jan-Jul 2021 01.01.2019 01.01.2020 01.01.2021
Gasoline HEV Gasoline HEV
Gasoline HEV
Diesel BEV Diesel BEV
Diesel BEV
PHEV APV other than electric
PHEV APV other than electric PHEV APV other than electric
October 2021 24Gross electricity generation in the EU27 in
Total: 2,760 TWh
Gross electricity generation in the Development of electricity generation in the
EU27 in 2020 EU27 [TWh]
Total: 2,760 TWh 1200
38%
fossil
(others) 1000
4% 33%
800 25%
solid fossil
13% 30%
600
renewables
natural gas 38% 16% 20%
20% 400
12% 13%
200
9%
nuclear 4%
25% 0
renewables nuclear natural gas
Source: Agora (2021) solid fuels fossil (others)
Source: Agora (2021)
October 2021 25Fuel consumption in the EU27 in 2019
Total: 3,168 TWh
Fuel consumption in the EU27 (2019)
24% 20%
Gasoline
Biodiesel/
Ethanol 1% HVO*
Biodiesel Palmoil
Others 4%
20% Ethanol 60%
68% Diesel
3%
still 95% fossil only 5% renewables
*) without palm-based
fuels (estimate)
Source: Eurostat (2021)
October 2021 26Climate protection for Germany
• National implementation of RED-II
• Overall GHG quota from currently 6% to 25% in 2030
o Penalty for non-compliance increases to € 600/t CO2äq from 2022 on DE: GHG reduction quota
2020-2030
o GHG quota will be further increased depending on the growth in e-mobility 25%
25%
o Recognition of Upstream Emission Reductions will cease after 2026
o Introduction of special blending quota for synthetic jet fuels from 2026 on 20%
17.5%
• Phase-out of high ILUC fuels (palm oil) from 2023 on* 15%
12%
• Biofuels from arable crops: max. 4.4% (2018: 3.2%)*
10% 9.25%
• Advanced biofuels from residues min. 2.6% in 2030* 7%
8%
6%
• Multiple counting schemes for electromobility, advanced/synthetic fuels* 5%
0%
* Further regulations to be laid down at ordinance level
October 2021 27More climate protection for Europe
EU taxonomy regulation
• Classification system to promote sustainable investments
• Application on EU environmental targets
• From 2022: climate change mitigation and adaptation on climate change
• From 2023: Protection of water und maritime resources, transition to circular
economy, no/less environmental pollution and protection of
biodiversity/ecosystems
• Evaluation
• Positive: basic idea and recognition of the contribution of biofuels to climate
protection and the adaptation to climate change
• But: exclusion of crop-based biofuels for climate change mitigation measures is
arbitrary and in contradiction to the Renewable Energy Directive
October 2021 28Production sites of CropEnergies
CropEnergies AG
Mannheim - Germany
Zeitz – Germany Wanze – Belgium Loon-Plage – France Wilton – UK
CropEnergies Bioethanol GmbH BioWanze SA Ryssen Alcools SAS Ensus UK Ltd
400,000 m³ ethanol 300,000 m³ ethanol > 100,000 m³ ethanol for fuel 400,000 m³ ethanol
350,000 t DDGS Capacity: more
Annual thereof up to 60,000 m3 neutral > 60,000 t wheat gluten applications
than 1.3 Mm³
capacity: alcohol > 400,000 t ProtiWanze® 90,000 m³ ethanol for traditional
ethanol and more
> 300,000 t ProtiGrain® (DDGS) and technical applications
than 1 Mt food and
100,000 t liquefied CO2
animal feed per
Raw
Grain year
materials: Grain and sugar syrups Grain and sugar syrups Raw alcohol
October 2021 29Financial Calender
13 October 2021: Report for the 1st half of 2021/22
Contakt
12 January 2022: Statement for the 1st-3rd quarter of 2021/22 CropEnergies AG
18 May 2022: Annual report and press and analysts‘ conference FY 2021/22 Maximilianstraße 10
6 July 2022: Statement for the 1st quarter of 2022/23 68165 Mannheim
12 July 2021: Annual General Meeting 2022 www.cropenergies.com
Stock Information Investor Relations Public Relations / Marketing
ISIN: DE000A0LAUP1 Heike Baumbach Nadine Dejung-Custance
Symbol: CE2 Phone: +49 (621) 71 41 90-30 Phone: +49 (621) 71 41 90-65
Bloomberg / Reuters: CE2 GY / CE2G.DE
ir@cropenergies.de presse@cropenergies.de
Transparency standard: Prime Standard
Disclaimer
This presentation contains forward looking statements. The statements are based on current assumptions and estimates made by the executive board and information currently available to its members. The forward looking
statements are not to be viewed as guarantees of the future developments and results presented therein. Future developments and results are in fact dependent on a variety of factors and are subject to various risks and
imponderables. They are based on assumptions that could in fact prove to be invalid. The risk management report in the current annual report presents an overview of the risks. We assume no obligation to update the forward-
looking statements made in this presentation. In addition, all disclaimers published on the CropEnergies website apply.
This presentation includes percentage and number rounding. Typing and printing errors reserved.
Written and visual value statements are standardized as follows:
± 1% - stable ± 1 – 4% - slight 30
± 4 – 10% - moderate > ± 10% - significantYou can also read