New Zealand Seasonal Fire Danger Outlook 2018/19 - Fire and ...
←
→
Page content transcription
If your browser does not render page correctly, please read the page content below
New Zealand Seasonal Fire Danger Outlook 2018/19
ISSUE: South Island, February 2019
Current fire danger situation & outlook: February is typically the hottest time of the year for many regions and
On average, Very High to Extreme fire dangers and fire climate severity near average temperatures are expected (above 25 degrees). Expect
currently exist in Nelson, Tasman, Marlborough, Canterbury (North and a continuation of warm humid days, but not to the same degree that
South) and Otago (Queenstown Lakes and Central Otago), with Low to was experienced in January. Some relief is forecast in the middle of the
Moderate in remaining areas (Figures 1 & 5). This is also reflected in month, with low pressure making an appearance that may bring better
the current FWI System codes and indices, where high values indicate odds for rainfall. Over the next three months, there is an increased
that fuel moistures are low (Figures 5 & 7). Very High and Extreme DC chance of heavy rainfall for northern parts of the South Island.
and DMC values exist in parts of Nelson, Marlborough, Canterbury
and Central Otago, indicating that medium and heavy fuels and deep The fire season years of 2001/02 (neutral), 2004/05 and 2006/07 (weak
organic layers are dry and available for combustion. El Niño) are possible indicators for what to expect this fire season
(Figure 9). With warmer and drier conditions expected for February,
In the South, soils continue to dry out, especially in northern and eastern vegetation and soil moisture levels will continue to dry out, further
areas (Figure 3). Small improvements were observed in Southland and elevating the fire risk and contributing to deeper burning, and potentially
Stewart Island. However, very dry soils are located in Nelson, Tasman, faster moving fires.
Marlborough, northern Hurunui district, parts of mid Canterbury and the
Mackenzie district. The driest soils for this time of the year are found in In general, fire danger and fire climate severity are expected to peak in
the Buller and Tasman districts (Figure 4). Soils were about normal for February and March for northern and eastern locations, and potentially
much of the country, and wetter than normal for Oamaru, Invercargill, extend into April/May for Marlborough and Otago (Figures 1, 6 & 8). Fire
and Stewart Island. dangers are expected to be Low to Moderate for western and southern
areas. Based on current soil moisture status and the FWI codes and
The ENSO (El Niño–Southern Oscillation) index remains at neutral indices, specific areas to watch are: Nelson, western locations of
levels, and neutral conditions are likely for the immediate future. The Tasman and Buller districts, coastal and inland areas of North and
ENSO Outlook has been downgraded from El Niño ALERT to WATCH Mid Canterbury, Mackenzie district, and Otago (Queenstown Lakes &
as the Tropical Pacific waters began to cool over January. Above Central Otago). However, any heavy rainfall (especially for northern
average Sea Surface Temperatures (SSTs) are forecast around New locations) may reduce the fire dangers and severity in those regions.
Zealand for the next three months (February to April). These SSTs will With very dry soils across northern and eastern locations, rainfall is less
likely be the driver behind New Zealand’s weather over the next few easily absorbed into the ground; this will also increase the possibility of
months. flooding if these regions experience heavy rainfall.
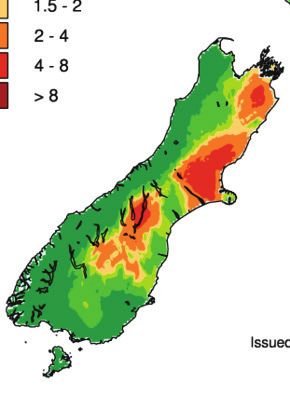
Low
Moderate
High
Very high
Extreme
February 2007 February 2005
January 2019
Figure 1. Monthly average Severity Rating for: current (left);
and during the 2006/07 (middle) & 2004/05 (right) Neutral years followed by a weak El Niño.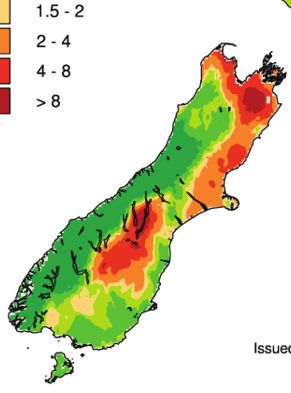
EXPECTED CLIMATE OUTLOOK:                                             forecast to be above average for all regions. Rainfall
                                                                      totals are predicted to be above or near normal in the
One of the major climate drivers for New Zealand is the               north, and near normal for the remaining locations. Soil
El Niño–Southern Oscillation (ENSO). The ENSO index                   moistures are forecast to be below normal in the north
remains at neutral levels, and ENSO-neutral conditions                and west of the island, and below or near normal in the
are likely to remain for the immediate future. Most climate           east of the Island. Near normal or below normal river
models indicate the risk of El Niño has passed and it is              flows are expected in the north, and near normal for the
very unlikely the ocean and atmosphere will couple in                 remaining regions.
the next three months. Atmospheric indicators such as
cloudiness, trade winds and the Southern Oscillation                  Note: the outlook for the next three months indicates drier
Index all continue to generally remain within the ENSO-               than normal conditions in the north of the South Island,
neutral range. The Sea Surface Temperatures (SSTs)                    however there is also an increased chance of heavy
around the Tropical Pacific remain warmer than average                rainfall for the north of the South Island (Tasman, Nelson,
but have begun to cool towards ENSO-neutral values                    Marlborough, Buller) if the Tasman Sea and sub-tropics
during January 2019.                                                  in the north become active.
The ENSO outlook has been downgraded to El Niño
WATCH. International climate models for the next three                Regional breakdown (Figure 2):
months (February to April) predict a 74% chance of                    Temperatures are most likely to be:
oceanic El Niño conditions. The probability decreases                 • above average (50% chance) for Tasman, Nelson,
further for autumn (66%) and over winter (48%).                          Marlborough, Buller, West Coast, Alps and foothills,
Interestingly, long range models indicate the potential for              coastal Canterbury and east Otago, inland Otago
a protracted El Niño event, where above average SSTs                     and Southland.
remain above average for more than a year.
                                                                      Rainfall totals are most likely to be:
ENSO is just one of several climate drivers that can                  • near normal (45% chance) for Tasman, Nelson,
influence New Zealand’s rainfall and temperature                         Marlborough, Buller, coastal Canterbury and east
patterns. Over the next three months there is the                        Otago;
increased chance of variability in the summer weather                 • near normal (40%) or above normal (35%) for the
over New Zealand. In January, coastal waters around                      West Coast, Alps and foothills, inland Otago and
New Zealand remained much warmer than average.                           Southland.
Above average SSTs are forecast for the next three
months (February to April). These SSTs will likely be the
driver behind New Zealand’s weather over the next few                 Soil moisture levels are most likely to be:
months. As we approach Autumn, expect a continuation                  • below normal (40% chance) or near normal (40%)
of warm humid days and low-pressure systems making                        soil moistures for Tasman, Nelson, Marlborough,
an appearance.                                                            Buller, West Coast, Alps and foothills, inland Otago
                                                                          and Southland;
                                                                      • near normal river flows for Tasman, Nelson,
                                                                          Marlborough and Buller (45%), and for the West
This month: February 2019                                                 Coast, Alps and foothills, inland Otago and Southland
High pressure will remain dominant for the first week,                    (40%);
with a shift to low pressure in the second and third                  • near normal (45-50% chance) soil moisture and river
weeks. Westerly winds may make an appearance in                           flows for Coastal Canterbury and east Otago.
the last week of the month. More rainfall is expected
(compared to January), with near average rainfall and
temperatures predicted for this month. Note January’s                 Last month: January 2019
temperatures will likely exceed February due to the heat
wave experienced last month. However, with February                   Looking back, January was a sunny month for many,
typically the hottest month of the year, ‘near average’               dominated by high pressure and relatively dry south
temperatures can still yield days over 25 degrees.                    westerly winds. This combination resulted in very hot
                                                                      and dry January across the South Island, including
                                                                      Nelson, Buller, Marlborough and Christchurch. The far
                                                                      south received useful rainfall near the end of the month
Further ahead: February - April (Figure 2)                            with the odd cold front passing. Warm air from Australia
For the next three months (February – April 2019),                    created strong Foehn winds and hot temperatures for
slightly higher pressures than normal are forecast in the             eastern locations. A 5-day heatwave was recorded in
south, and lower pressure than normal in the north of                 Marlborough and parts of Canterbury.
the country. Weak easterly wind flows across the country
are also expected. The country will likely continue to
experience warm humid conditions as temperatures are

 Figure 2. Outlook for Feb - April 2019: air temperature (left), rainfall (middle), available soil moisture (right). Source: NIWA.

page: 2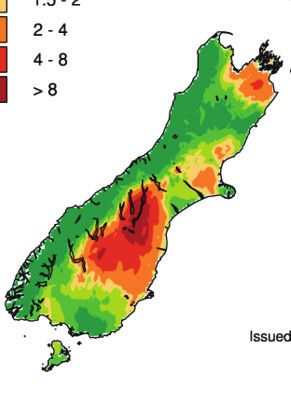
Soil moisture (Figure 3 & 4)                                  What would Neutral mean for New Zealand?
In the South Island, soil moisture levels continued to        Neutral conditions encourage far more variability in
decrease across northern and eastern areas (Figure 3).        weather patterns for New Zealand, whereas El Niño or
Very dry soils are found in Nelson, Tasman, Marlborough,      La Niña tend to have more predictable patterns. Neutral
coastal North and South Canterbury, and Otago                 weather patterns can lead to some extreme conditions –
(Queenstown Lakes and Central Otago) (Figure 3). Much         with snow following record-breaking warm temperatures,
of the West Coast is close to, or at field surplus, the       and an increase number of fires on week followed by
exception being the Buller and Tasman districts with dry      gale force winds and floods the next.
soils.
The soil moisture anomaly map (Figure 4) shows that           Although ENSO events have an important influence on
soils are much drier than normal in the Tasman & Buller       New Zealand’s climate, it accounts for less than 25%
districts, and slightly drier than normal in Marlborough      of the year to year variance in seasonal rainfall and
and Canterbury (North and South). In contrast, eastern        temperature. Under Neutral conditions, other climate
Otago (Oamaru), Invercargill, and Stewart Island are now      factors play stronger roles in influencing New Zealand’s
wetter than normal.                                           weather. For the next three months, the warmer than
                                                              normal coastal water temperatures will be a key driver of
                                                              our weather.
Fire Codes and Indices:
Although BUIs may seem below levels considered
extreme, dry fine fuels under forest canopies or
scrublands, and grass pastures as they brown off, can
still contribute to fast fire spread and larger fire sizes,
even under moderate soil moisture dryness and wind
strengths. If a heat source is present in fine fuels with a
FFMC of 86 or more, or grass curing over 80%, ignition
will be easy, and a fire can still spread.

Grass growth:
As summer progresses, grasses continue to dry out
and start appearing straw coloured. As grasses cure,
the amount of dead material increases, heightening the
potential for fire to ignite and spread. When grasses cure
and fuel moisture content decreases, there is less heat
required to ignite the grass. As a result, more heat is
released as it combusts. Burning under these conditions
can produce larger flame heights (2 m+), and fires can
spread quickly, be very intense and much more difficult to
suppress.
                                                              Figure 3. Soil moisture deficits as of 03/02/2019.
                                                              Source: NIWA.
Depending on where you are in the country, some
landscapes may already have started to form a mixture         Note: Soil moisture deficit means the amount of water needed to bring the
of green and yellow/brown as grasses begin the curing         soil moisture content back to field capacity, which is the maximum amount
phase. Grass curing over a landscape is most likely to be     of water the soil can hold.
patchy over a series of paddocks/areas, especially during
the 40-80% curing period. Curing can also be patchier
with variations due to topography and species type.
In some areas, curing can become more continuous.
Above 80% curing, grass fuel moisture content begins to
be significantly influenced by the environmental factors
(humidity and temperature and wind speed).

For some parts of the country still undergoing bouts of
rainfall, it’s not uncommon to see green grass growth
under the dry vegetation. This can help reduce or halt a
fire’s spread (depending on the amount). However, fires
will still race through this “thatch”, or along the tops in
places experiencing a dense/continuous top cover of dry
grass.

Any burning in low grass curing areas will produce small
flame heights and low intensities for easy suppression.
Now is the time to be prepared as there can be an
increased risk of grass fires for some areas, especially
those areas experiencing abundant grass growth.

In some areas, the presence of dead matted material
from the previous season’s growth (thatch) can contribute
to the ease of a fire starting and spreading. The material
is often hidden underneath lush green grass that appears      Figure 4. Soil moisture anomaly as of 03/02/2019.
to have low curing (30 - 50%). However, thatch can
increase a fires ability to sustain and carry a fire. These   Source: NIWA.
fires will typically produce small flame heights and spread   Note: Soil moisture anomaly means the difference between the historical
in a patchy manner.                                           normal soil moisture deficit (or surplus) for a given time of year and actual
                                                              soil moisture deficits.

                                                                                                                                    page: 3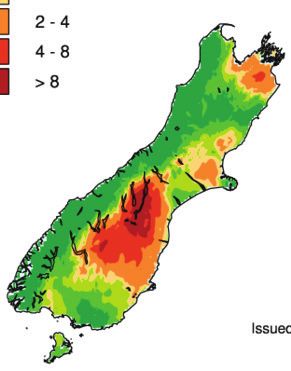
FWI values
Low
Moderate
High
Very high
Extreme
January 2019 February 2007 February 2005
BUI values
Low
Moderate
High
Very high
Extreme
January 2019 February 2007 February 2005
ISI values
Low
Moderate
High
Very high
Extreme
January 2019 February 2007 February 2005
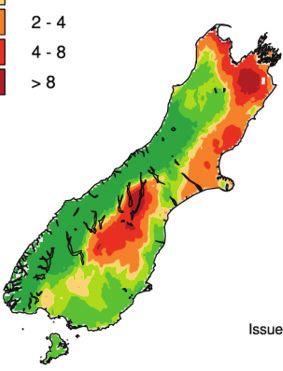
Figure 5. Current Monthly Average for the: Figure 6. Average Monthly values of: Fire Weather Index (top), Buildup Index (middle) and
Fire Weather Index (top), Buildup Index Initial Spread Index (below); and during the 2006/07 (left) & 2004/05 Neutral year followed
(middle) and Initial Spread Index (below). by a weak El Niño (right).
page: 4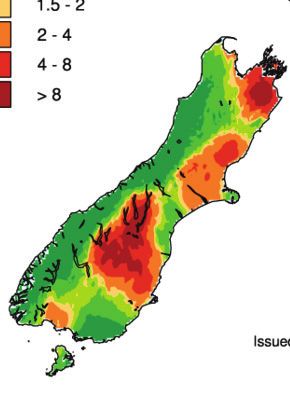
DC values
     Low
Moderate
    High
Very high
 Extreme

                    January
                    December2019
                              2018                               February 2007                                February 2005

DMC values
     Low
Moderate
    High
Very high
 Extreme

                   January 2019                                  February 2007                               February 2005

FFMC values
     Low
Moderate
    High
Very high
 Extreme

                   January 2019                                  February 2007                                February 2005

Figure 7. Current monthly average for the:   Figure 8. Average monthly values of: Drought Code (top), Duff Moisture Code (middle) and
Drought Code (top), Duff Moisture Code       Fine Fuel Moisture Code (below); and during the 2006/07 (left) & 2004/05 Neutral year
(middle) and the Fine Fuel Moisture Code     followed by a weak El Niño (right).
(below).
                                                                                                                          page: 5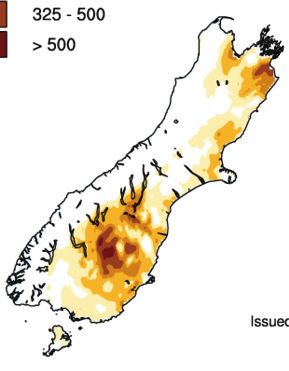
September   October   November   December   January   February   March                April                      May

page: 6
          2004 - 2005
          2006 - 2007
          2001- 2002
                                                                                                 Figure 9. New Zealand Fire Season
                                                                                                 Severity (monthly)
                                                                                                 The years of 2004/05 and 2006/07 were Neutral
                                                                                                 years followed by a weak El Niño phase, and are
                                                                                                 ideal comparisons for what New Zealand might
                                                                                                 experience over the next few months. DSR values
                                                                                                 of less than one equate to low fire behaviour
                                                                                                 potential, 1-3 moderate fire potential, 3-7 high to

          2018 - 2019
                                                                                                 very high fire potential, and above 7 extreme fire
                                                                                                 behaviour potential.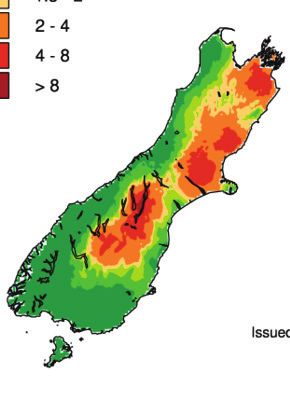
Note:
 The purpose of these monthly outlooks is to provide              Tracking trends
 a heads up on the progression of fire danger as                  Comparisons of fire dangers for individual indicator
 we transition from spring to summer and, later, into             stations for different regions are not shown in this
 autumn. It aims to forewarn fire agencies of current             outlook due to the low fire danger and severity across
 and potential fire danger conditions that can be used            the country. As fire dangers increase, more detailed
 as a prompt for local and regional discussions on fire           regional outlooks will recommence highlighting where
 potential (which depends on fuel conditions (i.e. grass          Buildup Index (BUI), Drought Code (DC) and Cumula-
 curing), risks of ignitions, recent fire history and fire        tive Daily Severity Rating (CDSR) values sit in com-
 management resources available in an area, as well as            parison with previous fire seasons.
 climate and fire weather).
                                                                  For those who are interested in tracking fire season
 Continue your pre-planning (if you haven’t done so               trends for all your weather stations, the graphs are still
 already), by discussing where conditions are at where            available monthly on the Scion Rural Fire Research
 they are heading, and how this can drive awareness               website. If tracking on a more frequent basis (as
 about what this might mean in your patch and for your            opposed to the monthly analysis done here), you can
 neighbours.                                                      contact Scion for the data.

Background info on FWI codes and indicies:
                                                                                    Drought Code (DC) A rating of the average
Fine Fuel Moisture Code (FFMC)           Duff Moisture Code (DMC) A rating of the   moisture content of deep, compact,
An indicator of the relevant ease of average moisture content of loosely            organic soil layers, and a useful
ignition and flammability of fine fuels. compacted organic soil layers (duff/       indicator of seasonal drought effects on
                                         humus) of moderate depth, and              forest fuels and amount of smouldering
 0 - 74       Difficult                  medium-sized woody material                in deep duff layers and large logs.
75 - 84      Moderately easy              0 - 10      Little mopup needs             0 - 100        Little mopup needs
85 - 88      Easy                         11 - 20     Moderate                       101 - 175      Moderate
89 - 91      Very easy                    21 - 30     Difficult                      176 - 250      Difficult
92 +         Extreme easy                 31 - 40     Difficult & extended           251 - 300      Difficult & extended
                                          41 +        Difficult & extensive          301 +          Difficult & extensive

Buildup Index (BUI)                     Initial Spread Index (ISI) Combines the       Fire Weather Index (FWI)
Combines the DMC and DC, and            effect of wind speed and the FFMC,            Combines the ISI and BUI to indicate
represents the total amount of          providing a numerical rating of               the potential head fire intensity of a
fuel available for combustion.          potential fire spread rate.                   spreading fire (on level terrain).
 0 - 15      Easy control                0-3          Slow rate of spread               0-5           Low fire intensity
16 - 30      Not difficult               4-7          Moderate fast                    6 - 12         Moderate
31 - 45      Difficult                   8 - 12       Fast
                                                                                       13 - 20        High
46 - 59      Very difficult              13 - 15      Very fast
                                                                                       21 - 29        Very High
 60 +        Extremely difficult         16 +         Extremely fast
                                                                                        30 +          Extreme

Daily Severity Rating (DSR) A numerical rating of the daily fire weather severity at a
particular station, based on the FWI. It indicates the increasing amount of work
and difficulty of controlling a fire as fire intensity increases. The DSR can be
                                                                                       0-1       Low fire behaviour potential
averaged over any period to provide monthly or seasonal severity ratings.
                                                                                       1-3       Moderate fire potential
Monthly Severity Rating (MSR) is the average of the DSR values over the month.      3-7          High to very high fire potential
DSR and MSR captures the effects of both wind and fuel dryness on potential 7 +                  Extreme fire behaviour potential
fire intensity, and therefore control difficulty and the amount of work required to
suppress a fire. It allows for comparison of the severity of fire weather from one
year to another.

Acknowledgements:                                                   Front Cover Image:
Fire Danger interpretation was from information gathered from
the Average Monthly Maps for: Severity Rating, FWI, BUI, ISI,       2017 Burn off, Clyde (V Clifford, Scion).
DC, DMC, FFMC. These maps were obtained from the Fire and
Emergency New Zealand’s Fire Weather System powered by Eco
Connect.                                                            If you are keen to submit a weather and fire related photo
Information on the Expected Climate Outlook was gathered from:      that will appear on the front page, please email:
•    MetService, Rural Monthly outlooks:                            •    a high resolution image(s)
     www.metservice.com/rural/monthly-outlook                       •    with details on the location and the photographer’s
•    NIWA, Seasonal Climate outlook:                                     name and organisation
     www.niwa.co.nz/climate/sco                                     •    to: Veronica.Clifford@scionresearch.com
•    Australian Bureau of Meteorology Climate outlooks
     http://www.bom.gov.au/climate/ahead/?ref=ftr

                                                                                                                            page: 7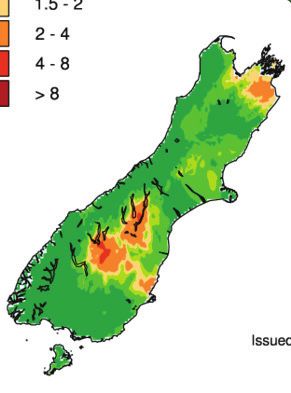
You can also read