New Zealand Seasonal Fire Danger Outlook 2017/18 - Fire and ...
←
→
Page content transcription
If your browser does not render page correctly, please read the page content below
New Zealand Seasonal Fire Danger Outlook 2017/18
ISSUE: North Island, October 2017

Current fire danger situation & outlook:
Low fire climate severities currently exist in most areas of the North        easterly winds and sub-tropical lows frequent New Zealand, and can
Island (Figure 1), the exception being the Hawkes Bay region which is         result in heavy rain and flooding. Northern and eastern parts of New
experiencing moderate fire climate severity. The current FWI System           Zealand are wetter than normal, and the south and west of the country
codes and indices indicate that fuel dryness is low, and at similar levels    tend to be drier.
to the same time last year (Figures 5-6 & 7-8). These low fire dangers
across the North Island are the result of the significant rainfalls that      The outlook for October is for more settled weather, with high pressure
have occurred over the past few months. The exception being the East          systems forecast to return to New Zealand. A drier than normal October
Coast (in particular, Gisborne and Hawkes Bay), which is experiencing,        is predicted for the south and west of the North Island. Northern
on average, moderate fire danger levels. Generally, a fire would likely       and eastern regions will have closer to normal October rainfall.
start, but have difficulty spreading and be relatively easy to suppress.      Temperatures are expected to be warmer than normal across New
                                                                              Zealand. However, cold southerly changes and cooler mornings will still
September was an unsettled and wet month for most regions, except             make the odd appearance.
for the Hawkes Bay. Low pressure systems dominated the weather
map and frequent north-westerly winds affected the North Island. This         Fire dangers and severity for October are expected to be low for most
resulted in extremely wet conditions and, as a result, soil moisture levels   of the North Island (Figures 1 & 9). Spring has brought plenty of wet
across much of the North Island are currently at or near capacity for this    and windy weather. As we approach the summer months, the weeks
time of the year (Figure 3). The exceptions again being the East Coast        ahead will become drier and warmer for many, and fire dangers will
(Gisborne and Hawkes Bay) that are about 50% capacity. Soil moisture          typically creep up in October and November, especially in eastern
levels are considered normal for most parts of the North Island (Figure       areas. However, major rain events will keep the fire danger and severity
4). Hawkes Bay is experiencing slightly drier than normal soils for this      generally low. The fire season years of 2008/09 and 2013/14 are
time of the year.                                                             potentially good indicators for what to expect this coming fire season
                                                                              (Figure 9). There are no specific areas of the Island to watch this month
The El Niño–Southern Oscillation (ENSO) still remains neutral; however        for very high to extreme fire potential. However, eastern areas will be
international guidance is split between La Niña and neutral conditions        ones to watch in November.
approaching the end of 2017 and into March 2018. MetService and
NIWA climatologists are continuing to monitor climate indicators in
the tropical Pacific Ocean for any significant developments. La Niña          Note: Detailed analyses of fire dangers for individual regions have not been
                                                                              shown due to the current low fire dangers across the country. As fire dangers
conditions can impact our summer weather. Typically a developing La           increase, more detailed regional outlooks will recommence.
Niña brings a wetter and cooler spring/summer for many. More north-

                 September 2017                                   October 2016                                       October 2008

Figure 1. Monthly average Severity Rating for: current (left), last year (middle), and the 2008/09 Neutral year (right).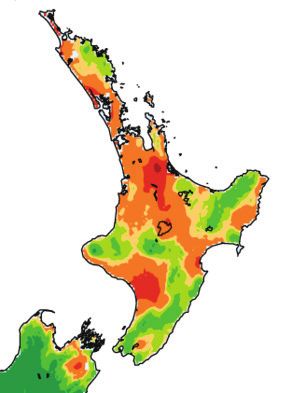
EXPECTED CLIMATE OUTLOOK:
The ENSO (El Niño–Southern Oscillation) still remains Breakdown (Figure 2):
neutral. However climatologists observed La Niña-like Temperatures are most likely to be:
signals in sea surface temperatures in the tropical Pacific • above average (60% chance) for Northland,
Ocean during September 2017. Other indicators of Auckland, Waikato, Bay of Plenty, Central North
ENSO (Southern Oscillation Index (SOI), trade winds and Island, Taranaki, Whanganui, Manawatu, Wellington,
atmospheric anomalies in the tropical Pacific) are also Gisborne, Hawkes Bay & Wairarapa.
leaning towards the La Niña side of neutral.
Rainfall is most likely to be:
International climate models are split between La Niña • above normal (40% chance) or near normal (35%
and neutral conditions forecasted from now to March chance) for Northland, Auckland, Waikato & Bay of
2018. There is very little chance of an El Niño developing Plenty.
through this period. If a La Niña does occur, it is likely to • near normal (45% chance) for Central North Island,
be short-lived (easing during the first quarter of 2018). Taranaki, Whanganui, Manawatu, Wellington,
Gisborne, Hawkes Bay & Wairarapa.
Coastal waters remain generally warmer than average
around the country, and are warmer than average around Soil moistures are most likely to be:
the Chatham Islands and south of New Zealand. These • above normal (40% chance) or near normal (35%
warmer than average seas are likely to persist during chance) for Northland, Auckland, Waikato, Bay of
October – December. In the short-term, high pressure Plenty, Central North Island, Taranaki, Whanganui,
systems will affect October weather patterns for New Manawatu & Wellington.
Zealand. • near normal (45% chance) for Gisborne, Hawkes
Bay & Wairarapa.
This month: October 2017
A warmer than usual October is predicted right across
the country. Highs are signalled to return to New Zealand
and favour both Islands equally. Fronts and lows will be Last month: September 2017
less frequent than usual. A drier than normal October So far, the country has had an unusual number of
is forecast for the south and west of the North Island. wet easterly events for spring. An active Tasman Sea
Northern and eastern areas will have closer to normal produced deep low pressure systems that relocated
October rainfall onto New Zealand. This has resulted in extremely wet
conditions for most regions, except for the Hawkes Bay.
October temperatures are forecast to be warmer than Numerous north-westerlies and wet easterlies have
normal across New Zealand. Expect to see the odd cold resulted in many regions receiving more than their usual
southerly changes and some cooler mornings. amount of rain.
Rainfall records have been broken for a number of
Further ahead: October 2017 - December 2017 areas of the North Island (including Te Puke, Hamilton,
For the next three months (October – December), we are Rotorua, & Taupo). Rainfalls in Northland, Auckland
expecting continuation of more lower pressure systems and Coromandel, and between New Plymouth and the
than normal for the north-west of New Zealand, and Kapiti Coast, were 110 to 140 percent of normal monthly
higher pressures than normal for the south and east totals in these regions. Bay of Plenty, Waikato and the
of the country. This will typically result in more north- Gisborne region experienced at least 150 percent of
easterly winds, bringing subtropical moisture towards normal rainfall. Hamilton and Tauranga both recorded
New Zealand and possible heavy rainfall. around double normal September rainfall amounts.
Pukekohe, Gisborne, Ohakune and the Manawatu were
We expect to see near normal or above normal rainfall for also extremely wet.
the northern North Island, and normal rainfall elsewhere.
Soil moisture levels are predicted to be normal or above Spring temperatures across the North Island were
normal for the North Island. generally average to above average, but there have
been wide ranges of warm and cool periods during
Above normal temperature are forecasted for the entire September.
country. Nevertheless, frosts and cool snaps are still
possible during spring.
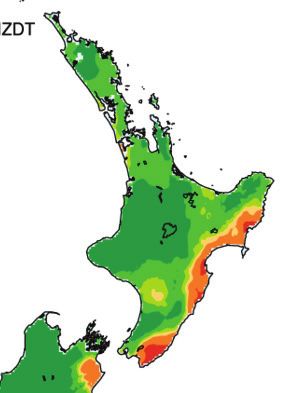
Figure 2. Outlook for Oct - Dec 2017: air temperature (left), rainfall (middle), available soil moisture (right). Source: NIWA.
page: 2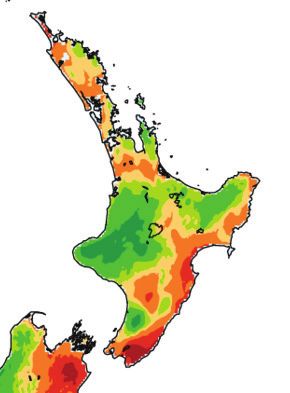
Grass growth:
Climatic conditions during early spring have favoured
good grass growth (mild temperatures and high soil
moistures), resulting in green lush landscapes for this                                                       October (2017)
time of the year. Normally, if a fire started in these
fuels, fire spread would be difficult. Any burning will
produce small flame heights and low intensities for easy
suppression.

In some areas, the presence of dead matted material
from the previous season’s growth (thatch) can contribute
to the ease of a fire starting and spreading. This material
is often hidden underneath lush green grass that appears
to have low curing (30 - 50%). However, thatch can
increase the ability of grass fuels to carry and sustain a
fire. These fires will typically produce small flame heights
and spread in a patchy manner.

What does Neutral mean for New Zealand?
                                                               Figure 3. Soil moisture deficits as of 0110/2017.
The El Niño-Southern Oscillation (ENSO) is a key natural       Source: NIWA.
cycle influencing New Zealand’s climate. It operates over
the Pacific Ocean and beyond, and causes fluctuations          Note: Soil moisture deficit means the amount of water needed to bring the
in the prevailing trade winds and in the strength of the       soil moisture content back to field capacity, which is the maximum amount
                                                               of water the soil can hold.
subtropical high-pressure belt. Although ENSO events
have an important influence on New Zealand’s climate,
they still only account for less than 25% of the year to
year variance in seasonal rainfall and temperature.

When neither El Niño nor La Niña are present, weather
patterns are said to be in a “neutral” or normal state.
Neutral conditions encourage far more variability in
weather patterns for New Zealand, whereas El Niño or La
Niña tend to have more predictable patterns.

Neutral springs can lead to some extreme weather
events for New Zealand, with snow storms one week
followed by record-breaking warm temperatures, and
floods the next. October can still provide frosts and
random snow events. Then, typically by November, the
weather patterns will switch to mild and drier conditions,
with westerlies fading as we head towards summer

What would La Niña mean for New Zealand?
                                                               Figure 4. Soil moisture anomaly as of 01/10/2017.
La Niña tends to warm the ocean surrounding New                Source: NIWA.
Zealand, which encourages frequent lows and sub-
tropical storms for the north, occasionally stretching down    Note: Soil moisture anomaly means the difference between the
as far as Canterbury. During a La Niña, north-easterly         historical normal soil moisture deficit (or surplus) for a given time of year
                                                               and actual soil moisture deficits.
and easterly winds are more frequent, resulting in the risk
of heavy rain and flooding.
                                                               The intention of these monthly outlooks is to provide a heads
New Zealand is typically warmer than average during            up on current and potential fire danger for the North and South
a La Niña, although there are regional and seasonal            Islands. This is not a detailed fire seasonal outlook for specific
exceptions. La Niña typically brings more storms, clouds,      localities, nor does it summarise fire potential (which depends
humidity and rain to the north and east of New Zealand.        on weather, climate, fuel conditions (i.e. grass curing), risks of
The south and west of the country tends to dry out and         ignitions, recent fire history and fire management resources
have spectacular summers. Eastern areas are typically          available in an area.
cloudier, cooler and wetter over spring and summer.            It should be used as a prompt for local and regional discussions/
                                                               debates on fire potential, and where things are at, where it is
                                                               heading, and to drive awareness about what this might mean in
                                                               your patch and for your neighbours.

                                                                                                                                    page: 3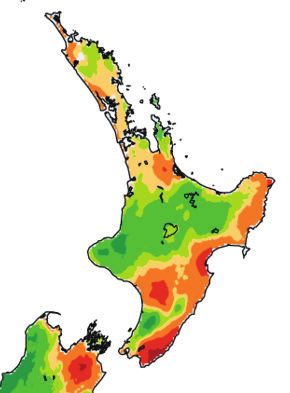
Tracking trends in BUI, DC and CDSR:
Comparisons of fire dangers for individual indicator stations for different regions are not shown overleaf due to the low fire
danger and severity across the country. As fire dangers increase, more detailed regional outlooks will recommence
highlighting where Buildup Index (BUI), Drought Code (DC) and Cumulative Daily Severity Rating (CDSR) values sit in
comparison with previous fire seasons.
The graphs display: • We’ve also colour coded the 2008/09 Neutral year followed
• Bold red line is the current fire season by a weak La Niña season in blue.
• Bold black line is the average • Light orange line is the previous season if the 2008/09 year
• Light grey shaded areas are historical max and mins was not available
Background info on FWI codes and indices:
Fine Fuel Moisture Code (FFMC) Duff Moisture Code (DMC) A rating of the Drought Code (DC) A rating of the average
An indicator of the relevant ease of average moisture content of loosely moisture content of deep, compact,
ignition and flammability of fine fuels. compacted organic soil layers (duff/ organic soil layers, and a useful indicator
humus) of moderate depth, and of seasonal drought effects on forest fuels
medium-sized woody material and amount of smouldering in deep duff
0 - 74 Difficult
layers and large logs.
75 - 84 Moderately easy 0 - 10 Little mopup needs 0 - 100 Little mopup needs
85 - 88 Easy 11 - 20 Moderate 101 - 175 Moderate
89 - 91 Very easy 21 - 30 Difficult 176 - 250 Difficult
92 + Extreme easy 31 - 40 Difficult & extended 251 - 300 Difficult & extended
41 + Difficult & extensive 301 + Difficult & extensive
Buildup Index (BUI) Initial Spread Index (ISI) Combines the Fire Weather Index (FWI)
Combines the DMC and DC, and effect of wind speed and the FFMC, Combines the ISI and BUI to indicate the
represents the total amount of fuel providing a numerical rating of potential potential head fire intensity of a spreading
available for combustion. fire spread rate. fire (on level terrain).
0 - 15 Easy control 0-3 Slow rate of spread
0-5 Low fire intensity
16 - 30 Not difficult 4-7 Moderate fast
6 - 12 Moderate
31 - 45 Difficult 8 - 12 Fast
13 - 20 High
46 - 59 Very difficult 13 - 15 Very fast
21 - 29 Very High
16 + Extremely fast
60 + Extremely difficult 30 + Extreme
Daily Severity Rating (DSR) A numerical rating of the daily fire weather severity at a
particular station, based on the FWI. It indicates the increasing amount of work
and difficulty of controlling a fire as fire intensity increases. The DSR can be
averaged over any period to provide monthly or seasonal severity ratings. 0-1 Low fire behaviour potential
1-3 Moderate fire potential
Monthly Severity Rating (MSR) is the average of the DSR values over the month. 3-7 High to very high fire potential
DSR and MSR captures the effects of both wind and fuel dryness on potential
fire intensity, and therefore control difficulty and the amount of work required to 7+ Extreme fire behaviour potential
suppress a fire. It allows for comparison of the severity of fire weather from one
year to another.
Acknowledgements:
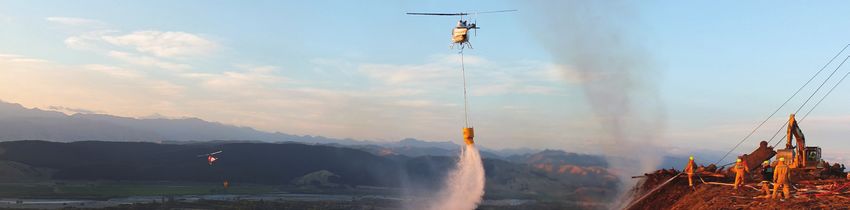
Fire Danger interpretation was from information gathered from the Front Cover Image:
Average Monthly Maps for: Severity Rating, FWI, BUI, ISI, DC, 2014 North Bank wildfire, Marlborough. (John Foley, Fire
DMC, FFMC. These maps were obtained from the National Rural and Emergency New Zealand).
Fire Authority Fire Weather System powered by Eco Connect.
If you are keen to submit a weather and fire related photo
Information on the Expected Climate Outlook was gathered from: that will appear on the front page, please email:
• MetService, Rural Monthly outlooks: • a high resolution image(s)
www.metservice.com/rural/monthly-outlook • with details on the location and the photographer’s
• NIWA, Seasonal Climate outlook: name and organisation.
www.niwa.co.nz/climate/sco • to: Veronica.Clifford@scionresearch.com
• Australian Bureau of Meteorology Climate outlooks
http://www.bom.gov.au/climate/ahead/?ref=ftr
page: 4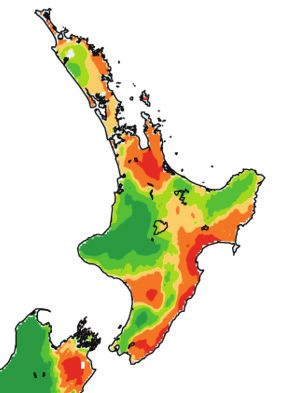
September 2017                             October 2016                                 October 2008

 FWI values

               September 2017                            October 2016                                 October 2008

 BUI values

              September 2017                             October 2016                                 October 2008

 ISI values

Figure 5. Current Monthly Average for the: Fire   Figure 6. Average Monthly values of: Fire Weather Index (top), Buildup Index
Weather Index (top), Buildup Index (middle) and   (middle) and Initial Spread Index (below); for the previous year (left) and during the
Initial Spread Index (below).                     2008/09 Neutral year followed by a weak La Niña year (right).

                                                                                                                              page: 5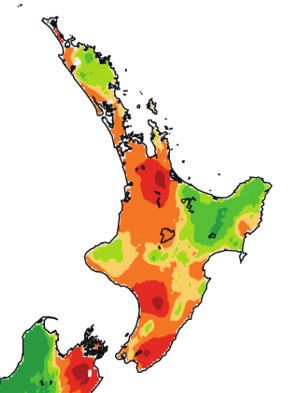
September 2017                            October 2016                                 October 2008

 DC values

               September 2017                            October 2016                                 October 2008

 DMC values

               September 2017                            October 2016                                 October 2008

 FFMC values

Figure 7. Current monthly average for the:        Figure 8. Average monthly values of: Fire Weather Index (top), Buildup Index
Drought Code (top), Duff Moisture Code (middle)   (middle) and Initial Spread Index (below); for the same time last year (left) and
and the Fine Fuel Moisture Code (below).          during the 2008/09 Neutral year followed by a weak La Niña year (right).

 page: 6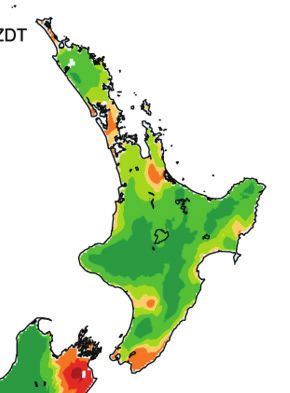
September   October   November   December   January   February        March                       April                       May

          2008 - 2009
          2013 - 2014
          2016 - 2017
                                                                                         Figure 9. New Zealand Fire Season Severity (monthly)
                                                                                         The years 2008/09 and 2013/14 were Neutral years followed by weak
                                                                                         La Niña phase, and are ideal comparisons for what New Zealand might
                                                                                         experience over the next few months.

                                                                                         DSR values of less than one equate to low fire behaviour potential, 1-3
                                                                                         moderate fire potential, 3-7 high to very high fire potential, and above 7
                                                                                         extreme fire behaviour potential.

          2017 - 2018
page: 7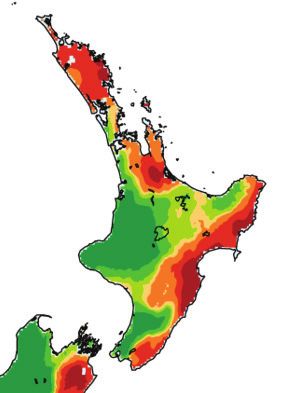
You can also read