Central Indiana July 2021 Climate Summary
←
→
Page content transcription
If your browser does not render page correctly, please read the page content below
Central Indiana
                        July 2021
                    Climate Summary
               Tied 56th Coolest on record at Indianapolis
                 22nd Wettest on record at Indianapolis

Temperatures
July 2021’s near-normal temperatures continued June’s pattern of generally non-anomalous
readings, as the month featured many days slightly above normal with a few, brief cooler
periods under Canadian high pressure. No heat waves occurred per se as persistent rather
humid conditions kept both highs and lows moderated...although consecutive days reaching
the upper 80s were commonly seen. The overall synoptic pattern placed Indiana between the
broad, upper-level ridge over the western US, and a typically troughy set-up to the east.
Several modest deviations from this pattern led to the few warmer/milder periods. After the
month started on a seasonal note, July 2nd-3rd found cooler Canadian air plunging down the
upper Mississippi Valley and into central Indiana. Temperatures ranged in most places from the
mid/upper 50s to only the upper 70s to near 80F, despite ample sun both days. All 1st-order
airports recorded their lowest temperature of the month. The Crawfordsville 6SE COOP site
(Montgomery Co.) dropped to 49F early on the 3rd.

Very warm conditions returned on July 5th-7th, as a large portion of the western ridge broke
down, spilling eastward into the Mid-West. Diurnal ranges near the 90/70 realm were common
for most locations. The Shoals 8S COOP site (Martin Co.) hit 94F on the 6th. Another shot of
milder air entered Indiana on July 9th-11th, courtesy of an upper wave that cut-off from the
Dakotas to the lower Missouri Valley, which provided a rather cloudy, southwest flow aloft.
The New Castle 3SW COOP site’s (Henry Co.) daily maximum temperature only reached the low
70s on both the 9th and 10th. The middle of the month saw rather mundane temperatures –
both from the generally cloudy/rainy conditions seen through the 16th (see below), and then
the weakly troughy-yet-partly sunny combination that followed through the 20th.
Late month then saw the western ridge strengthen while sliding slightly eastward toward
Indiana. The resultant flat upper ridge over Indiana, with a northwest flow from southern
Canada, made for several summery days that did not exceed the mid 80s in most locations. The
month’s most prolonged very warm/hot period then followed for most of July 24th-29th, as the
western ridge built farther east – settling over the Heartland. Excepting brief lower dewpoints
that followed a weak boundary on the 27th, these several days were quite humid while high
temperatures reached the upper 80s to low 90s. The Washington 1W COOP site (Daviess Co.)
had a sultry overnight low of 76F on the 26th, while Shoals 8S rose to 93F on the 29th. The
atmosphere see-sawed yet again to end July, as back-to-back areas of Canadian surface high
pressure first returned temperatures to near normal on the 30th, before unseasonably mild
readings infiltrated the region on the 31st. The temperature was 58F and falling when the
month ended at both Bloomington and Lafayette.
July 2021 July 2021 Highest Lowest
Site Average Temp Dep from Nml Temperature Temperature
Indianapolis Int’l Airport 74.9 -0.9 91 on 26th 56 on 3rd
Lafayette 73.5 -0.1 90 on 29th 50 on 3rd
Muncie 75.4 -0.6 90 on 7th, 25th 56 on 3rd
Terre Haute 75.4 +0.1 90 on 26th, 27th 55 on 3rd
Bloomington 74.7 0.0 91 on 26th 55 on 3rd
Shelbyville 76.0 +0.5 91 on 26th, 27th 57 on 3rd
Indianapolis Eagle Creek 75.8 -0.1 90 on 29th 57 on 2nd
At Indianapolis, July 2021’s daily average temperatures were above normal on 11 days, at
normal on 5 days, and below normal on 15 days. It tied for the 56th coolest July for the
Indianapolis Area since weather records began in 1871.Precipitation July 2021 was wetter than normal for most of central Indiana, although rainfall frequency was near normal. The greatest rainfall events were on the 1st and during the 8th-16th, before a drier second half of the month...although a few locally moderate/heavy rainfalls did occur between the 23rd-29th. The month started wet on the 1st, with a soaking rain through the AM hours for most locations, resulting in a storm total of 4.18” near Martinsville (Morgan Co.), and several other event totals over 3.00” along the Owen-Monroe County line and in Columbus (Bartholomew Co.). Numerous reports of flash flooding over roads and into low-lying areas were received from Frankfort (Clinton Co.) to the west side of Indianapolis; also, a section of Indiana route 32 washed out in eastern Fountain County. Showers and thunderstorms brought rains of 1”+ on July 6th, 7th, and 8th to parts of the region. The 7th saw several reports of 2-3” in central Tippecanoe County, with isolated 1-2” around Muncie, the Indianapolis northwest suburbs and Shoals. On the 8th an impressive 3.18” was recorded southwest of Greensburg (Decatur Co.), while 2.60” was observed near Anderson (Madison Co.), with 1-2” seen across much of the region’s central counties. Minor flooding was reported in southern Madison County. For this 3-day period, most areas totaled around 1-2”. Further showers and storms fell July 10th through 13th. On the 10th, 2.97” was reported near Unionville (Monroe Co.), with 1-2” common across the southeastern half of the region. The 11th brought numerous readings near 1” across north-central counties...before the 12th saw 2.00” near Shepardsville (Vigo Co.), with several 1-2” reports elsewhere, especially from Indianapolis to Kokomo (Howard Co.). A scattering of observed rainfall of up to 1” was seen on the 13th over central and eastern counties. This 4-day period found 1-2” totals for most locales, although isolated 4-day totals over 3.50” were reported in Brown, Monroe and Hamilton Counties. The month’s heaviest rains fell on July 15th and 16th. Through dawn on the 16th, A patch of 2- 2.5” of rain had fallen across Indianapolis’ southern to eastern perimeter, while the highest totals were 2.75” in New Palestine (Hancock Co.) and 2.69” in Brooklyn (Morgan Co.), with 1-2” seen across most of the region. The following 24 hours saw even heavier rainfall totals: 3.92” east of Flat Rock, 3.75” in Tannersville (Jennings Co.), with 2-3” common elsewhere across the southern third of central Indiana, and several observations of 1-2” along northern counties. Reports of flooded roads were received on the 15th from near Flora (Carroll Co.), and on the 16th from Bloomington. Rainfall totals for this 2-day period of 2.5-4” were common along and south of the I-70 corridor. The prolonged mid-month wet period made river flooding inevitable: nearly 30 river sites entered flood stage, starting late on July 16th. Most sites were only in flood between the 17th and 21st, while downriver portions of the East Fork White and White River remained in minor flood stage through the 23rd and 26th, respectively. Flooding also occurred along several non- main stem rivers and creeks, primarily across south-central and southeastern counties, with most of these sites in flood for under 24 hours. However, Amity and Edinburgh (both in Johnson Co.), Walkerville (Shelby Co.), and Rushville (Rush Co.) were in flood for about 48 hours
each. Moderate flood stage was reached on the East Fork White at Seymour for nearly 50
hours from the evening of the 17th to the evening of the 19th. While of noticeably shorter
durations, moderate flood was also reached on the 17th on Beaver Creek at Shoals and the
Driftwood River southwest of Edinburgh (Bartholomew Co.)...and on the 18th on the Little Blue
River at Walkerville.
Organized rains returned with relatively lighter amounts on the 23rd and 24th...although on the
24th, 2.11” was measured on the south side of Terre Haute, with 1-2” across the rest of Vigo
County. On the 29th, the same storm system that spawned two tornadoes (see below), also
brought an extreme rainfall observation of 6.66” east of Flat Rock, and 1.5-2.5” in and around
Columbus. Numerous flooded roads were reported in southern Shelby County and a water
rescue was performed in Hope (Bartholomew Co.). Elsewhere, these pre-frontal rains had
otherwise modest measurements, with only isolated 1-2” reports.
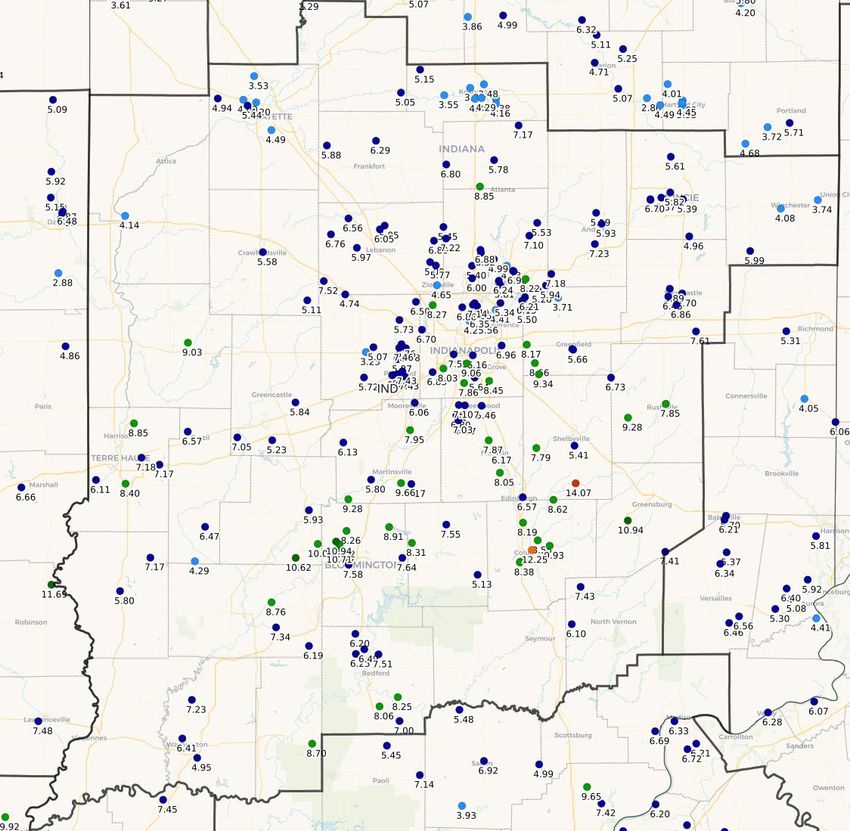
Normal July rainfall totals range from about 3.80 to almost 5.00” across central Indiana. July
2021’s totals continued June 2021’s pattern: encompassing near normal to anomalously high
values...as most locations were 1-4” above normal. Also similar to June 2021’s pattern, there
was a general north-south gradient, with 7-11” common along and south of the I-70 corridor,
while 5-8” totals were the rule to the north. Most anomalous were 12-15” amounts in both
Columbus (Bartholomew Co.) and east of Flat Rock (Shelby Co.), as well as several 10-11”
reports near the Owen-Monroe County line. Howard County once again was the region’s
minimum, with generally 3-5”.
The overall wet month was due more to the several moderate/heavy rain events than any
persistent rainy pattern. This was perhaps most exemplified at Shelbyville where 4 days
recorded 1.00”+ (normal is 1 day), while all other 1st-order airports each tallied 2 such days
(normal being generally 1 day). Terre Haute, Bloomington and Shelbyville reported 6, 5 and 5
days with 0.50”+, respectively (2 days more than normal at each site)...while Muncie totaled
0.10”+ on 11 days (where the normal is only 6). Indianapolis’ year-to-date precipitation total,
29.32” through July 31st, is 1.62” above normal. Looking back at July 2020, Indianapolis’
precipitation was an adequate, yet near-normal 4.90”; July 2021’s sum was 143% of normal.
Site July 2021 July 2021 Wettest Day Longest Dry Stretch
Precipitation Diff. from Normal
Indianapolis Intl AP 6.34 +1.91 2.78 on 1st 6 days, 18-23rd
Lafayette 4.40 +0.32 1.86 on 8th 6 days, 18-23rd
Muncie 5.25 +1.15 1.26 on 16th 5 days, 2-6th & 18-22nd
Terre Haute 6.60 +2.26 1.62 on 25th 5 days, 2-6th
Bloomington 6.68 +1.79 2.32 on 16th 7 days, 18-24th
Shelbyville 7.38 +3.51 2.30 on 16th 6 days, 18-23rd
Indy – Eagle Creek 4.10 -0.19 1.57 on 1st 6 days, 18-23rd
July 2021 was the 22nd wettest for the Indianapolis Area since weather records began in 1871.July 2021 Total Precipitation, Through the Morning of 8/1
As Reported By Central Indiana CoCoRaHS Observers
For the period 700 AM EDT 6/30/2021 -to- 700 AM EDT 8/1/2021. Data is unofficial.
Rainfall totals were greatest along and south of the I-70 corridor, including numerous
anomalously high amounts across several south-central and southeastern counties.Severe Weather
July 2021’s severe weather was technically confined to only four days, yet included a
microburst and two weak tornadoes. Heavy rains led to flash flooding concerns on five days
(see above), three of which were mutually exclusive from severe wind/tornado days. No severe
hail (1.00”+) was reported in central Indiana during the month. July 8th featured several
marginally strong-severe midday to afternoon thunderstorms, ahead of a slowly-approaching
cold front. A microburst left wind damage along a 4-mile path between Homer and Rushville
(Rush Co.). The winds significantly damaged a home’s roof and side wall, destroyed or
damaged several farm out buildings and trees, and blew debris 100 yards to the east. Just as
the microburst diminished, the same storm continued across Rush County, braking power poles
and downing trees in Rushville...before downing large tree limbs and flattening crops near New
Salem. Later in the afternoon a strong storm dropped penny-sized hail (0.75”) near North
Vernon (Jennings Co.).
July 15th’s scattered late day thunderstorms damaged a barn roof in Bringhurst (Carroll Co.) and
downed trees in Quincy (Owen Co.), before the storm’s leading edge intensified while
approaching the Indianapolis area. Trees were downed both near Avon and in Plainfield
(Hendricks Co.), with tree branches downed in Trafalgar (Johnson Co.). Then on the 16th,
several rounds of late day showers and storms included a few strong cells, however, the only
damage report was of small limbs downed by winds in Odon (Daviess Co.).
On the 29th, hot and humid conditions combined with a cold front approaching from the north
to produce several strong to severe storms in the early evening. Shelby County took the brunt
of the more severe weather for not the first time this summer, including two EF-1 tornadoes.
The first tracked 2.5 miles from southeast of Shelbyville to west of Waldron with estimated
peak winds of 90 mph, as it damaged support beams on a porch, knocked down a masonry wall,
snapped an antenna pole, and at times caused widespread tree damage. The second EF-1
tracked for 0.7 miles to the south of Waldron with estimated peak winds of 90 mph, as it made
a narrow but intense swath of tree damage and knocked over several grave stones in the Van
Pelt Cemetery. These events brought central Indiana’s 2021 tornado tally to 4. Other, non-
tornadic, damage in Shelby County included a partially damaged roof in Shelbyville and downed
trees on the east side of Waldron. A separate storm downed a small tree just northeast of
Vincennes (Knox Co.).
For info on severe weather in other areas during July, visit the Storm Prediction Center
“Severe Weather Event Summaries” website at spc.noaa.gov/climo/onlineMiscellaneous
The month’s maximum wind gust at the Indianapolis International Airport was 46 mph (from
the west-northwest) on the 15th, with none of the other 1st-order airports recording any gusts
of 45 mph or greater.
Fog was reported at Indianapolis on 14 days during the month, with no dense fog (visibility ≤1/4
mile). Fog was, however, quite frequent at most 1st-order airports, occurring on at least 24
days at Bloomington, Lafayette, Shelbyville and Terre Haute. Dense fog was most frequent at
Lafayette (8 days), while most common on the 5th, 15th, 16th, 26th and 28th (at 2 sites on each of
these days).
Thunder was reported on 10 days at Indianapolis, and was generally common elsewhere --
occurring on 8 to 10 days at all other 1st-order sites except Lafayette (only 5 days).
Haze from smoke was unusually common over central Indiana, due to upstream forest fires
over both the northwestern US and near the southern Saskatchewan-Manitoba border. While
at least optically-thin haze was occasionally found over much of the region from the 4th
onward...it was not until surface high pressure tracked from south-central Canada into Indiana
on the 21st that widespread smoke then reached the surface. Visibilities dropped to a
persistent 4 to 6 miles during the day and much of the evening. Smoke-based haze continued
to occasionally reduce visibility through the remainder of the month, especially when under the
subsidence of areas of high pressure. Visibility as low as 2 miles was reported in times of calm
winds near Vincennes (Knox Co.) on the 21st, as well as at Indianapolis Eagle Creek early in the
evening on the 23rd.
August 2021 Outlook
The official outlook for August 2021 from the Climate Prediction Center indicates an equal
chance of above, below or near normal temperatures for central Indiana. The normal August
temperature for Indianapolis is 74.7 degrees.
The outlook also indicates a greater chance of above normal precipitation across the region.
The normal August precipitation at Indianapolis is 3.20”.
Data prepared by the Indianapolis Weather Forecast Office’s State Climate Team
Questions should be referred to nws.indianapolis@noaa.govYou can also read