Investor presentation - Securing the Digital Transformation Building a safer world - one app at a time - Investor Relations | Qualys, Inc.
←
→
Page content transcription
If your browser does not render page correctly, please read the page content below
Investor presentation
    Securing the Digital Transformation
 Building a safer world - one app at a time

          Philippe Courtot, Chairman and CEO
                   Melissa Fisher, CFO

                    July 31st, 2019
Safe Harbor
This presentation includes forward-looking statements within the meaning of the federal securities laws. Forward-looking
statements generally relate to future events or our future financial or operating performance. Forward-looking statements in this
presentation include, but are not limited to, the following list:
-   our business and financial performance and expectations for future periods, including the rate of growth of our business and
    market share gains;
-   our ability to sell additional solutions to our customer base and the strength of demand for those solutions;
-   our plans regarding the development of our technology and its expected timing;
-   our expectations regarding the capabilities of our platform and solutions;
-   the anticipated needs of our customers;
-   our strategy, the scalability of our strategy, our ability to execute our strategy and our expectations regarding our market
    position;
-   the expansion of our platform and our delivery of new solutions;
-   the expansion of our partnerships and the related benefits of those partnerships; and
-   our ability to effectively manage our costs
Our expectations and beliefs regarding these matters may not materialize, and actual results in future periods are subject to risks
and uncertainties that could cause actual results to differ materially from those projected. These risks include those set forth in
our filings with the Securities and Exchange Commission, including our latest Form 10-Q and 10-K. The forward-looking
statements in this presentation are based on information available to us as of today, and we disclaim any obligation to update
any forward-looking statements, except as required by law.
We also remind you that this presentation will include a discussion of GAAP and non-GAAP financial measures. The non-GAAP
financial measures are not intended to be considered in isolation or as a substitute for results prepared in accordance with GAAP.
The GAAP financial measures, and a reconciliation of the non-GAAP financial measures discussed in this presentation to the most
directly comparable GAAP financial measures are included in the appendix of this presentation.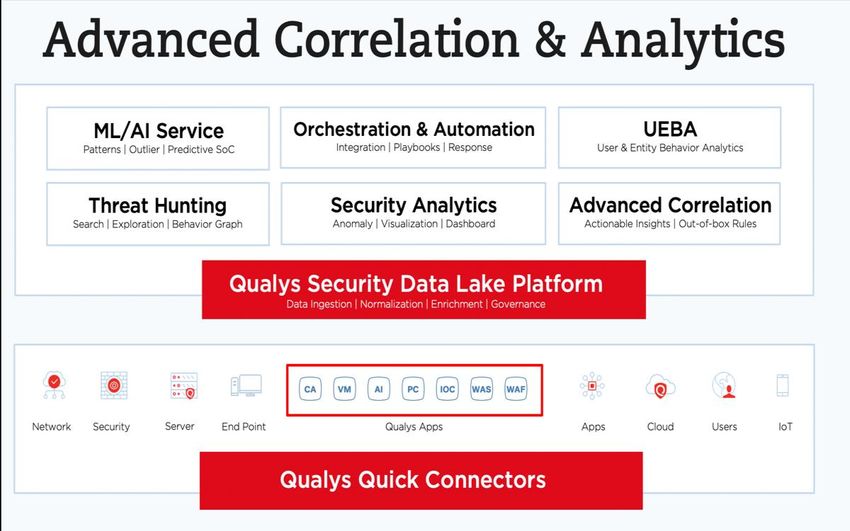
Market and Investment
     Opportunity

The Power of the Qualys Cloud Platform

   One stack to consolidate
   traditional enterprise
   IT/security/compliance
   solutions and secure the
   Digital Transformation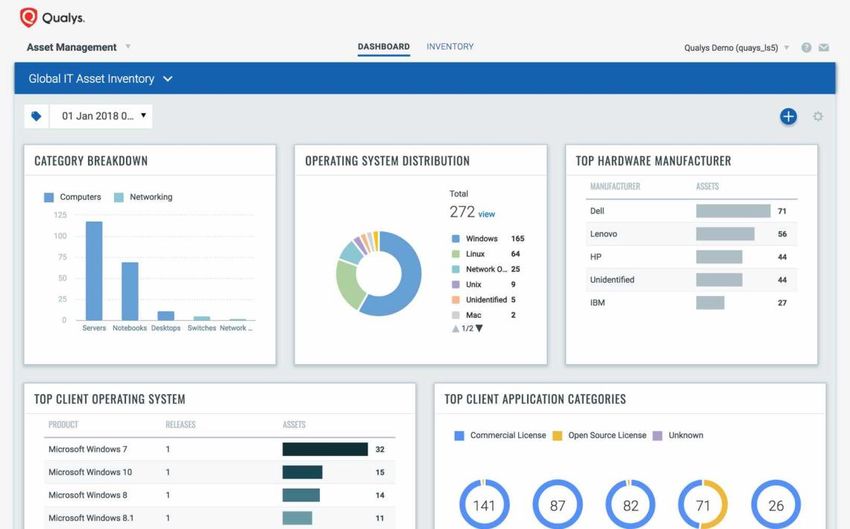
Investment Highlights

Uniquely positioned to capitalize on stack
consolidation and move to the cloud
Multiple levers of recurring revenue growth
Scalable business model and industry-leading
profitability
Industry-leading Cloud Security and Compliance
Platform
Large Expanding Market Opportunity
                   Driven by Increasing Apps on Qualys’ Cloud Platform

                         12%
                        CAGR      $21.3B

                                 $2.8B             IT Asset Management
                                                   Cloud Security
              $12.1B
                                 $10.0B            Endpoint Management (1)
               $1.9B                               Web Security: SaaS (2)

               $5.3B
                                  $0.6B
                                  $0.7B
                                                   Network and Edge
                                  $1.3B

                $0.5B             $2.5B
                                                   Security Policy and Compliance
                $0.5B
                $0.6B
                $1.6B             $1.6B            Vulnerability Assessment: App
                $0.8B
                $0.9B            $1.8B
                                                   Vulnerability Assessment: Device
           CY2016              CY2021E
      Qualys’ current Total Addressable Market

(1) 2017 to 2021E period
(2) 2015 to 2020E period
Source: IDC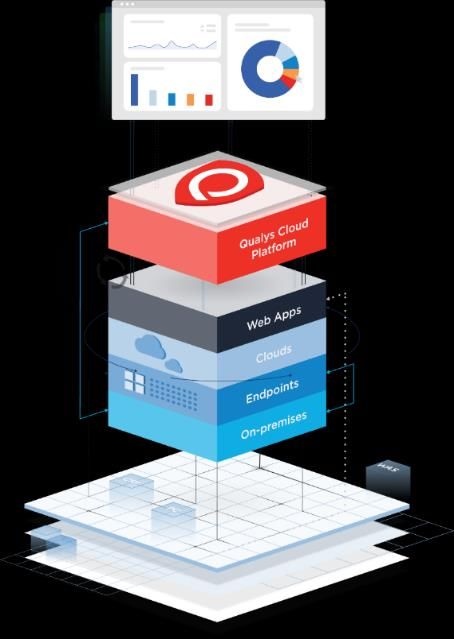
Blue Chip Global Customer Base
                  72% of the Forbes Global 50, 46% of Global 500,
                  and 25% of Global 2000 standardized on Qualys

                                       12,200+ Customers

Note: Customers include active users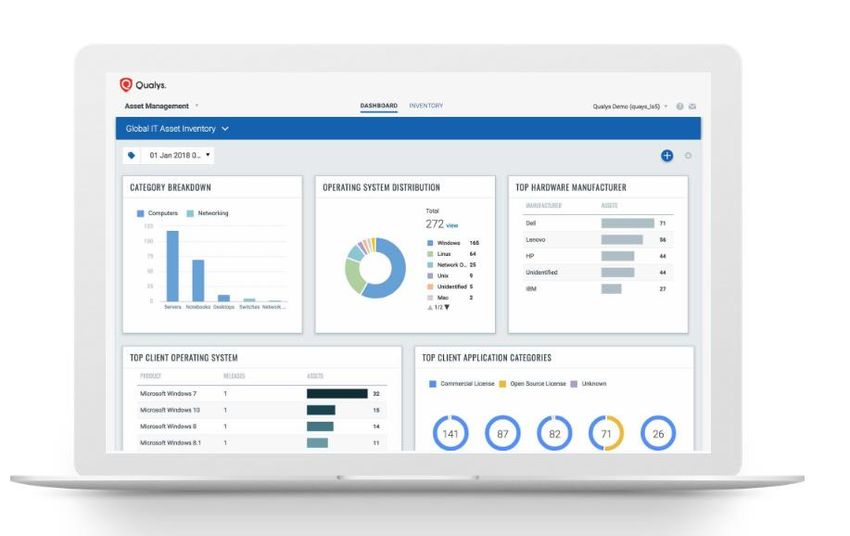
Scalable Go-to-market Model
        Market segmentation & key strategic partners

                                                         2018
     ENTERPRISE                SME & SMB               REVENUES

   Large enterprise       Small / medium business       DIRECT
(Over 5,000 employees)    (Up to 5,000 employees)

                                                         59%
   New       Existing        New        Existing
customers   customers     customers    customers

                                                       CHANNEL

                                                         41%
Attractive Value
               Proposition for Partners
 High-margin recurring revenue with no capex /maintenance costs

                   Outsourcing        VAS
MSSPs Telcos                                         Consultants
                    Providers       Resellers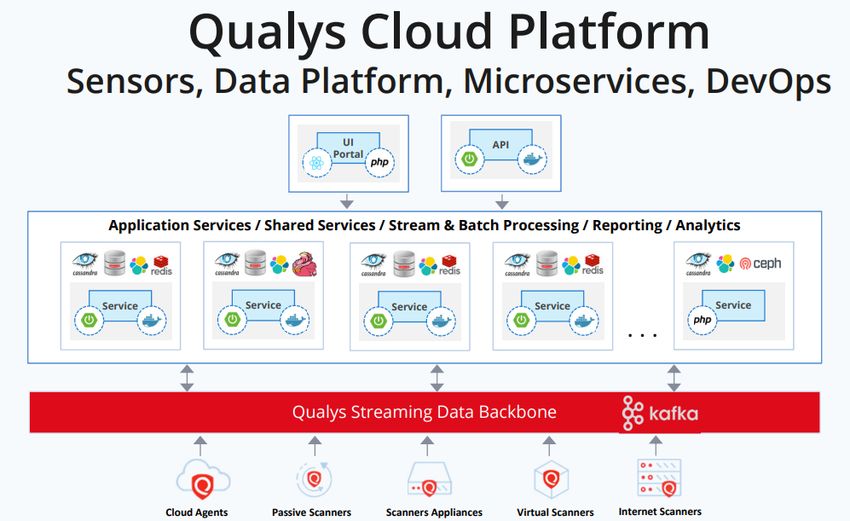
Global Presence

     12,200+                           130+               8               81            48
          Customers                    Countries   Shared Platforms   Private Clouds   Locations

       Qualys’ Shared Platforms
       Qualys’ Locations

Note: Customers include active users
Qualys Cloud Platform and Roadmap
Global Visibility Across Hybrid IT
Environments Enables Superior Security
             Scalable, extensible, self-updating & centrally managed

                 Active Scanners                                            Cloud Agents

    3+ billion                      50,000+                 23.6 million                  2+ trillion
   IP Scans/Audits a Year       Scanner appliances            Cloud Agents across       Security Events collected
                                                           servers, endpoints, clouds          in real-time
                                                                 & containers

 Physical    Virtual     Cloud/      Passive   API                             Cloud Agents
                        Container

                                3+ trillion data points
                        Indexed on Elasticsearch Clusters, giving 2-second visibility
Qualys Cloud Platform
Unified approach to Detection,
Prevention & Response
Integrated Suite of
Applications
Analytics and
Reporting Engines
Distributed
Sensors
Hardware Virtual Cloud Agent Passive API
Environments
On- Endpoints Cloud
PremisesCloud Platform Serves as a Scalable
Distribution Channel
Scalable, Extensible, Micro-services, DevOps
Scanner
VM PC WAS WAF FIM
Service
Qualys Streaming Data Backbone
Cloud
Agent Asset
Service Indexing
Reporting Analytics IOC Tagging
Service
ServiceMicro-Service Architecture
Cloud Platform Enables
Vendor and Stack Consolidation
IT Security
Compliance Monitoring
Web App Security
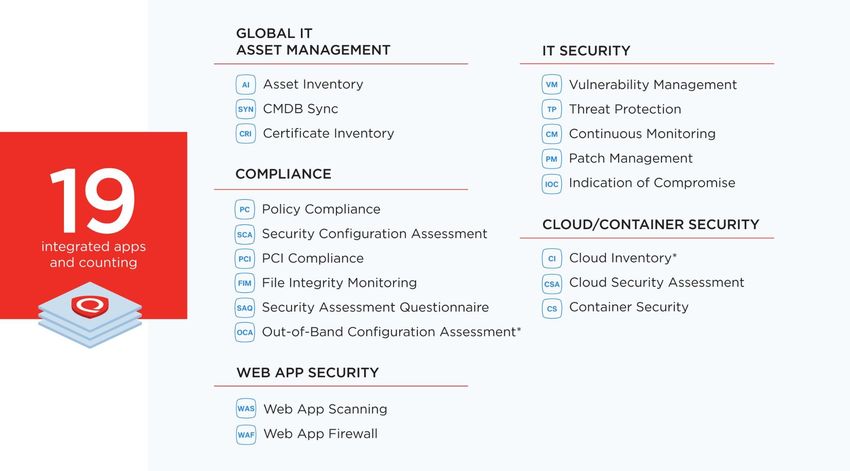
New ServicesIncreasing Number of Apps Delivered
Through the Qualys Cloud Platform
**
* Free Service
** Paid and Free ServiceQualys Ubiquity Play
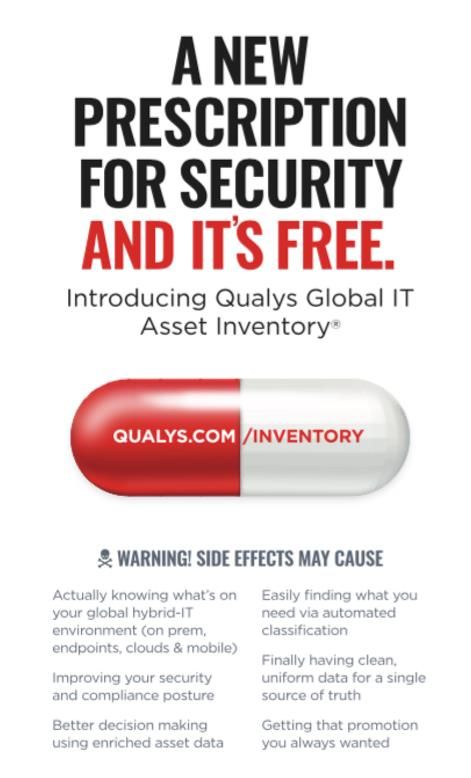
Introducing our Global IT Asset Discovery and
Inventory as a Free Service
Qualys Global IT Asset Inventory (AI) gives
you a “single source of truth” for IT assets
of all types, whether on-prem (devices and
applications), mobile endpoints, clouds,
containers, OT and IoT.
“You cannot secure what you don’t know
or can’t see”Qualys Ubiquity Play
Single source of truth for IT and Security teams managing
assets in hybrid environments.
Free Features:
• Real-time inventory of known and unknown assets across global IT footprint
• Search across millions of assets and obtain full visibility of any device in
seconds
• Instantly detect any device that connects to a user’s networks via passive
scanning technology
Additional Paid Features:
• Synchronization of assets with the ServiceNow CMDB
• Full life cycle software inventory
• Automatically quarantine unknown or known devices that have been
deemed out of compliance or compromisedAdditional Apps to Come in 2019
Passive Network Analysis
Continuous and unobtrusive detection of every IT asset
and its activity on the network
Secure Access Control
Respond to threats automatically by controlling access
to critical resources
Certificate Management
Automated renewing and management of digital certificates
Cloud Security Management
Remediation and management of cloud vulnerabilities
Secure Enterprise Mobility
Continuous visibility, security and compliance of enterprise
mobile devices
Run-Time Container Security
Runtime defense and automated policy enforcement to protect
against breaches and anomalies
Note: Target Beta time frameIntroducing New Expansion
of the Qualys Cloud Platform
Data Lake Initiative
Note: Target Beta time frame 1H 2020Scalable Business Model
Adoption of New Solutions
                  Fuels Growth and Profitability
($ in millions)

                           Quarterly revenues vs. customers

                                                                                  19 APPS
                   $100                                                   VM, PC, PCI, WAS, WAF, CM,
                                                                        FIM, SAQ, AI, TP, SYN, CRA, CI…

                                                     4 APPS
                   $50                            VM, PC, PCI, WAS
                          2 APPS
                          VM, PCI

                    $0
                           2008                          2013                       2018

                                    Quarterly revenues               Customers
New Apps Enabled by Cloud Agents
(Units in millions)
Number of Cloud Agents Sold
23.6
17.9
16.2
14.5
LTM LTM LTM LTM
Q3 2018 Q4 2018 Q1 2019 Q2 2019Strong and Consistent
Organic Revenue Growth
Outperforming market and gaining share
($ in millions)
19%
CAGR
16%Increasing Adjusted EBITDA
& Free Cash Flow
($ in millions)
2015 2016 2017 2018 Q2 Q2 2015 2016 2017 2018 Q2 Q2
2018 2019 2018 2019
YTD YTD YTD YTD
Note: 2017 non-GAAP Free cash flow normalized for headquarters office facility costs (net)Platform Adoption Accelerating
71% 44% 24% 13%
2+ solutions 3+ solutions 4+ solutions 5+ solutions
% of Enterprise customers with select number of solutionsMultiplier Effect
Enterprise customers with 4+ solutions spend
over 5x that of 1-solution customers
($ in thousands)
$274 $270
5+X
$238
of 1-solution
Avg. LTM revenues
$220
$207
average
per customer
$192 $182
$153
$51 $50 $52 $50
LTM LTM LTM LTM
Q2 2016 Q2 2017 Q2 2018 Q2 2019Multi-Product Adoption Drives
Increased Stickiness
99%
97%
91%
2 Products 3 Products 4 Products
2018 Enterprise Gross
Dollar Retention Rate
Note: Dollar Retention Rate is the retention rate of prior year Enterprise ARR (excluding upsell and downsell) averaged over the last four quartersIncreasing Number of Large Customers
($ in millions)
83
60
Aggregate Revenues
Customers
45
31
LTM LTM LTM LTM
Q2 2016 Q2 2017 Q2 2018 Q2 2019
Note: Customer count is defined as customers with greater than $500K in annual revenueCloud Platform Enables Scalable
Operational Model
Revenue per % of Customer Support,
S&M headcount Operations, and R&D
headcount in India
$1.2M $1.2M
$1.1M 69%
$1.0M 58%
46%
36%
2015 2016 2017 2018 2015 2016 2017 2018
High sales leverage Leveraging low cost geosIndustry-leading Margins
Q1 CY2019 Adjusted EBITDA margin vs.
select Security and SaaS peers
QLYS
Peer Median: 11%Industry-leading Margins
Q1 CY2019 Rule of 40 vs.
select Security and SaaS peers
QLYS
Rule of 40Unique Advantages of the Qualys’ Cloud
Platform
Single-pane-of-glass-view across on-premises assets,
endpoints, containers and cloud environments
No hardware to Lower Easy to deploy Unprecedented
buy or manage operating costs and maintain scaling
Nothing to install or manage, With everything in the cloud, Easily perform assessments on Qualys Cloud Platform is a
and all services are there are no capital geographically distributed and scalable, end-to-end solution
accessible in the expenditures, no extra human segmented networks at the for all aspects of IT security.
cloud via web interface. resources needed, and no perimeter, behind the firewall, Once deployed, seamlessly add
Qualys operates and infrastructure or software to on dynamic cloud environments new coverage, users and
maintains everything. buy and maintain. and endpoints. services as you need them.
Always Data stored
Available as a Public or
Up-to-date securely on-premises Private Cloud
Qualys has the largest Vulnerability data is Full server rack Standalone
knowledge base of vulnerability securely stored and For governments, appliance
signatures in the industry and processed in an n-tiered enterprises, and MSSPs For small businesses
performs over 3 billion IP scans architecture of load-balanced
per year. All security updates servers. Our encrypted databases Virtual rack FedRAMP
are made in real time. are physically authorized
and logically secure. For governments,
enterprises, and MSSPsAppendix
Increasing Number of Apps Delivered
 Through the Qualys Cloud Platform
 IT SECURITY                                                                            GLOBAL IT ASSET MANAGEMENT

      Vulnerability Management                Patch Management                             Asset Inventory **
      Continuously detect and protect         Streamline and accelerate vulnerability      Maintain full, instant visibility of
      against attacks, anytime, anywhere      remediation for all IT assets                all your global IT assets

      Threat Protection                       Indication of Compromise                     CMDB Sync
      Pinpoint your most critical             Continuously monitor endpoints to           Synchronize asset information from
      threats and prioritize patching         detect suspicious activity                  Qualys into ServiceNow CMDB

      Continuous Monitoring                                                                Certificate Inventory
      Alerts you in real time about network                                                Inventory of TLS/SSL digital
      irregularities                                                                       certificates on a global scale

 COMPLIANCE MONITORING                                                                  CLOUD/CONTAINER SECURITY

      Policy Compliance                       File Integrity Monitoring                    Cloud Inventory *
      Assess security configurations of IT    Log and track file changes                   Inventory of all your cloud assets
      systems throughout your network         across global IT systems                     across AWS, Azure, GCP and others

      Security Configuration                  Security Assessment Questionnaire            Cloud Security Assessment
      Assessment                                                                           Get full visibility and control
                                              Minimize the risk of doing business
      Automate configuration                  with vendors and other third parties         across all public cloud instances
      assessment of global IT assets
       PCI Compliance                         Out-of-Band Configuration                    Container Security
      Automate, simplify and attain PCI       Assessment *                                 Discover, track, and continuously
      compliance quickly                      Achieve complete visibility of all           protect containers
                                              known IT infrastructure

 WEB APPLICATION SECURITY

     Web Application Scanning                 Web Application Firewall
     Secure web applications with             Block attacks and virtually patch web
     end-to-end protection                    application vulnerabilities

 * Free Service
 ** Paid and Free Service                                     35
Reconciliation of Adjusted EBITDA ($ in millions)
Reconciliation of Non-GAAP Free
($ in millions)
                        Cash Flow

 Note: 2017 non-GAAP Free cash flow normalized for headquarters office facility costs (net)
Revenue by Geographic Area ($ in millions)
You can also read