Investor Presentation - Third Quarter 2018 Update November 2018 - Canadian Solar
←
→
Page content transcription
If your browser does not render page correctly, please read the page content below
Investor Presentation
       Third Quarter 2018 Update

November 2018

                                   CSIQ NASDAQ Listed
Safe Harbor Statement

  This presentation has been prepared by the Company solely to facilitate the understanding of the
  Company’s business model and growth strategy. The information contained in this presentation has not
  been independently verified. No representation, warranty or undertaking, express or implied, is made as
  to, and no reliance should be placed on, the fairness, accuracy, completeness or correctness of the
  information or the opinions contained herein. None of the Company or any of its affiliates, advisers or
  representatives will be liable (in negligence or otherwise) for any loss howsoever arising from any use of
  this presentation or its contents or otherwise arising in connection with the presentation.

  This presentation contains forward-looking statements and management may make additional forward-
  looking statements in response to your questions. Such written and oral disclosures are made pursuant to
  the Safe Harbor provisions of the U.S. Private Securities Litigation Reform Act of 1995. These forward
  looking statements include descriptions regarding the intent, belief or current expectations of the
  Company or its officers with respect to its future performance, consolidated results of operations and
  financial condition. These statements can be identified by the use of words such as “expects,” “plans,”
  “will,” “estimates,” “projects,” or words of similar meaning. Such forward-looking statements are not
  guarantees of future performance and involve risks and uncertainties. Actual results may differ materially
  from expectations implied by these forward-looking statements as a result of various factors and
  assumptions. Although we believe our expectations expressed in such forward looking statements are
  reasonable, we cannot assure you that they will be realized, and therefore we refer you to a more
  detailed discussion of the risks and uncertainties contained in the Company’s annual report on Form 20-F
  as well as other documents filed with the Securities & Exchange Commission. In addition, these forward
  looking statements are made as of the current date, and the Company does not undertake to update
  forward-looking statements to reflect future events or circumstances, unless otherwise required by law.

                                                                                                               2
Declining Cost Drives Adoption

 Investment Forecast for Wind and Solar Capacity Through 2018   LCOE Benchmark Value ($/MWh)

  Investment and GW deployment of renewables will continue to grow owing to declining
  cost/watt, particularly for solar.

Source: J.P. Morgan Analyst Research Report

                                                                                               3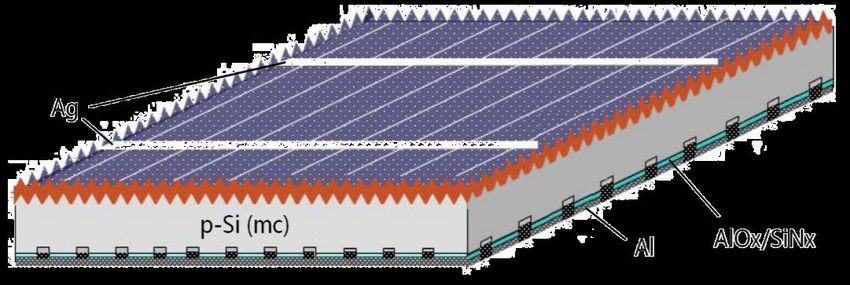
Global PV Installation Continue to Grow
CAGR: 37.1% CAGR:8.3%
135
125
116.5
Growth Drivers 103.4
98.0
Grid Parity
45.2
Environment Preservation ROW 14.9
81.3 34.9
Energy Security
10.3
16.7 1.7
57.8 10.7 14.1
5.8 12.7
1.0 7.5
2.6 2.6
45.1 15.6 14.6
10.4 13.5
37.8 3.0
1.4 8.7 5.6 5.3
31.0 15.4
26.9 11.7 8.4
1.1
2.0
12.5 1.2 53.0
15.0 3.3 7.0 10.8
14.4 0.8 5.2 37.2 35.9
7.7 34.5
6.5 7.6 6.3 9.4
5.3
7.5 3.6 18.6
4.1 2.8 7.2 2.3 10.1 10.2
2.0 3.8 4.2
2008 2009 2010 2011 2012 2013 2014 2015 2016 2017 2018E 2019E 2020E 2021E
China Japan US Germany India Rest of World
Source: Global PV module demand assumptions from IHS, Bloomberg and analyst research reports
4
We Are at the Very Early Stages of Solar Adoption

                    Solar energy will grow from ~2% of global electricity generation today to >10% by 2030
  Global Cumulative Solar PV Installations (GW)
            GW Installed                                                                                                                                           >10%

     %       % of Electricity Generated                                                                                                                            1,835.0

                                                                                                                                                           ~2%

                                                                                                                                                   319.7   414.2
                                                                                                                           138.8   183.8   242.6
     1.2      1.6      2.1      2.6        3.7     5.1         6.7   9.2      15.8     23.2      40.3      70.5   100.5

   2000      2001     2002     2003     2004     2005      2006      2007    2008     2009       2010     2011    2012     2013    2014    2015    2016    2017     2030

           Canadian Solar’s key markets such as China, U.S. India and Japan are significantly under-penetrated

           7.1%                  3.2%                    1.6%                1.9%                  5.9%                   1.7%              1.8%                 7.5%

              Solar PV Installations by Country (GW)                                                                                       130.3

       %      Solar Electricity Contribution (%)
                                                                             53.0                  49.2                                                          42.9
            20.2                                                                                                          20.0
                                  7.7                    8.0

            Italy              Australia              France                 USA                   Japan                  India            China             Germany

Source: EPIA, IHS, EIA, Canadian Solar Analysis; Cumulative Installations as of the year 2017.

         Solar PV installed capacity is forecast to grow to over 1,835 GW in 2030.

                                                                                                                                                                             5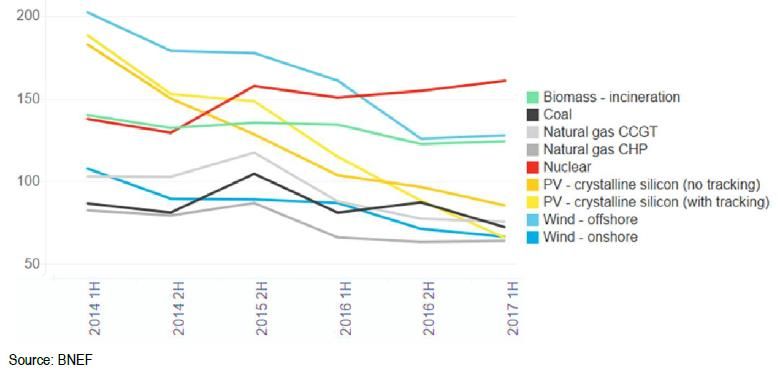
Company Overview
                                                                                                                                         Global Footprint and Brand
            Founded in Ontario, 2001
            Listed on NASDAQ (CSIQ) in 2006
            Over 12,000 employees globally
            Presence in 20 countries / territories
            > 30 GW of solar modules shipped cumulatively
            > 4.6 GWp (1) solar power plants built and
            connected (incl. Recurrent)
            Global Top 3 solar company by revenue in                                                                                        Manufacturing facility     Late-stage, utility-scale solar projects
                                                                                                                          Sales office
            2017
                                           Highlights                                                                          Solar Power Plants Built and Connected
                                                                                                                                                                                                (MWp)
          Q3 2018 Revenue: $768.0 million                                                                                                                                                       4,124.3

          Q3 2018 Shipment: 1.59 GW                                                                                                                                  2,535.6
                                                                                                                                                                                  3,149.2

          2018 Shipment Guidance: 6.33 GW to 6.38 GW
                                                                                                                                                          1,196.1
                                                                                                                                              628.1
          2018 Revenue Guidance: $3.5 billion to $3.6 billion                                                           80.5        261.8

                                                                                                                   2011-12          2013      2014         2015      2016          2017         2018E

Source: Company information as of November 15, 2018
1. Includes solar power projects built and connected by Recurrent Energy before acquisition by Canadian Solar in 2015

                                                                                                                                                                                                             6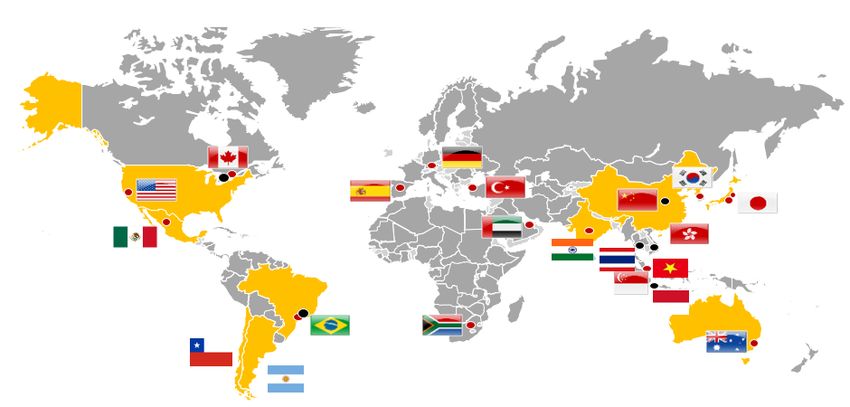
Energy Business: Globally Diversified Project Pipeline

                                                                                    Priority Markets for Utility-scale Project Development

9.5 GWp
Total project development
pipeline

6.6 GWp
Early to mid-stage
development pipeline (2)                                                 U.S.
                                                                                                                                                                                              Japan
                                                                                                                                                                         China
                                                                                                                                                                                     South Korea
~2.9 GWp                                                     Mexico                                                                                            India               Taiwan, ROC

Total late-stage project                                     Short term
                                                                                                                                                                                      the Philippines

pipeline (1)                                                 Mid term
                                                                                                                                                                                   Malaysia

                                                             Long term                        Brazil

~1,148 MWp                                                   Monitoring
                                                                                                                                                                                     Australia
Solar power plants owned
                                                                                 Chile
and operated, with an                                                                        Argentina

estimated resale value of                                                                          Late-stage, utility-scale solar project pipeline (MWp)
$1.23 billion
                                  U.S.       Brazil Mexico Japan                 China       Australia Argentina Taiwan Philippines India                              Chile      Malaysia South Korea
                                 1,022       476.2 435.7    310                   255          121       97.6     41.7     27.5      24                                18.4         15          8

Source: Company information as of November 15, 2018
Note: (1) Late-stage project pipeline, nearly all projects have an energy off-take agreement and are expected to be built within the next 2-4 years. Some projects may not reach completion due to failure
        to secure permits or grid connection, among other risk factors.
       (2) Early to mid-stage of development: includes only those projects that have been approved by our internal Investment Committee or projects that are expected to be brought to the Investment
        Committee in the near term.

                                                                                                                                                                                                             7
U.S. Utility-scale Solar Project Pipeline
Market Leader in the U.S. U.S. Late-stage Project Development Footprint
5.4 GWp
Early to mid-stage pipeline
1,022 MWp
Late-stage pipeline
340.1 MWp
Owned and operated1
Projects in Operation1 Late-stage Project Pipeline
NC 102 Mustang Roserock Mustang Two Gaskell West 2 Pflugerville Texas Project Slate
102 134 104 210 147 185 280 200
MWp MWp MWp MWp MWp MWp MWp MWp
Commercial Commercial Commercial Development;
Operation Operation Operation Under development; COD expected in 2020 COD expected
since Q3 2018 since Q3 2016 since Q4 2016 in 2021
Source: Company information as of November 15, 2018
1. It represents the MWp owned by Canadian Solar
8Japan Utility-scale Solar Project Pipeline
Total Solutions Business – Japan Utility-scale COD Schedule1 - MWp
310 MWp 165.9
Late-stage pipeline
92.9 MWp 70.3
60.6
Owned and operated
13.2
2H2018 2019 2020 2021+
Note: (1) Expected COD are tentative estimates subject to change, due to delays in
securing all the necessary permits among other risk factors.
310 MWp late-stage projects have secured interconnection
agreement and FIT, including 73.8 MWp in construction and
236.2 MWp under development
Yamaguchi Shin Mine plant: 56 MWp Projects in the bidding process 11.4 MWp
Source: Company information as of November 15, 2018
9Market Leader in Brazil and Mexico
79.8 MWp*
Owned and operated Gross Expected
In Brazil Late-stage projects Location Status
MWp COD
Francisco Sa (1) 122.2 Minas Gerais Development 2021
3
Jaiba (1) 97.3 Minas Gerais Development 2021
3
2
Lavras (3) 144.7 Ceara Development 2021
1
Salgueiro (2) 112 Pernambuco Development 2020
Total 476.2
Gross Expected
Late-stage projects Location Status
MWp COD
1
EL Mayo (1) 124 Sonora Development 2020
Tastiota (1) 125 Sonora Development 2020
2
Horus (2) 119 Aguascalientes Development 2020
Aguascalientes (2) 67.7 Aguascalientes Construction 2019
Total 435.7
Source: Company information as of November 15, 2018
Note: * The MWp size represents Canadian Solar’s equity interests in the projects
10Expected Capacity with New Technology and Cost Reduction
Manufacturing Capacity - MW Technology upgrade – New products, new process, new
design
Diamond wire-saw wafer
9,640
8,700
9,360 Black silicon
8,110 Mono PERC
7,100 Black silicon + Poly PERC
6,170 6,250 6,300 Black silicon + Poly PERC + Bifacial
5,450
5,000 5,000 5,000 5,000
Global Manufacturing Footprint
4,330 Brazil
3,000
Canada
2,700 2,440 China
1,580
1,000 1,200
1,650 1,650 1,650 Indonesia
260 400 400 South East Asia
Vietnam
2014 2015 2106 2017 2018E 1H2019E 2H2019E Operation efficiency improvements: Shorter cycle time and
Ingot Wafer Cell Module lower inventory
Total Module Shipments - MW Top 3 Solar Company by Revenue in 2017
$4,069 (Revenue in $ ‘millions)
6,828 $3,390
$3,022 $2,941
5,232
4,706 $2,177
$1,872
3,105
$1,285
1,894
1,543
1,323
803
83 168 310
15
2006 2007 2008 2009 2010 2011 2012 2013 2014 2015 2016 2017 JKS CSIQ JASO FSLR HQCL SPWR YGE
Source: Company information as of November 15, 2018
11Competitive Pipeline of Homegrown Technologies
P4 Mono PERC
1% cell efficiency and 12 watts module power gain on 60- Mono PERC enhances back side passivation and increased cell
cell module design over baseline; cell efficiency reached efficiency to over 22%
over 20.5% in mass production Low Light Induced Degradation (LID), and Potential Induced
Over 4 years in-house R&D, self-owned IPs Degradation (PID) resistant
Premium product: 60-cell module power reached over 320
~4GW in-house multi cell production used this technology Watt
at the end of Q3 2018
100% mono cell production was upgraded to mono PERC at
Pleasing aesthetics the end of 2017
12Cell Efficiency Roadmap
Cell Efficiency Highlights
24.0%
Mono PERC P4 will improve the multi-
Conventional mono
technology phased crystalline cell efficiency to
23.0% out in 2017 above 22% in 2021
Mono PERC cell efficiency
22.0% P4 can reach above 23% in
mass production by 2021
21.0%
Non-PERC cell technologies
will be phased out by the
20.0%
end of 2019
P3
Other high efficiency and
19.0% P3 to be phased
Conventional poly out in 2019 cost competitive
technology phased technologies are also in
out in 2017
18.0%
R&D
2017 2018 2019 2020 2021
32 13Experienced Board & Senior Management
Name / Title Work Experience
Founded Canadian Solar in 2001, and has since then, firmly established the company as a global
Dr. Shawn Qu leader of the solar industry
Chairman, President & CEO (Director) Director & VP at Photowatt International S.A.
Research scientist at Ontario Hydro (Ontario Power Generation Corp.)
Dr. Huifeng Chang Co-Head of Sales & Trading at CICC US in New York
CEO of CSOP Asset Management in Hong Kong
SVP, Chief Financial Officer
Vice President of Citigroup Equity Proprietary Investment in New York
Yan Zhuang Head of Asia of Hands-on Mobile, Inc.
SVP and Chief Commercial Officer Asia Pacific regional director of marketing planning and consumer insight at Motorola Inc.
Vice President for R&D and Industrialization of Manufacturing Technology at Suntech Power
Guangchun Zhang Holdings
SVP and Chief Operating Officer Centre for Photovoltaic Engineering at the University of New South Wales and Pacific Solar Pty.
Limited.
CEO at Talesun Solar Co., CFO at Canadian Solar Inc.
Arthur Chien
Managing director of Beijing Yinke Investment Consulting Co. Ltd.
SVP and Chief Strategic Officer Chief financial officer of China Grand Enterprises Inc.
Senior advisor to several Chinese law firms
Jianyi Zhang
Senior assistant general counsel at Walmart Stores, Inc.
SVP and Chief Compliance Officer Managing Partner at Troutman Sanders LLP
Dr. Guoqiang Xing Chief Technology Officer of Hareon Solar
R&D Director of JA Solar
SVP and Chief Technology Officer R&D Director at several semiconductor companies
Robert McDermott
Partner with McMillan LLP, a business and commercial law firm
Chairperson of the Corporate Governance ,
Director and senior officer of Boliden Ltd.
Independent Directors
Nominating and Compensation Committees
Lars-Eric Johansson
CEO of Ivanhoe Nickel & Platinum Ltd.
Experienced
Chair of the Audit and member of Governance, and
Chairperson of the Audit Committee of Harry Winston Diamond
Compensation Committees
Dr. Harry E. Ruda
Director of the Centre for Advanced Nanotechnology, Stanley Meek Chair in Nanotechnology
Chair of Technology and member of the Audit, Governance,
and Prof. of Applied Science and Engineering at the University of Toronto, Canada
Compensation Committees
Andrew Wong Senior Advisor to Board of Directors of Henderson Land Development Co.
Member of the Audit, Corporate Governance, Director of Ace Life Insurance Co. Ltd., China CITIC Bank Corp., Intime Retail (Group) Co. Ltd. And
Compensation Committees Shenzen Yantian Port (Group) Co. Ltd.
Source: Company information
14Income Statement
Revenue – US$ million Gross Profit – US$ million
Margin
16.2%(1) 18.8% 17.5% 19.7% 10.1% 24.5% 26.1%
4,000
3,390
3,500
2,853 638
3,000 700
2,500 600
461 (1)
500
2,000
1,425 400
1,109 1,500
300
912 768 1,000 219 144 200
651 160 159 200
500 100
0 0
2016 2017 Q3 17 Q4 17 Q1 18 Q2 18 Q3 18 2016 2017 Q3 17 Q4 17 Q1 18 Q2 18 Q3 18
Operating Income – US$ million Net Income – US$ million
4.8% (1) 7.9% 6.3% 11.7% 5.5% 8.3% 12.5% 3.3%(1) 2.9% 1.5% 5.5% 3.0% 2.4% 8.7%
269
137 (1)
130 93 (1) 100
96 67
78 61 43
58 54
13 16
2016 2017 Q3 17 Q4 17 Q1 18 Q2 18 Q3 18 2016 2017 Q3 17 Q4 17 Q1 18 Q2 18 Q3 18
Source: Company filings
Note: (1) Non-GAAP adjusted numbers, excluding the AD/CVD true-up provision of $44.1 million
15MSS Business and Energy Business – Revenue and Gross Profit
Three Months Ended September 30, 2018 – US$ thousand Nine Months Ended September 30, 2018 – US$ thousand
2,843.5
768.0
2,339.7
255.7 567.6 1,239.4
1,058.9
183.6
200.4
512.3 1,604.1 503.8
384.0 72.0 1,280.8
180.5
128.3 323.3
Net Revenue Cost of Revenue Gross Profit Net Revenue Cost of Revenue Gross Profit
MSS Energy MSS Energy
Revenue - Three Months Ended September 30, 2018 – US$ thousand Revenue – Nine Months Ended September 30, 2018 – US$ thousand
1,604.1
1,432.2
512.3 1,216.4 1,239.4
440.3
251.0 255.7
21.9 32.1 15.6 68.8 41.3 54.4
2.4 2.0 2.7 7.5 7.1 15.8
Solar Solar EPC and O&M MSS Other MSS Total Solar power Electricity Energy Energy Solar Solar EPC and O&M MSS Other MSS Total Solar power Electricity Energy Energy
modules and system kits development services projects Other Total modules and system kits development services projects Other Total
other solar services other solar services
power power
products products
Source: Company filings 16Operating Expenses as % of Net Revenue
Selling Expenses General & Administrative Expenses
6.2% 8.7%
5.1% 7.1% 7.7%
4.6% 4.7% 5.0% 6.8%
6.3%
5.8%
3.6%
3.0%
3.4%
2016 2017 Q3 17 Q4 17 Q1 18 Q2 18 Q3 18 2016 2017 Q3 17 Q4 17 Q1 18 Q2 18 Q3 18
Research & Development Expenses Total Operating Expenses
16.2% (1)
1.4%
1.3% 13.6%
11.4% 10.9% 11.2%
0.8%
0.8% 0.8% 8.0%
0.7%
0.6%
4.6%
2016 2017 Q3 17 Q4 17 Q1 18 Q2 18 Q3 18 2016 2017 Q3 17 Q4 17 Q1 18 Q2 18 Q3 18
Source: Company filings
Note: Percentages are of the total net revenue in the corresponding period.
(1) The % is affected by the deferral of several project sales.
17Guidance as of November 15, 2018
Q3 2018 Q4 2018 FY2017 FY2018 YoY ∆%
Module
1.59 GW 1.67 GW to 1.72 GW 6.8 GW 6.33 GW to 6.38 GW -6.6%
Shipments
Revenue $768 mn $690 mn to $800 mn $3.39 bn $3.5 bn to$3.6 bn +6.2%
Gross Margin 26.1%(1) 24.0% to 26.0%(1) NA NA NA
1-Includes MSS business and Energy business
18THANK YOU
November 2018
19You can also read