Trends in Retail - Issue 16, Fall 2019 - Government of Alberta
←
→
Page content transcription
If your browser does not render page correctly, please read the page content below

Trends
in Retail

Issue 16, Fall 2019
Trends in Retail
provides a more detailed analysis of ice cream sales
Content in Alberta at grocery stores. Alberta’s ice cream and
related products industry has exhibited strong
Retail Trends in Ice Cream Sales potential for growth. Considering recent growth in
o Alberta Sales Trends yogurt and butter, ice cream may be the next dairy
o Potential Drivers of Trends product category poised for stronger growth.
Canadian Market Structure - Ice Cream
and Related Products Industry Figure 2 exhibits volume sales for a variety of ice
o Production and Consumption cream flavours. Nielsen Market Track data indicates
o that in Alberta grocery stores, volume sales were
Trade
highest for ‘other’ flavours of ice cream followed by
Data Highlights
vanilla, chocolate, and neopolitan. Figure 3 depicts
dollar sales growth for ice cream flavours between
Retail Trends in Ice Cream 2017 and 2018. Sales growth was highest for cherry
(27 per cent), strawberry (15 per cent), and
Sales chocolate (13 per cent). The category with the
highest dollar sales, ‘other’ flavours, experienced no
Alberta Sales Trends
change in growth between 2017 and 2018. Overall,
An analysis of Nielsen Market Track data shows that vanilla was the most popular flavour in terms of
sales values of ice cream and related products have dollar sales and volume sales.
increased over the past few years. Between 2013
and 2018, ice cream and related products dollar
sales value increased by 14 per cent. Figure 1
Figure 1. Alberta Grocery Store Ice Cream Sales ($ Value), 2013- 2018
$62,000,000
$60,000,000
Dollar Sales (in CAD)
$58,000,000
$56,000,000
$54,000,000
$52,000,000
$50,000,000
$48,000,000
2013 2014 2015 2016 2017 2018
Source: Nielsen Market Track Data
Economics and Competitiveness Branch, Alberta Agriculture and Forestry
©2020 Government of Alberta | Published: January 2020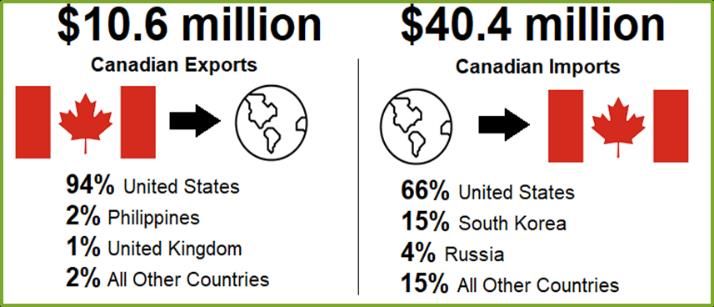
Figure 2. Alberta Grocery Store Ice Cream Sales (in kg) and Annual Growth (2017-2018)

                                   30,000,000
                                   25,000,000   +25%
                                   20,000,000
            Volume Sales (in kg)

                                                       +1%
                                   15,000,000
                                                             +12%
                                   10,000,000
                                    5,000,000                       -2%   +17% +1% +15% -8%           +9%    +21%
                                            0

Figure 3. Alberta Grocery Store Ice Cream Sales ($ Value) and Annual Growth (2017-2018)

                                   25,000,000   0%
                                   20,000,000          +2%
   Dollar Sales (in CAD)

                                   15,000,000
                                                             +13%
                                   10,000,000
                                    5,000,000                       -1% +15%   -1%    +11%    -7%    +11% +27%
                                           0

Source: Nielsen Market Track Data

In Alberta, Nielsen Market Track data indicates that                                 Figure 4. Alberta Grocery Store Ice Cream Sales ($
ice cream products in smaller package sizes have                                     Value) and Annual Growth (2017-2018) by Package
experienced the most dollar sales growth between                                     Size
2017 and 2018. Ice cream products packaged in 500
mL or smaller packages experienced a 45 per cent                                                                                   +45%
increase in sales between 2017 and 2018. On the
other hand, ice cream packaged in two to four litre
containers experienced a decrease in sales by one
per cent while one to two litre containers
experienced no growth.

                                                                                       Source: Nielsen Market Track Data

Economics and Competitiveness Branch, Alberta Agriculture and Forestry
©2020 Government of Alberta | Published: January 2020
Potential Drivers
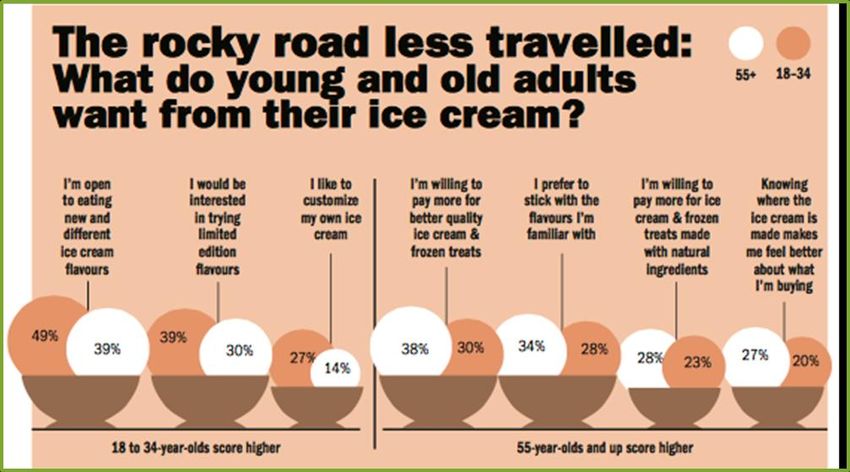
A report by Mintel suggests that consumers’ ice KerryDigest states there are five emerging trends in
cream preferences may be dependent on their age. the ice cream industry: (1) snackification; (2)
Figure 5 describes the preferences of consumers premiumisation; (3) healthy-ish; (4) fun flavors; and
based on two age categories – 18 to 34 and 55 and (5) experimental and novel.1
over. Consumers aged 18 to 34 scored higher for
statements regarding ice cream products that were Snackification: The demand for convenience-based
new and different, limited edition, or customizable. products has been on the rise. Ice cream products,
On the other hand, consumers 55 and over scored once viewed as an occasional dessert, may be
higher for statements concerning familiar flavours, enjoyed as a snack option. Health conscious
price premiums for better quality, natural ingredients, consumers find appeal in snack–sized portions as a
and product traceability. Consumer demographic way to limit their caloric intake. As such, the industry
factors, including age, have the potential to impact has witnessed an increase in single-serve formats.
purchasing and decision making patterns. This trend is evident in Nielsen Market Track data
with an increase in the sales of products in smaller
package sizes (Figure 4).
Figure 5. Ice Cream Preferences by Age Category
Premiumisation: The ice cream industry has
Source: Mintel’s Ice Cream and Frozen Novelties Canada, May 2016increased
Report production of products that are viewed as
premium and luxurious. The definition of a luxurious
ice cream may be highly dependent upon the region.
For example, data suggests that 29 per cent of
1https://kerry.com/sea-
en/sitecore/content/kerrysite/pages/insights/kerrydigest/2018/the-
state-of-the-global-ice-cream-market
Economics and Competitiveness Branch, Alberta Agriculture and Forestry
©2020 Government of Alberta | Published: January 2020Asian-Pacific consumers perceive an ice cream manufacturers may introduce new flavours by
product to be premium and innovative when adding unconventional flavours to a more classic
additional dairy product (i.e., cheesecake or cheese flavour like vanilla. Seasonal flavours have also
pieces) are incorporated. However, in Latin America increased in popularity. A KerryDigest survey
an ice cream product may be considered premium if indicated that 88 per cent of consumers who
it includes candies or cookies. In Europe, 79 per purchased a seasonal product within the last year
cent of consumers are looking for premium ice would be more likely to try an new flavour if it was
cream products that contain natural or authentic considered seasonal.This may be an avenue for ice
ingredients. Retailers may need to be aware of what cream manufacturers to introduce new products
is considered premium within their region. without fully committing to them.
Healthy-ish: An emerging trend is “permissible Experimental and Novel: Novel and experimental
indulgence”. In particular, the ice cream industry products have found their way into the ice cream
may adhere to this trend by providing consumers industry, especially with the rise of social media
with a functional ice cream that may contain healthy platforms. Consumers are interested in products that
additions such as added protein or probiotics. By they can share with their social media followers.
incorporating additional ingredients directed towards Globaldata reports that Asian-Pacific consumers are
consumer health, ice cream manufacturers may be willing to pay a premium for a product if it has the
able to transform their products from a “want” to a potential to be shared on social media.
“need”.
Similar to other food and beverage markets, In September 2019, Halo Top was purchased by
consumers are increasing their demand for products Wells Enterprises, one of the largest family-
with health and wellness claims. This may include owned ice cream producers in the United
claims of free-from, natural, organic, and reduced States. This is a significant acquisition as it may
sugar. Nielsen’s global ingredient study indicated indicate the importance of the better-for-you
that 68 per cent of consumers are willing to pay segment in the ice cream industry. Wells CEO,
more for products that do not contain undesirable Mike Wells, stated that:
ingredients.2 Non-dairy alternatives, like almond or
coconut milk, have increased in popularity. Nielsen
“Halo Top disrupted the ice cream
Grocery Sales data concludes that the non-dairy
category by providing a high protein,
category of ice cream has experienced the most
low sugar, low calorie dessert that gave
growth in dollar sales between 2016 and 2017 with a
consumers a reason to purchase ice
growth rate of 49 per cent.
cream as a treat again. Halo Top met a
consumer need that no one else in the
Fun Flavors: Traditional flavours (e.g., chocolate,
category was serving.”
vanilla, and strawberry) have historically captured
the bulk of the ice cream market. However, there is
an increase in demand for a larger variety of flavors, Source: https://www.dairyreporter.com/Article/2019/09/11/Halo-Top-
acquired-by-Blue-Bunny-producer
especially by Asian-Pacific consumers. A new term,
“swavory”, has been used to describe ice cream
flavours that are both sweet and savory. Ice cream
2https://www.nielsen.com/us/en/insights/article/2017/americans-
are-scooping-up-better-for-you-sweetness-for-national-ice-cream-
month/
Economics and Competitiveness Branch, Alberta Agriculture and Forestry
©2020 Government of Alberta | Published: January 2020Furthermore, Canadian ice cream and frozen
Canadian Market Structure - dessert manufacturers were categorized by their
Ice Cream and Related employment size. Figure 6 shows these statistics. In
Products Industry 2016, 94 per cent of ice cream and frozen dessert
establishments employed 1-99 employees. In
Production Alberta, 100 per cent of ice cream and frozen
dessert establishments employed 1-99 employees.
In 2016, Canada had 131 ice cream and frozen
dessert manufacturers. Ontario had the most with
In Canada, four large companies hold a substantial
51, followed by Quebec (43), British Columbia (15),
amount of market share – Unilever, Nestle SA,
Alberta (12), Manitoba (3), Nova Scotia (3), Prince
Agropur Dairy Cooperative, and David Chapman’s
Edward Island (2), New Brunswick (1) and
Ice Cream Limited. These four companies account
Newfoundland (1).
for nearly 85 per cent of the total market share in
Canada.
Figure 6. Ice Cream and Frozen Dessert establishments by employment size category, 2016
Source: Statistics Canada, special tabulation, unpublished data, unclassified excluded, 2016
Consumption
The Canadian ice cream industry has experienced decreased their consumption of both hard and soft
substantial changes in the past decade. Data ice cream products. In 2005, per capita consumption
suggests that ice cream production has steadily was 9.85 litres. By 2016, per capita consumption
declined since 2000 and only began to increase dropped to 5.44 litres. Figure 7 describes these
again in 2014. In addition, Canadians have statistics in more detail.
Economics and Competitiveness Branch, Alberta Agriculture and Forestry
©2020 Government of Alberta | Published: January 2020Figure 7. Canadian Ice Cream Production and Per Capita Consumption, 2000-2016
200000 12
180000
160000 10
Consumption (L)
140000 8
Production (kL)
120000
100000 6
80000
60000 4
40000 2
20000
0 0
Canadian Ice Cream Mix Production, kL Per capita consumption - hard and soft ice cream
Source: Agriculture and Agri-Food Canada, Canadian Dairy Information Centre
Trade
Canadian exports of ice cream and frozen desserts has
increased substantially. Figure 8 describes Canadian exports
and imports of ice cream and frozen dessert products. In Did you know?
terms of dollar value, Canada’s export of ice cream and
frozen desserts has increased more than 200 per cent Canada imports nearly four times more
between 2014 and 2018. In 2018, Canadian exports of ice ice cream and frozen desserts than it
exports!
cream and frozen dessert products totaled $10.6 billion and
imports totaled $40.4 billion. The top export and import market
was the United States.
Figure 8. Canadian Exports and Imports of Ice Cream and Frozen Desserts, 2018
Source: Global Trade Online
Economics and Competitiveness Branch, Alberta Agriculture and Forestry
©2020 Government of Alberta | Published: January 2020Data Highlights Quarterly Analysis
This section provides an update on retail and food In addition, this issue of Trends in Retail provides a
service sales trend data in Alberta. Table 1 provides comparison of Q2-2019 and Q3-2019 sales data.
data for retail food and beverage sales in Alberta. Between Q2-2019 and Q3-2019, total food and
Table 2 provides data for food service and drinking beverage stores experienced a decrease in sales
places sales in Alberta. (2.8 per cent). This may come as no surprise, as
Statistics Canada data concludes that Q3-2019 real
gross domestic product growth expanded by only
Annual Analysis 0.3 per cent which may indicate softness in
consumer spending.4 At a sub-category level, sales
This issue of Trends in Retail provides a comparison decreased between Q2-2019 and Q3-2019 for
of Q3-2018 and Q3-2019. In regards to retail food grocery stores (2.6 per cent) and beer, wine, and
and beverage sales, total food and beverage stores liquor stores (4.3 per cent). On the other hand,
experienced a decrease in sales by 0.5 per cent specialty foods stores experienced Q2-2019 to Q3-
between Q3-2018 and Q3-2019. At a sub-category 2019 growth of 1.2 per cent.5
level, annual Q3 sales decreased for grocery stores
(1.4 per cent) and beer, wine and liquor stores Furthermore, food service and drinking places sales
(1.1 per cent). Alternatively, specialty foods stores experienced increased sales between Q2-2019 and
experienced annual Q3 sales growth of 18.3 per Q3-2019 of 3.5 per cent. At a sub-category level,
cent. The large growth in specialty food is not specialty food services (7.8 per cent), drinking
unexpected. The Specialty Food Association (SFA) places (13.4 per cent), full-service restaurants
reports this particular segment continues to be one (3.7 per cent), and limited-service eating places
of the fastest growing food business segments.3 (two per cent) experienced increased sales between
SFA reports that the top five categories that Q2-2019 and Q3-2019.
comprise specialty food sales include: cheese and
plant-based cheese; frozen, refrigerated meat,
poultry, seafood; chips, pretzels, snacks; non -
ready-to-drink tea and coffee; and, bread and baked
goods.5
Furthermore, food service and drinking places sales
experienced increased sales of 2.4 per cent
between Q3-2018 and Q3-2019. At a sub-category
level, specialty food service (13.3 per cent), full-
service restaurants (3.8 per cent), and limited-
service eating places (0.5 per cent) experienced
increased annual Q3 sales. Drinking places
experienced an annual Q3 decrease in growth
(8.2 per cent).
3 https://www.specialtyfood.com/news/article/specialty-food-sales- 5 Statistics Canada defines special food services as this industry
near-150-billion-2019-state-specialty-food-industry-report- group comprises establishments primarily engaged in providing
released/ food services at the customer's location, at a location designated
4 https://www150.statcan.gc.ca/n1/daily-quotidien/191129/t002a- by the customer, or from a motorized vehicle or non-motorized
eng.htm cart.
Economics and Competitiveness Branch, Alberta Agriculture and Forestry
©2020 Government of Alberta | Published: January 2020Table 1. Retail Food and Beverage Sales in Alberta (in Million Dollars)
Q2 to
Annual Q3
Sub Categories Q3 2018 Q4 2018 Q1 2019 Q2 2019 Q3 2019 Q3
Change
2019
Total Food and Beverage Stores 3,745,450 3,871,822 3,473,249 3,831,570 3,725,070 -2.8% -0.5%
Grocery Store 2,871,987 2,925,493 2,751,347 2,909,757 2,832,818 -2.6% -1.4%
Specialty Food Stores 146,736 197,548 149,441 171,616 173,622 1.2% 18.3%
Beer, Wine and Liquor Stores 726,726 748,781 572,462 750,616 718,630 -4.3% -1.1%
Source: Statistics Canada
Table 2. Food Service and Drinking Places Sales in Alberta (in Million Dollars)
Annual
Q2 to Q3
Sub Categories Q3 2018 Q4 2018 Q1 2019 Q2 2019 Q3 2019 Q3
2019
Change
Total Food Services and Drinking
2,461,186 2,377,636 2,170,120 2,434,512 2,519,026 3.5% 2.4%
Places
Specialty Food Services 139,595 152,549 146,433 146,758 158,152 7.8% 13.3%
Drinking Places (alcoholic beverages) 101,956 93,425 78,960 82,521 93,606 13.4% -8.2%
Full-Service Restaurants 1,077,330 1,048,823 966,125 1,079,254 1,118,758 3.7% 3.8%
Limited-Service Eating Places 1,142,305 1,082,838 978,600 1,125,980 1,148,512 2.0% 0.5%
Source: Statistics Canada
Author: Stephanie Budynski
Coordinating Researcher
Competitiveness and Market Analysis Section
Economics and Competitiveness
Branch Phone: 780-415-9773
Email: stephanie.budynski@gov.ab.ca
The views and opinions expressed in this article are those of the Economics and Competitiveness Branch
and do not necessarily reflect the official policy or position of the Ministry of Agriculture and Forestry or the
Government of Alberta. Analysis performed within this article is based on limited and open source
information. Assumptions made within the analysis are not reflective of the position of the Ministry of
Agriculture and Forestry nor the Government of Alberta.
Economics and Competitiveness Branch, Alberta Agriculture and Forestry
©2020 Government of Alberta | Published: January 2020You can also read