ST. LOUIS REGIONAL REAL ESTATE - Market Indicators & Workforce Statistics Q2 2021
←
→
Page content transcription
If your browser does not render page correctly, please read the page content below

ST. LOUIS REGIONAL
REAL ESTATE
Market Indicators &
Workforce Statistics
Q2 2021

The St. Louis region has the
industrial space, the available
workforce, and is ready to help
you find the space you need.

The ST. LOUIS REGIONAL FREIGHTWAY
                                                    MARY C. LAMIE P.E.
has created this newsletter to educate business     Executive Vice President of Multi Modal Enterprises
leaders about the recent growth in the industrial   Bi-State Development
                                                    314.982.1562 | mclamie@bistatedev.org
market and how the region is poised for further
expansion.                                          T H E F R E I G H T WAY.C O M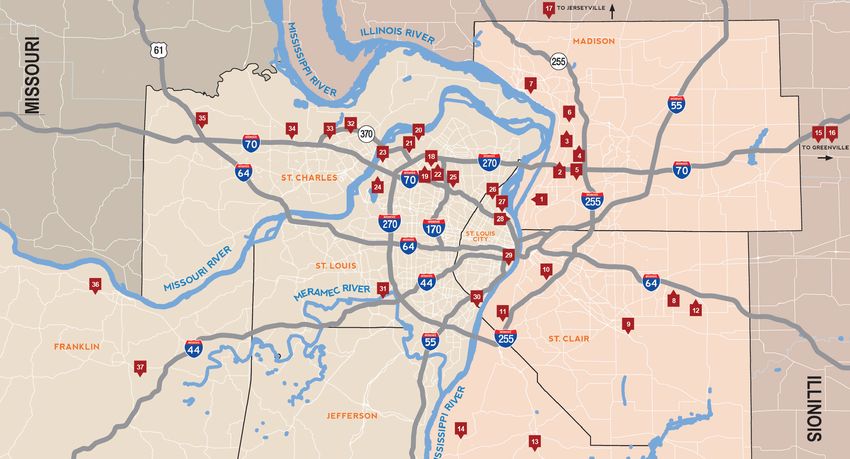
This market report showcases the St. Louis regional
industrial landscape and focuses on the freight,
logistics and distribution market. The St. Louis Regional
Freightway is spotlighting the hotspots within the
market and highlighting the region’s capacity to deliver
a job-ready workforce.

  Explore this newsletter to find out why
  the St. Louis regional industrial market is
    a prime location for freight operations!

          Interactive Newsletter Outline

1.       Industrial Real Estate
           Market Indicators               5.   Industrial Job-Ready
                                                Workforce Statistics

2.          Construction &
          Development Trends               6.        St. Louis
                                                Regional Advantages

3.         Hotspot Spotlight -
     Industry Growth at Auto Plant Sites   7.         Featured
                                                Real Estate Sites Map

4.         Hotspot Spotlight -
            Route 3 Corridor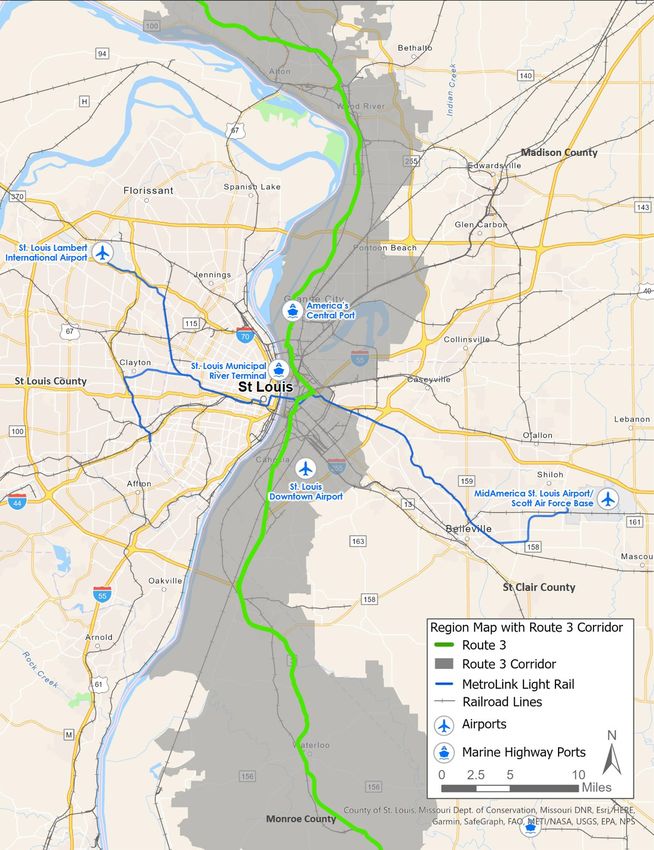
ST. LOUIS REGIONAL INDUSTRIAL
                                                                                                                                       MARKET REAL ESTATE INDICATORS

   BULK DISTRIBUTION BUILDINGS OVER 250K SF                                                                                                                                              Q2 2021

                                                                                                                                                    Madison County
                                                                                                                                                   Total Inv: 21.78msf
                           St. Charles County                                                             North County                                 Avail: 5.4%
                           Total Inv: 3.53msf                                                           Total Inv: 13.16msf
                                Avail: 2.7%                                                                Avail: 22.1%

                                                                                                     Mid County
                                                                                                 Total Inv: 0.689msf
                                                                                                       Avail: 0%

                                                                                                                   City of St. Louis
                                                             West County      *                                   Total Inv: 2.47msf
                                                                                                                     Avail: 17.5%

                                                                                                     South County
                                                                                                                                               St. Clair County
                                                                                                    Total Inv: 1.23msf
                                                                                                                                              Total Inv: 1.08msf
                                                                                                        Avail: 0%
                                                                                                                                                 Avail: 64.9%

                                                                 Jefferson County
                                                                Total Inv: 0.509msf
                                                                                                                          Monroe County
      Franklin County                                                 Avail: 0%
                                                                                                                         Total Inv: 6.00msf
     Total Inv: 0.72msf                                                                                                     Avail: 85.1%
          Avail: 0%

Source: CoStar – St. Louis MSA; Existing industrial buildings over 250,000 SF, over 24’ Clear; Single Story
West County, MO does not have inventory fitting the parameters on CoStar
                                                                                                                                                             1 Industrial Real Estate Market Indicators
ST. LOUIS REGIONAL INDUSTRIAL
                                                                                                                                   MARKET REAL ESTATE INDICATORS
          Q2 2021                             AVERAGE NNN DIRECT ASKING RENT & VACANCY RATE
                                                                                                                                                    MODERN BULK INVENTORY
                                                                                                                                                       (BULK DISTRIBUTION OVER 250,000 SF)

                                                                                                                                                              TOTAL =
            Average Rent Per SF

                                                                                                                                   Total Vacant %
                                                                                                                                                      ±   51.2 msf
                                                                                                                                                    INVENTORY BREAKDOWN
                                                                                                                                                                  (BY BUILDING SF)

   BULK DISTRIBUTION
       NNN ONLY

                                                                 North County                                     Madison County
                              St. Charles County                $
                                                                 3.73/SF, NNN
                                                                                                                  $
                                                                                                                   4.03/SF, NNN
                               $
                                4.50/SF, NNN

                                                                Mid County*

                                            West County*                   City of St. Louis
                                                                           $
                                                                            6.25/SF, NNN

                                                               South County*
                                                                                                              St. Clair County
                                                                                                              $
                                                                                                               3.75/SF, NNN

                                           Jefferson County*
                                                                              Monroe County
                                                                              $9.60/SF, NNN
   Franklin County*

Source: CoStar – St. Louis MSA; Existing industrial buildings over 250,000 SF, over 24’ Clear; Single Story
*Only reported NNN asking rents were used
                                                                                                                                                    1 Industrial Real Estate Market Indicators
CONSTRUCTION &
                                                                                                                                      DEVELOPMENT TRENDS

                         TOTAL CONSTRUCTION OVER 100K SF                                                                                     SPECULATIVE DEVELOPMENT
     ST. LOUIS REGIONAL INDUSTRIAL MARKET - HISTORIC ACTIVITY                                                                             SPEC & BTS CONSTRUCTION SINCE 2017
        7,000,000                                                                                                                 7,000,000

                                                                                                               Total SF of Activity
                    6,000,000                                                                                                    6,000,000
Total Building SF

                    5,000,000                                                                                                    5,000,000
                    4,000,000                                                                                                   4,000,000
                    3,000,000                                                                                                    3,000,000
                    2,000,000                                                                                                    2,000,000
                    1,000,000                                                                                                         1,000,000
                            0 Q2 2017            Q2 2018            Q2 2019           Q2 2020   Q2 2021                                      0    2017   2018     2019       2020       2021*
                                 Construction Completions                       Currently Under Construction                                                    BTS        Spec

                          TOP MODERN BULK DEVELOPERS*
                                       ACTIVITY OVER 5 YEARS
                     5
                     4
       Millions SF

                     3

                     2

                     1

 Source: Steadfast City; CoStar (St. Louis, MO-IL MSA, Industrial buildings over 100,000 SF)
 * Includes 2021 completions and under construction activity
                                                                                                                                                         2 Construction & Development Trends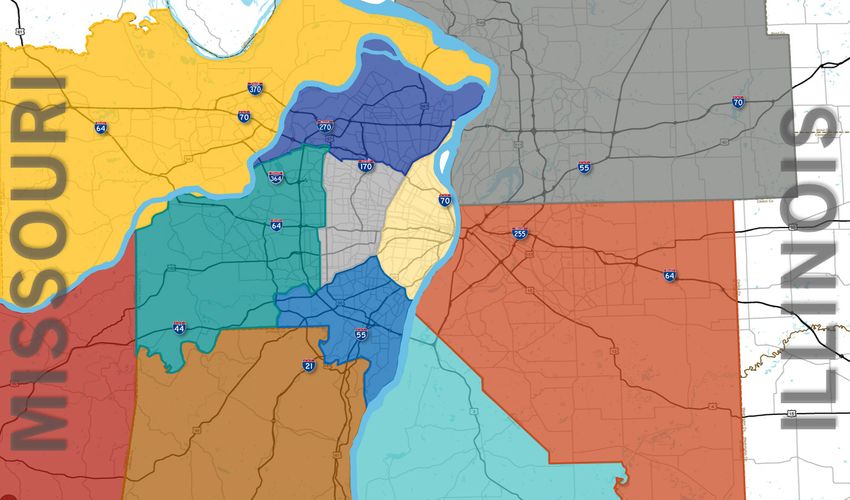
CONSTRUCTION &
                                                                                          DEVELOPMENT TRENDS

  Q2 2021
  MAJOR NATIONAL INSTITUTIONAL GRADE OWNERS BY SUBMARKET
                                                              North County
                       St. Charles County                                                                  Madison County

                                                                                               270

                                                          Mid County

                                                                         St. Louis City
                                   West County

                                                          South County                               St. Clair County

                                       Jefferson County
                                                                               Monroe County
     Franklin County

Source: CoStar

                                                                                                             2 Construction & Development Trends
HOTSPOT SPOTLIGHT:
                        INDUSTRY GROWTH AT AUTO PLANT SITES

                                  A STORY OF THE
Locational                ST. LOUIS REGION’S RESILIENCE
Advantages
                     The attractiveness of the St. Louis region is highlighted
                     through its automotive manufacturing history.
Business             The General Motors Wentzville Assembly Plant
Climate              in St. Charles is vibrant and growing with a recent
                     announcement of a $1.5B investment into the facility by
                     GM in 2019.

Public-Private       Between 2000 and 2010, both the Ford Motor Plant in
Partnerships         Hazelwood and the Chrysler Auto Plant in Fenton closed,
                     leaving empty and blighted sites. The locations of both
                     plants along key intermodal sites and the flexibility &
                     ingenuity of public-private partnerships allowed national
Broker & Developer   developers to see the potential of the sites and attract
Sophistication       impactful tenants at the newly constructed, modern
                     industrial business parks.

                                                Hotspot Spotlight -
                                              3 Industry Growth at Auto Plant Sites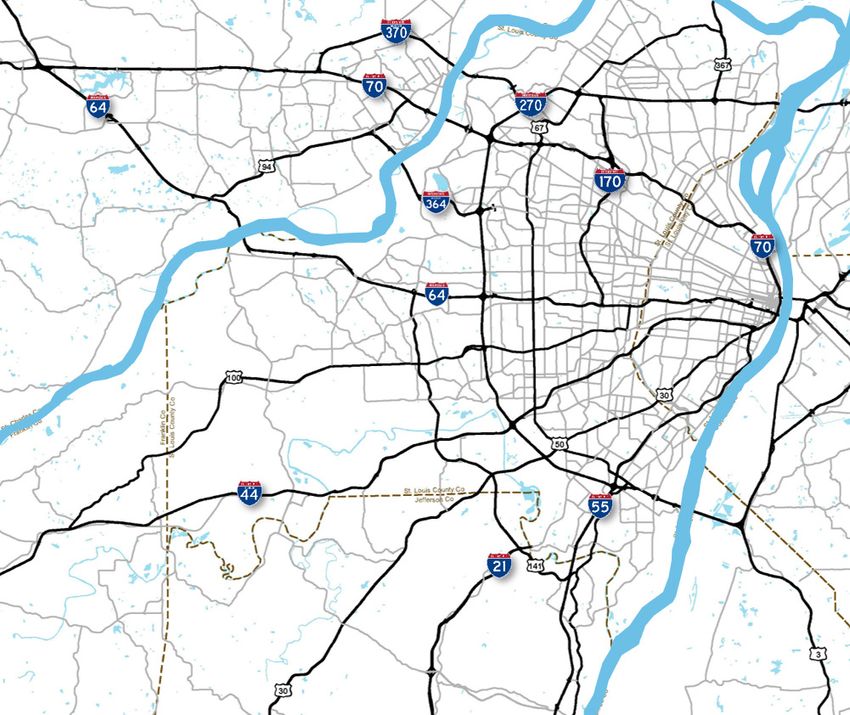
HOTSPOT SPOTLIGHT:
                                          INDUSTRY GROWTH AT AUTO PLANT SITES

                                         AVIATOR      A STORY OF THE ST. LOUIS
                                      BUSINESS PARK     REGION’S RESILIENCE

                                                      General Motors
    GENERAL MOTORS                                    Wentzville Assembly Center
    ASSEMBLY CENTER                                    » 500 Acre Auto Plant
   11% FASTER GROWTH                                   » 4,330 Jobs
The Transportation and Warehousing                     » +30,300 Total Jobs Impact
   Industry grew 11% faster in the
 5-Mile radius around the GM plant
      than the national average.                      Fenton Logistics Park
                                                      (Former Chrysler Plant)
                     FENTON                            » 150 Acre Industrial Park
                 LOGISTICS CENTER                      » 1.3M SF of New Construction
                                                       » $300MM Investment
                                                       » 2,000 Jobs
                                                      Aviator Business Park
                                                      (Former Ford Plant)
      AIRPORTS
                                                       » 160 Acre Industrial Park
      INTERMODAL FREIGHT FACILITIES
                                                       » 2.6M SF of New Construction
      INTERSTATES                                      » $250MM Investment
      MAJOR ROADWAYS                                   » 1,150 Jobs
                                                          Hotspot Spotlight -
                                                        3 Industry Growth at Auto Plant Sites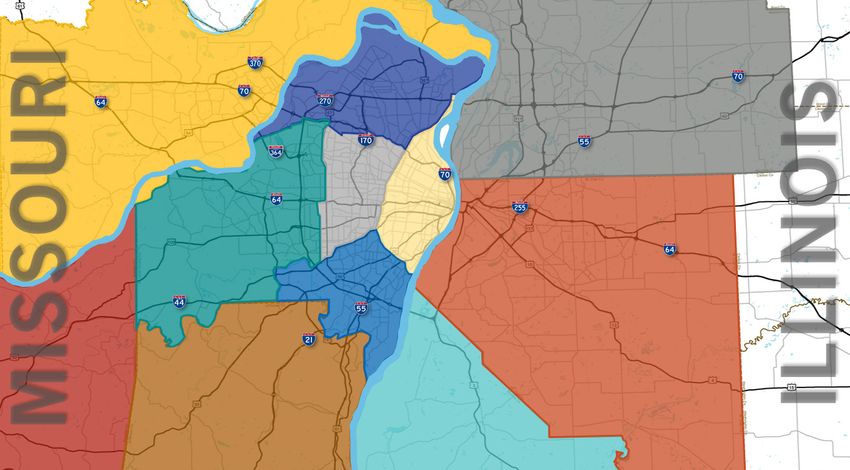
HOTSPOT SPOTLIGHT:
                                                                                                     ROUTE 3 CORRIDOR

The IL Route 3 highway is the backbone of a 60-mile long logistics                                                                      Route 3 Industrial
    and manufacturing corridor with access points to six Class 1                                                                        Real Estate Sites
railroads, five airports with capacity, four interstates with national
           access, and America’s third largest inland port.

                                                                                                                                                   ILLINOIS
“The Rail service along this corridor is unique; it’s whatever a manufacturer or
rail shipper wants. You have the six Class 1 railroads you can ship with directly
or through the Terminal Railroad. There’s five intermodal facilities, if not on the
border within a five-to ten-minute drive. And what we do is we’re that last mile
service provider. So, we provide a safe interchange of goods between Class 1
railroads and their end users. The river, the rail and the interstate access in this
area truly give you the best multimodal options.”
     - Matt Whitney, Dir. of Business & Industrial Dev. for Terminal Railroad Assoc. of St. Louis

“The Route 3 corridor from Dupo to Alton has some very favorable zoning
ordinances in communities that are going to welcome heavy manufacturing.
The Route 3 arterial route, which is a four-lane highway, is relatively

                                                                                                    MISSOURI
uncongested and traverses parallel to the Mississippi River. It intersects
multiple interstates, rail and river access points. It has access to heavy utilities
and a skilled labor pool. And many of these communities are relatively easy to
work with and don’t have a lot of red tape to overcome.”
     - Steve Zuber, SIOR, CCIM, Principal with Barber Murphy

“When you think about the location and the infrastructure alone, this is just a
fantastic, fantastic location for site selection and new business investment.”
     - Doug Rasmussen, President & CEO of Steadfast City Economic & Community Partners

“We’ve enjoyed the fruits of the corridor and been part of it for nearly 150
years... But one thing that’s been fairly constant is we rely heavily on getting
product to us, as well as shipping our product, and being geographically located in
the Midwest, as well as having all of those transportation ways, if you will, there’s
been a huge advantage for this facility and one of the reasons we’re still here.”
     - Mike Patton, General Manager of U.S. Steel

                                                                                                                   Hotspot Spotlight:
                                                                                                                 4 Route 3 Corridor
INDUSTRIAL JOB-READY
WORKFORCE STATISTICS
OCCUPATIONAL EMPLOYMENT ST. LOUIS MSA MSA COMPARISON
& WAGE ESTIMATES # Workers Annual Mean Wage TOTAL NUMBER OF WORKERS
All Occupations 1,300,210 $54,210
Production Occupations 77,060 $43,950
Estimated total employment rounded to the nearest 10
First-Line Supervisors of Production
5,390 $67,140
and Operating Workers
Machinists 3,670 $51,830
Packaging and Filling Machine
(excludes self-employed)
5,510 $42,450
Operators and Tenders
Computer Numerically Controlled
2,250 $43,650
Tool Operators
Computer Numerically Controlled
310 $70,340
Tool Programmers
Production Workers, All Other 1,310 $37,390
Transportation and Material Moving
105,210 $39,310
Occupations
First-Line Supervisor of Transportation
3,660 $62,190
and Material Moving Workers
Heavy and Tractor-Trailer Truck
17,760 $50,700
Drivers
Light Truck Drivers 8,340 $43,390
Industrial Truck and Tractor Operators 6,660 $37,710
Laborers and Freight, Stock, and
25,600 $35,660
Material Movers, Hand
Stockers and Order Fillers 20,310 $32,010
Source: May 2020 Metropolitan and Nonmetropolitan Area Occupational Employment and Wage Estimates https://www.bls.gov/oes/current/oessrcma.htm
5 Industrial Job-Ready Workforce StatisticsINDUSTRIAL JOB-READY
WORKFORCE STATISTICS
MEAN AVERAGE WAGE COMPARISON
ST. LOUIS, MO-IL VS USA
Mean Average Wage
Source: May 2020 Metropolitan and Nonmetropolitan Area Occupational Employment and Wage Estimates https://www.bls.gov/oes/current/oessrcma.htm
5 Industrial Job-Ready Workforce StatisticsST. LOUIS REGIONAL
ECONOMIC ADVANTAGES
MODES OF TRANSPORTATION
AMERICA’S FOUR INTERSTATES FIVE AIRPORTS SIX
THIRD LARGEST WITH NATIONAL WITH CLASS I
INLAND PORT ACCESS CAPACITY RAILROADS
Northernmost lock-free/ The St. Louis region’s The region includes National railroads providing
ice-free access on the system of interstates two international cargo connection to regional and
Mississippi River to and (I-70, I-44, I-55, and I-64) airports (St. Louis Lambert global markets, including
from the Gulf of Mexico, allow for one-day drive or International Airport and BNSF, CN, KCS, NS, CSX
making the region the less to major cities such MidAmerica St. Louis and UP, utilizing a single
3rd largest port for as Chicago, Memphis, Airport) with rail access, switching carrier through
domestic tonnage, among Nashville, Kansas City foreign trade zones and the Terminal Railroad
all inland ports in the U.S. and Columbus. developable land. Association of St. Louis.
SAMPLE OF RECENTLY FUNDED PROJECTS:
$600 MIL I-270 from I-70 (MO) to IL Rte 157 (IL) (Partially Funded) $32 MIL I-70 Interchange Expansion of Improvement Projects (MO)
$222 MIL TRRA Merchants Rail Bridge over Mississippi River (MO/IL) $20 MIL IL Rte 158 (Air Mobility Drive) Expansion from IL Rte 161 to IL Rte 177 (IL)
$115 MIL IL Rte 3 Access in St. Clair County (IL) (Partially Funded) $13 MIL America’s Central Port Intermodal Improvements (IL) (Partially Funded)
$80 MIL IL Rte 3 Connector in St. Clair County (IL) $9 MIL Union Pacific Railroad Lenox Tower Replacement & Track Realignment (IL)
$62 MIL I-70 Outer Road in St. Charles County – (MO) (Partially Funded) $8 MIL I-70 Additional Lane from TR Hughes Blvd to Bryan Rd (MO) (Partially Funded)
$42 MIL I-255 / Davis Street Ferry Road Interchange (IL) $4 MIL Earth City Access (MO)
$36 MIL I-64 Improvements - Green Mt Rd to IL Rte 158 (IL) $3 MIL North Park Access Improvements (MO)
$34 MIL North Riverfront Commerce Corridor Improvements (MO) (Partially Funded) $2.4 MIL J.S. McDonnell Connector Access Improvements (MO)
6 St. Louis Regional Economic AdvantagesFEATURED REAL ESTATE SITES MAP
CAPITALIZE ON THE ADVANTAGE
OF THE ST. LOUIS REGION
The St. Louis region is rich with industrial parks and development-ready land for all types of industrial or corporate use.
Industrial Real
Estate Sites
CLICK ON THE MAP OR VISIT THEFREIGHTWAY.COM
for details on sites that are ready for you and your business.
7 Featured Real Estate Sites MapST. LOUIS REGIONAL
REAL ESTATE
Market Indicators & Workforce Statistics
Q2 2021
MARY C. LAMIE P.E.
Executive Vice President of Multi Modal Enterprises
Bi-State Development
314.982.1562 | mclamie@bistatedev.org
T H E F R E I G H T WAY.C O M
Disclaimer: Information contained herein has been obtained from sources believed to be reliable. While every reasonable effort has been made to ensure its accuracy, we cannot guarantee it. No responsibility is
assumed for any inaccuracies. Readers are encouraged to consult their professional advisors prior to acting on any of the material contained in this report.You can also read