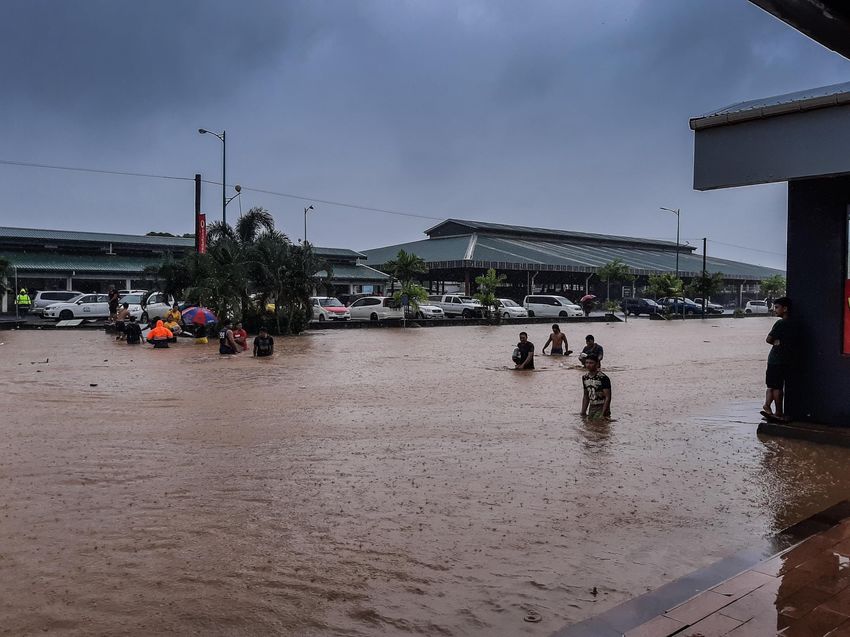
Monthly Climate Bulletin - May 2021 - ISSN: 2617-3565 Photo Credit: Anetone Sagaga & Samoa Met (December 2020 Samoa Flooding) - SPREP Virtual Library
←
→
Page content transcription
If your browser does not render page correctly, please read the page content below
Monthly Climate Bulletin
May 2021

                                                                   ISSN: 2617-3565
           Photo Credit: Anetone Sagaga & Samoa Met (December 2020 Samoa Flooding)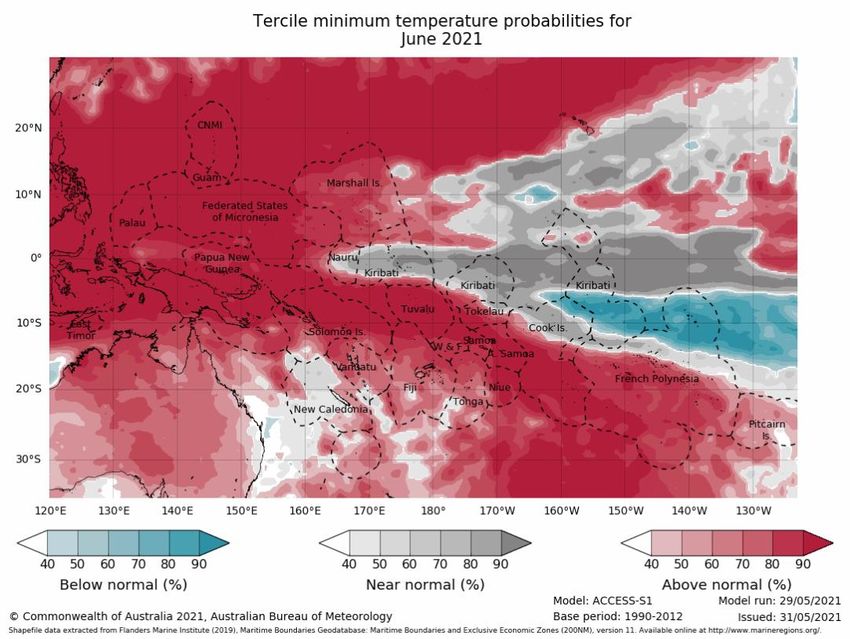
CONTENTS

Summary                        2
El Niño–Southern Oscillation   3
Madden–Julian Oscillation      4
Wind                           5
Cloud and Rainfall             6
Oceanic Conditions             9
Mean Sea Level Pressure        13
Model Outlooks                 14
Cyclones                       17
Further Information            18

1 | Monthly Climate Bulletin
SUMMARY
Issued 11 June 2021

•     El Niño Southern Oscillation (ENSO) remains neutral. Climate model outlooks in-
      dicate this neutral phase will last at least until September.

•     A moderate to strong Madden-Julian Oscillation (MJO) pulse weakened prior
      moving into western Pacific.

•     The Intertropical Convergence Zone (ITCZ) was active and shifted north, while
      the South Pacific Convergence Zone (SPCZ) was shifted to the southwest.

•     The sea surface temperature anomaly pattern in May shows SSTs were close to
      average across most of the equatorial Pacific Ocean.

•     Coral bleaching status is 'no stress' or 'watch' for almost all countries with patches
      of warning north of PNG.

•     A notable sea level anomalies of +250mm-300mm observed in the Solomon Is-
      lands.

•     For June to August 2021, the dynamical models (as well as SCOPIC) agree on
      above normal rainfall for the Highlands and, Southern regions of PNG, New Cale-
      donia, Vanuatu, Fiji, Tonga, Niue and southern Cook Islands. The models also
      agree on below normal rainfall for Rotuma, Kiribati (in southern hemisphere), Tu-
      valu, northern Cook Islands, the northern half of French Polynesia, and Pitcairn
      Island.

    © SPREP 2021
    This copyright statement protects our work from commercial exploitation, while ensuring that the information can be freely used for scien-
    tific, educational or research purposes, provided SPREP and the source document are acknowledged.

    2 | Monthly Climate Bulletin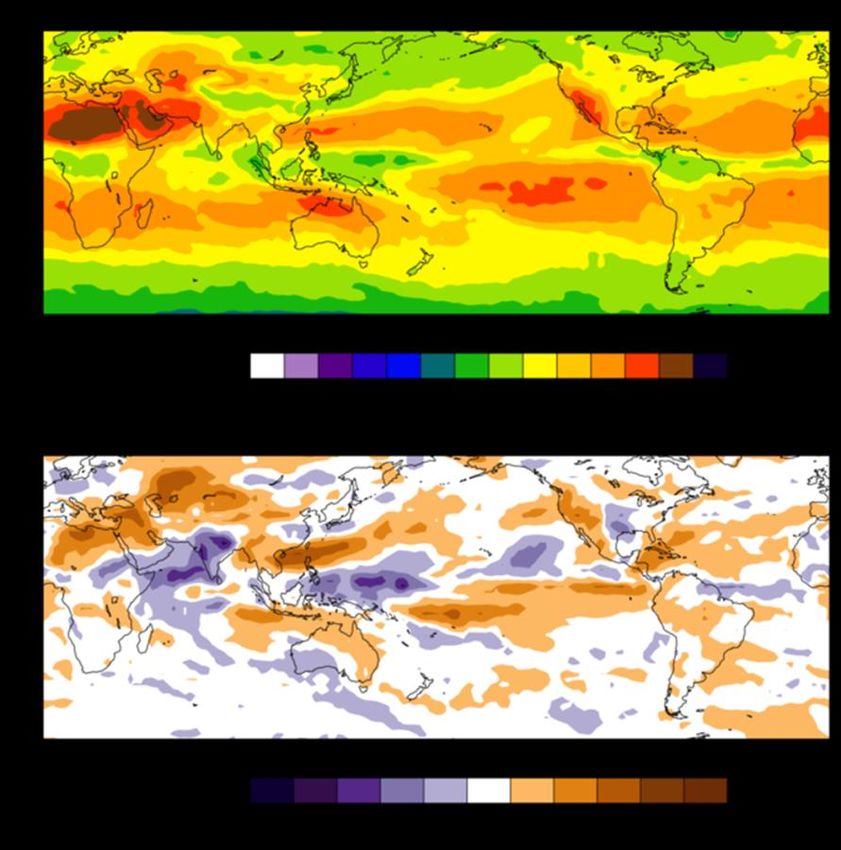
EL NIÑO–SOUTHERN OSCILLATION
Climate drivers currently neutral

 Click link to access     Climate Driver Update issued on 08 June 2021

  The El Niño Southern Oscillation (ENSO) remains neutral with all oceanic and atmospheric indi-
  cators within the neutral range. Climate model outlooks show this neutral ENSO state is likely to
  continue until at least September.

  The Indian Ocean Dipole (IOD) is currently neutral, although the index has been below the nega-
  tive IOD threshold for three consecutive weeks. Large parts of the eastern Indian Ocean are
  warmer than average, with some cooler than average water near the Horn of Africa. The consen-
  sus of international climate model outlooks suggest the IOD is most likely to remain neutral dur-
  ing the first part of the southern winter, although three of the five models suggest negative IOD
  conditions could develop over southern winter or spring. The accuracy of IOD forecasts is still
  low in early June but will increase significantly by the end of the month.

  The 30-day Southern Oscillation Index (SOI) for the 30 days ending 06 June was -0.4. The 90-
  day SOI value was +1.9. Both are within ENSO neutral thresholds.

   3 | Monthly Climate Bulletin
EL NIÑO–SOUTHERN OSCILLATION
Climate drivers currently neutral

  Click link to access            Climate Driver Update issued on 08 June 2021

Bureau of Meteorology NINO3.4 ENSO Model Outlooks for June, August and October

                 Bureau of Meteorology NINO3.4 International Model Outlooks

 Bureau of Meteorology summary of international model outlooks for NINO3.4: http://www.bom.gov.au/climate/model-summary/#tabs=Pacific-Ocean

   4 | Monthly Climate Bulletin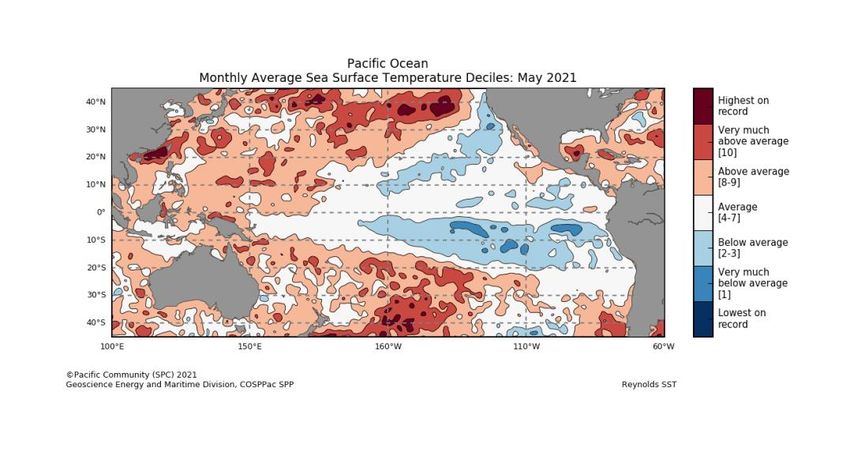
MADDEN–JULIAN OSCILLATION
Click link to access            Weekly Tropical Note [Issued on Tuesday 01 June 2021]

During early May, Madden -Julian Oscillation (MJO)
was generally weak until a moderately strong pulse
of the Madden-Julian Oscillation (MJO), which
tracked across Maritime Continent longitudes (north
of Australia) during the past fortnight, recently
weakened prior to moving into the western Pacific
region. The pulse has since re-strengthened but
international climate models generally agree that
the MJO pulse will again weaken. In the next fort-
night, the MJO is predicted to remain weak over the
central to eastern Pacific Ocean. At this time of the
year, an MJO pulse over the western to central Pa-
cific typically increases the likelihood of above-
average cloudiness and rainfall across the tropical
western Pacific Ocean, while leading to below-
average rainfall across Australia's northeast.

This is an abbreviated version of the Weekly Tropi-
cal Note. Click on the Weekly Tropical for more in-
formation

 5 | Monthly Climate Bulletin
WIND
Click link to access            Wind plots link

The trade winds in May were stronger than average over most of the equatorial Pacific for most
of the month. The main exception was in the western Pacific where they were a little weaker
than normal late in the month.
During La Niña events, there is a sustained strengthening of the trade winds across much of
the tropical Pacific, while during El Niño events there is a sustained weakening, or even rever-
sal, of the trade winds.

 6 | Monthly Climate Bulletin
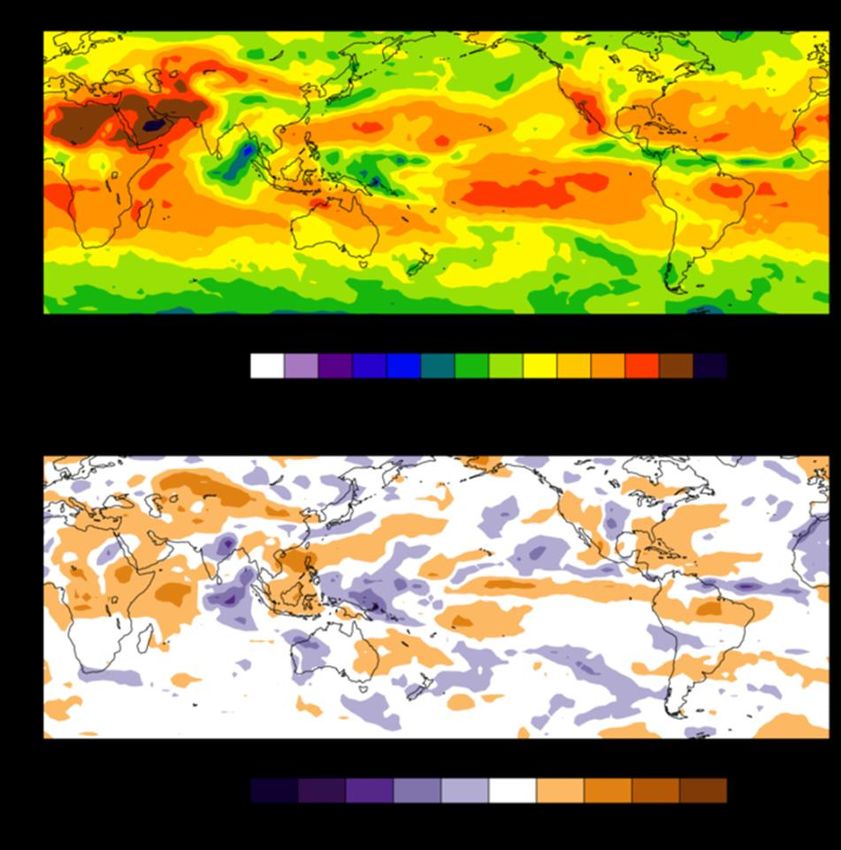
CLOUD AND RAINFALL
Click link to access            OLR

The May 30-day OLR total and anomaly maps suggest the Intertropical Convergence Zone
(ITCZ) was active and shifted a little north of its normal position. The South Pacific Conver-
gence Zone (SPCZ) was also active and shifted to the southwest, affecting Vanuatu, Fiji, Ton-
ga, Niue, and the southern Cook Islands.

Note: Global maps of OLR below highlight regions experiencing increased or decreased cloudi-
ness. The top panel is the total OLR in Watts per square metre (W/m 2) and the bottom panel is
the anomaly (current minus the 1979-1998 climate average), in W/m2. In the bottom panel, neg-
ative values (blue shading) represent above normal cloudiness while positive values (brown
shading) represent below normal cloudiness.

                    OLR Total and Anomalies, 30 Day OLR

 7 | Monthly Climate Bulletin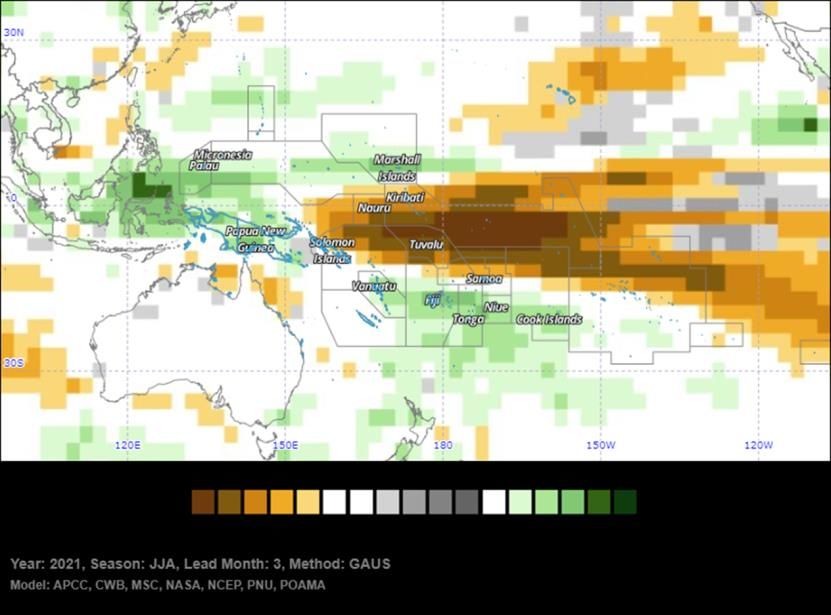
OLR Total and Anomalies, 7 Day OLR

8 | Monthly Climate Bulletin
30-Day Rainfall Anomalies

NOAA Climate Prediction Centre - NCEP CMAP precipitation:
https://ww.cpc.ncep.noaa.gov/products/Global_Monsoons/Global-Monsoon.shtml

9 | Monthly Climate Bulletin
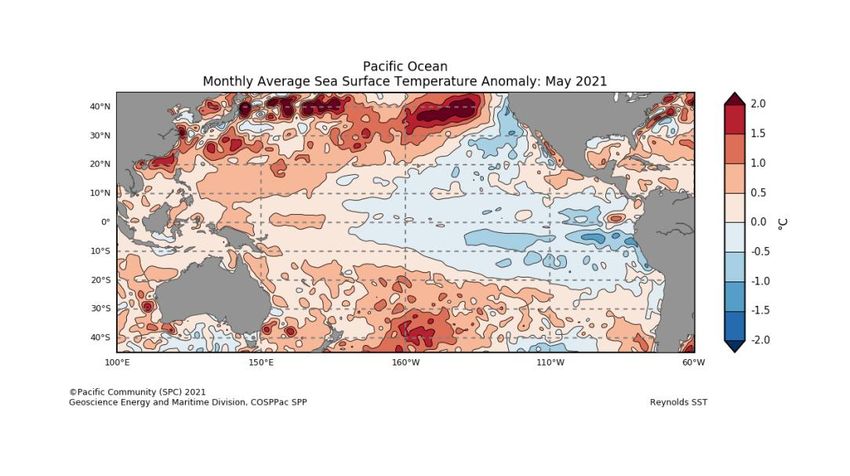
OCEAN CONDITIONS
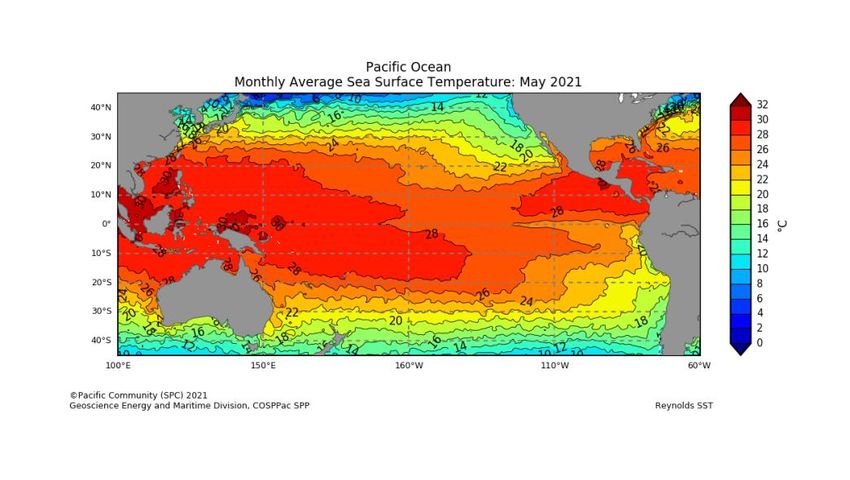
SEA SURFACE TEMPERATURE
Click link to access Pacific Community COSPPac Ocean Portal
The SST map for May shows SSTs were close to average across most of the equatorial Pacific
Ocean, although cool anomalies remained in some small areas of the tropics in the east of the
Basin, extending along the coastline of South America. These cool anomalies were noted in Ni-
ue, Cook Islands and Fiji. . SSTs were warmer than average in waters around the west and
much of the south of Australia.
In terms of the deciles, regions of above average (deciles 8-9) for May occurred across majority
of the COSPPac countries from Palau to southern Cook Islands. Regions of very much above
average (deciles 10) SSTs spanned across parts of north and south PNG, Solomon Islands, Va-
nuatu, Fiji, Niue, southern Cook Islands, and southern French Polynesia. In contrast, below av-
erage (deciles 2-3) SSTs were observed central and eastern Kiribati.
Mean Sea Surface Temperature
10 | Monthly Climate BulletinOCEAN CONDITIONS
Click link to access SEA SURFACE TEMPERATURE
Anomalous Sea Surface Temperature
Sea Surface Temperatures Deciles
11 | Monthly Climate BulletinOCEAN CONDITIONS
SUB SURFACE
The four-month sequence of equatorial Pacific sub-surface temperature anomalies (to May)
shows a pattern consistent with the return to a neutral ENSO state. For May, the weak warm
anomalies were present across much of the central and western equatorial Pacific, mostly be-
tween 75m and 150m depth. These warm anomalies also weakened in May.
Weekly Temperatures Mean and Anomalies Monthly Temperatures Anomalies
Bureau of Meteorology Sea Temperature Analy-
sis: http://www.bom.gov.au/marine/sst.shtml
TAO/TRITON Data Display: http://www.pmel.noaa.gov/tao/jsdisplay/
12 | Monthly Climate BulletinOCEAN CONDITIONS
CORAL BLEACHING
The daily Coral Bleaching Alert for 04th June 2021 shows 'No Stress or Watch' for much of the COSPPac
partner countries, peaking at 'Warning' and Alert Level 1 for north PNG. The four weeks Coral Bleaching
Outlook to 27th June shows 'No Stress' for most of the countries with a 'Watch' alert for countries west of
the dateline.
Daily Coral Bleaching Alert
(Source: Pacific Community COSPPac Ocean Porta Coral Bleaching)
4-Weeks Coral Bleaching Outlook
(Source: Pacific Community COSPPac Ocean Portal)
13 | Monthly Climate BulletinOCEAN CONDITIONS
OCEAN SURFACE CURRENTS AND SEA LEVEL
OCEAN SURFACE CURRENTS AND SEA LEVEL
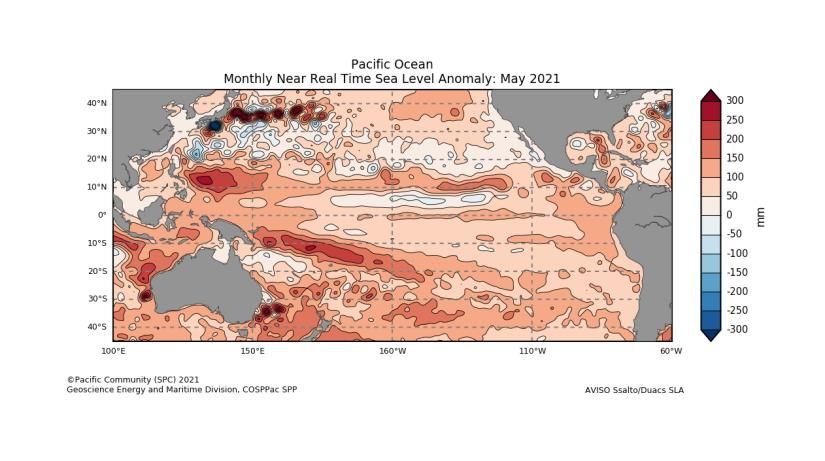
Sea level was above normal for most of the western Pacific region. The highest anomalies above +250mm
were in the Solomon Islands. Sea levels were above normal (+100mm to +200mm) in Palau, FSM, RMI,
PNG to southern Cook Island. Parts of PNG, Vanuatu, Tonga and Kiribati EEZ continued with near normal
to below normal conditions.
Ocean Surface Current (Last 7-Days)
Monthly Sea Level Anomalies
Source: Pacific Community COSPPac Ocean Portal
14 | Monthly Climate BulletinMEAN SEA LEVEL PRESSURE
The May mean sea level pressure (MSLP) anomaly map shows negative anomalies over southern
Vanuatu, Fiji and central and eastern Kiribati. Positive anomalies were present over the Coral Sea
region.
Areas of above (below) average MSLP usually coincide with areas of suppressed (enhanced) con-
vection and rain throughout the month.
Mean
Anomalous
Bureau of Meteorology South Pacific Circulation Patterns: http://www.bom.gov.au/cgi-bin/
climate/cmb.cgi?variable=mslp&area=spac&map=anomaly&time=latest
15 | Monthly Climate BulletinSEASONAL RAINFALL OUTLOOK
June—August 2021
The ACCESS-S model forecast for June 2021 strongly favours below normal rainfall for Palau, western and northern
FSM, Guam, CNMI, central and northern Marshall Islands, Solomon Islands, Rotuma, Nauru, much of Kiribati
(especially south of the equator), Tuvalu, Tokelau, Samoa, the northern Cook Islands, central and northern French
Polynesia and Pitcairn Island. Above normal rainfall is favoured for the Highlands region of PNG, southern Marshall
Islands, most parts of Fiji, Tonga, Niue and parts of southern Cook Islands and far southern French Polynesia.
The three-month rainfall outlook (June-August) shows a strong dry signal affecting CNMI, Guam, FSM, central and
northern Marshall Islands, Rotuma, Nauru, much of Kiribati (especially in the southern hemisphere), Tuvalu, Samoa,
Tokelau, northern Cook Islands, French Polynesia and Pitcairn Island. In contrast, the models show an increased
chance of wetter in Palau, PNG, southern Marshall Islands, New Caledonia, Vanuatu, Fiji, Tonga, Niue and southern
Cook Islands. Above normal maximum and minimum temperatures are favoured for many COSPPac countries, ex-
cept for some areas east of 165°E, namely Nauru, Kiribati, northern Tuvalu, Tokelau, northern Cook Islands, plus
northern and central French Polynesia, where near-normal to below normal temperatures are favoured.
Monthly ACCESS-S Maps
The Copernicus multi-model outlook for June to August favours below normal rainfall for the northern PNG Islands,
western Solomon Islands, central Kiribati, Tuvalu, Tokelau, northern and central Cook Islands, northern and central
French Polynesia, and Pitcairn Island. Above normal rainfall is favoured for eastern FSM, southern Marshall Islands,
Highlands, southern and Momase regions of PNG, New Caledonia, Vanuatu, Fiji, Tonga, Niue and southern Cook
Islands.
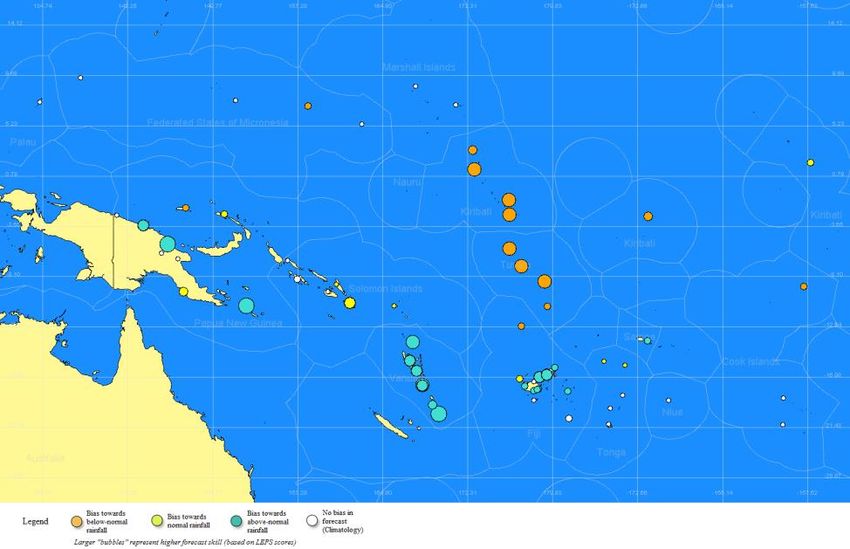
The SCOPIC statistical model for June to August favours below normal rainfall for parts of New Guinea Islands, Kiri-
bati, Tuvalu, Rotuma and northern Cook Islands. Above normal rainfall is favoured for parts of southern and
Momase regions of PNG, Vanuatu, Fiji, and Samoa.
The APEC Climate Centre multi-model for June to August favours below normal rainfall for western and northern
regions of the Solomon Islands, Nauru, Tuvalu, Kiribati, Rotuma, Samoa, Tokelau, northern Cook Islands, and cen-
tral to northern French Polynesia. Above normal rainfall is favoured for Palau, most of FSM and the Marshall Islands,
most of PNG, Vanuatu, Fiji, Tonga, Niue, southern Cook Islands and parts of southern French Polynesia.
For June to August 2021, the dynamical models (as well as SCOPIC) agree on above normal rainfall for the High-
lands and, Southern regions of PNG, New Caledonia, Vanuatu, Fiji, Tonga, Niue and southern Cook Islands. The
models also agree on below normal rainfall for Rotuma, Kiribati (southern hemisphere), Tuvalu, northern Cook Is-
lands, and the northern half of French Polynesia.
16 | Monthly Climate BulletinSEASONAL TEMPERATURE OUTLOOK
June—August 2021
Monthly ACCESS-S Maps
17 | Monthly Climate BulletinSEASONAL RAINFALL OUTLOOK
June—August 2021
Seasonal ACCESS-S maps
SCOPIC
‘About SCOPIC’ www.pacificmet.net/project/climate-
and-ocean-support-program-pacific-cosppac
18 | Monthly Climate BulletinSEASONAL RAINFALL OUTLOOK
June—August 2021
Copernicus (C3S multi-system)-Rainfall
Copernicus Rainfall:https://climate.copernicus.eu/charts/
APEC Climate Information Toolkit for the Pacific: http://clikp.sprep.org/
19 | Monthly Climate BulletinTROPICAL CYCLONE
2020/2021 Season
In the southwest Pacific, the tropical cyclone season 2020-21
ended on the 30th April, 2021. The outlook for the season was
normal or slightly below normal Tropical Cyclone activity. Sev-
en named TCs formed east of the longitude of the tip of Cape ACCESS-S Weekly Forecasts –Northwest Pacific
York, Australia. The long-term seasonal average for the south-
west Pacific is nine. Three cyclones reached severe Category
3-5 status, including Yasa, one of the most intense TCs on
record in the basin. TC activity in the Western North Pacific
occurs year round. With a likely transition from La Niña to EN-
SO-Neutral in the next month or so, near-normal to below nor-
mal numbers of TCs are anticipated.
The weekly tropical cyclone forecast from the ACCESS-S
model shows some high risk in the weeks beginning 12 June
and ending 18 June 2021 for the northwest Pacific, especially
in areas around the Philippines.
The tropical cyclone season outlook for 2020-21 is available
via: http://www.bom.gov.au/climate/cyclones/south-pacific/
ACCESS-S Weekly Forecasts –Southwest Pacific
Individual Model Links
UKMO Global long-range model probability maps: http://
www.metoffice.gov.uk/research/climate/seasonal-to-decadal/gpc-outlooks/
glob-seas-prob
ECMWF Rain (Public charts) - Long range forecast: http://www.ecmwf.int/en/
forecasts/charts/seasonal/rain-public-charts-long-range-forecast
POAMA Pacific Seasonal Prediction Portal: http://poama.bom.gov.au/
experimental/pasap/index.shtml
APEC Climate Center (APCC): http://www.apcc21.org/eng/service/6mon/ps/
japcc030703.jsp
NASA GMAO GEOS-5:http://gmao.gsfc.nasa.gov/research/ocean/
NOAA CFSv2:http://www.cpc.ncep.noaa.gov/products/CFSv2/
CFSv2seasonal.shtml
IRI for Climate and Society: http://iri.columbia.edu/our-expertise/climate/
forecasts/seasonal-climate-forecasts/
20 | Monthly Climate BulletinOTHER INFORMATION
Southern Oscillation Index
The Southern Oscillation Index, or SOI, gives an indication of the development and intensity of El Niño and
La Niña events across the Pacific Basin. The SOI is calculated using the difference in air pressure between
Tahiti and Darwin. Sustained negative values of the SOI below −7 often indicate El Niño episodes. These
negative values are usually accompanied by sustained warming of the central and/or eastern tropical Pacific
Ocean, and a decrease in the strength of the Pacific Trade Winds. Sustained positive values of the SOI
greater than +7 are typical of La Niña episodes. They are associated with stronger Pacific Trade Winds and
sustained cooling of the central and eastern tropical Pacific Ocean. In contrast, ocean temperatures to the
north of Australia usually become warmer than normal.
Multivariate ENSO Index (MEI)
The Climate Diagnostics Center Multivariate ENSO Index (MEI) is derived from a number of parameters
typically associated with El Niño and La Niña. Sustained negative values indicate La Niña, and sustained
positive values indicate El Niño.
20 degrees Celsius Isotherm Depth
The 20°C Isotherm Depth is the depth at which the water temperature is 20°C. This measurement is im-
portant, as the 20°C isotherm usually occurs close to the thermocline, the region of most rapid change of
temperature with depth, or the division between the mixed surface layer and deep ocean. A 20°C isotherm
that is deeper than normal (positive anomaly) implies a greater heat content in the upper ocean, while a
shallower 20°C isotherm (negative anomaly) implies a lower-than- normal heat content in the upper ocean.
Regions
SST measurements may refer to the NINO1, 2, 1+2, 3, 3.4 or 4 regions. These descriptions simply
refer to the spatially averaged SST for the region described. The NINO regions (shown in the figure
below) cover the following areas:
Region Latitude Longitude
NINO1 5-10°S 80-90°W
NINO2 0-5°S 80-90°W
NINO3 5°N to 5°S 150-90°W
NINO3.4 5°N to 5°S 120-170°W
NINO4 5°N to 5°S 160°E to 150°W
NOTE: NINO1+2 is the combined areas 1 and 2
21 | Monthly Climate BulletinYou can also read