Climate and Climate Changes : The physical basis - Dr. Jessica Vial Laboratoire de Météorologie Dynamique
←
→
Page content transcription
If your browser does not render page correctly, please read the page content below
Climate and Climate Changes :
       The physical basis
                    Dr. Jessica Vial
           Laboratoire de Météorologie Dynamique,
Institut Pierre Simon Laplace (centre de modélisation climatique)

                       AXA Climate
                Paris, January 16th 2020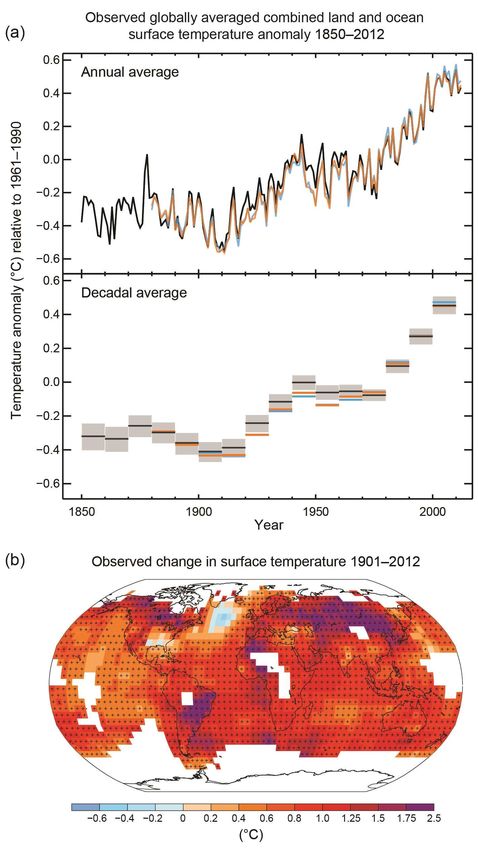
Plan

Climate and weather: The basis

Understanding climate change

Recent changes: What has been measured

Brief history of climate science

The future: Modeling, scenarios and projections

                                             Jessica Vial, Jan. 2020
What is climate ?

                    Jessica Vial, Jan. 2020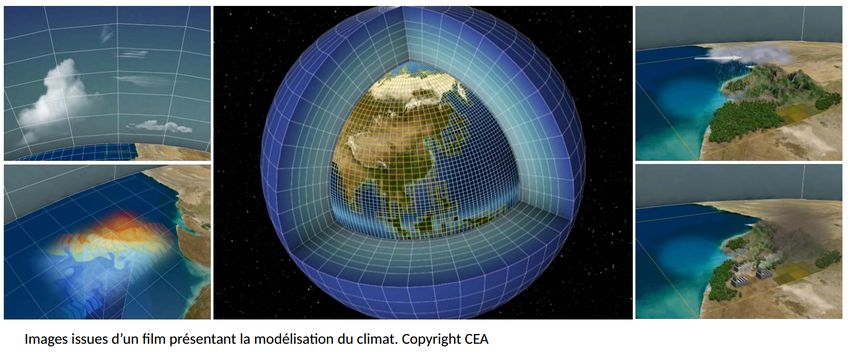
What is climate ?

A Simple definition

Ensemble of weather parameters or phenomena measured over large
geographical regions and a long period of time

                                                     Jessica Vial, Jan. 2020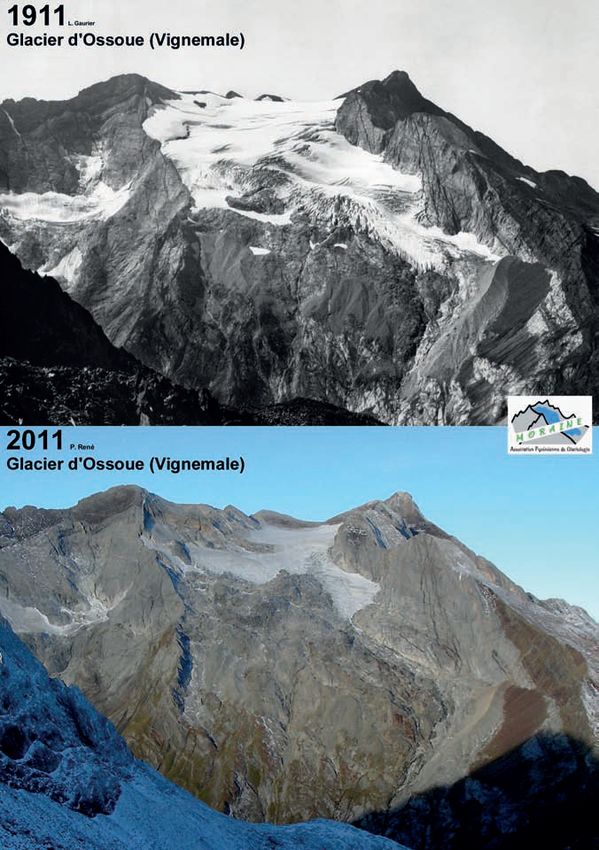
What is climate ?

A Simple definition

Ensemble of weather parameters or phenomena measured over large
geographical regions and a long period of time

           Climate   ≠ Weather

Weather forecasts are only valid locally and over short time periods !

                                                               Jessica Vial, Jan. 2020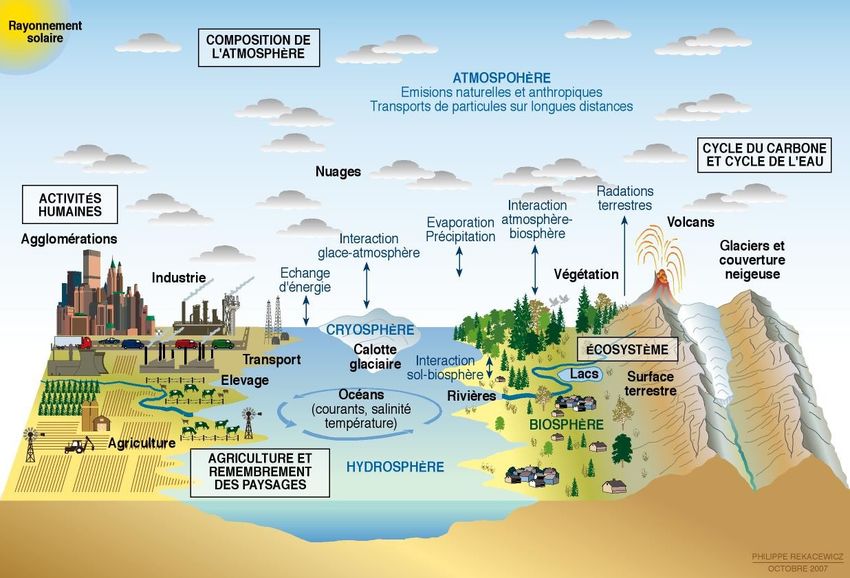
What is climate ?

                                 Temperature climatology at the Earth surface:
                                  Average annual temperature from 1961 to 1990

Data sources: CRU land surface temperature (New et al. 2002) ; NOAA OISST sea surface temperature (Reynolds et al. 2002) ;
NCEP/NCAR Reanalysis (Kalnay et al. 1996)
                                                                                                           Jessica Vial, Jan. 2020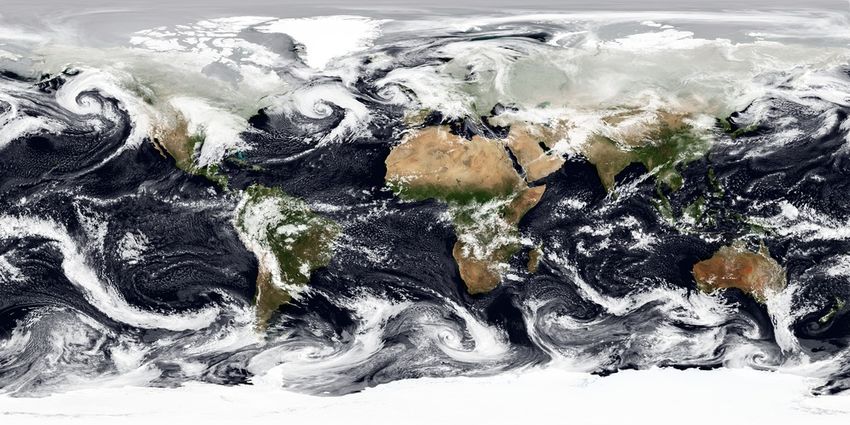
What is climate ?

                                         Precipitation climatology:
                             Over the month of January averaged from 1979 to 2013

Data : ERA-Interim (Dee et al. 2011)
Source : Karger DN et al., Scientific Data 2017                                 Jessica Vial, Jan. 2020
The sun, our climate driver !

●   Solar radiation warms up the Earth. It's the solar energy (in Watt/m2)
●   The incoming solar energy is unevenly distributed over the Earth surface:
    warming is larger over the tropics than the poles (by unit of surface).

    « Climate » comes from the Greek « klima » that means « tilt »
        → The tilt of the Earth with respect to the sun (~ 23.5°)

                                                                 Jessica Vial, Jan. 2020
The tilt of the Earth axis : at the origin of the seasons

For the Northern hemisphere:

                                                         Jessica Vial, Jan. 2020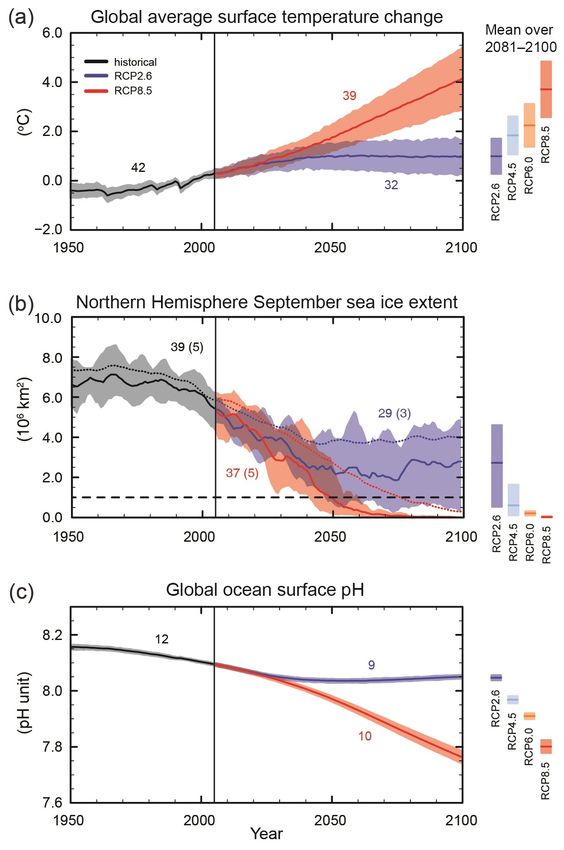
The circulation: winds and ocean currents

 They redistribute heat accross the globe,
              … from the warmest regions to the coldest

The Oceans
93% of the heat is stored in the ocean

                                            ream
                                     u lf St
                                    G

                 Océan                                      Océan
                 Pacifique                                  Indien

                                              Océan
                                              Atlantique

            « Thermohaline circulation » or « overturning meridional circulation »
                                                                                     Jessica Vial, Jan. 2020
The circulation: winds and ocean currents
They redistribute heat accross the globe,
… from the warmest regions to the coldest
The atmosphere
Courants
jets
Cellules Alizés
de Hadley de Nord-Est
Zone icale
de convergence intertrop
Alizés
de Sud-Est
General circulation of the atmosphere
Jessica Vial, Jan. 2020A myriad of factors influence the Climate system
Jessica Vial, Jan. 2020Understanding climate change...
Jessica Vial, Jan. 2020… means understanding what controls the Earth temperature
Energy exchange between the
Earth and space:
- The Earth absorbs solar radiation ;
it warms up
Solar radiation - The Earth emits infrared radiation ;
it cools down
… until an equilibrium is reached:
Solar radiation
absorbed by the Earth
=
Infrared radiation
Emitted back to space
Infrared
radiation
What is the Earth temperature under this « radiative equilibrium » ?
Jessica Vial, Jan. 2020… means understanding what controls the Earth temperature
● Radiative Equilibrium
Solar radiation temperature at the Earth
surface: -18°C
● Measured température:
+15°C
● The difference comes from
the greenhouse effect
Infrared
radiation
Jessica Vial, Jan. 2020Greenhouse effect on Earth
The Earth artmosphere absorbs
infrared radiations.
The Earth looses less energy than it
would without the atmosphere, and
therefore warms up.
Solar radiation
Atmosphere
(// a greenhouse for agriculture)
Infrared
radiation
Jessica Vial, Jan. 2020Greenhouse effect on Earth
A natural phenomenon
The atmosphere is composed of a mix of gases that absorb infrared radiations
What is the main greenhouse gas ?
Jessica Vial, Jan. 2020Greenhouse effect on Earth
A natural phenomenon
The atmosphere is composed of a mix of gases that absorb infrared radiations
Gases:
28%
CO2: 20%
CH4, O3,… : 8%
Water vapor
Clouds 55%
17%
Source: GIEC
Jessica Vial, Jan. 2020Human emissions of greenhouse gases
Nitrous
oxyde
Methane Carbon dioxyde (CO2):
¾ of the total emissions
Sources: BP statistical Review 2009 pour les consommations de combustibles fossiles ; IPCC AR4 WG 3 (2007) pour la production de
ciment et les gaz hors CO2; Houghton, The Woods Hole Research Center pour le CO 2 du à la déforestation.
Jessica Vial, Jan. 2020Evolution of CO2 emissions by source
Other sources
Natural gas
oil
Coal
Land use
Half of the CO2 emissions is absorbed by vegetation and oceans. The other
half builds up in the atmosphere.
Jessica Vial, Jan. 2020Evolution of CO2 concentration in the atmosphere
Measurements at the Mauna Loa observatory (Hawaii)
April 22, 2019
414.48 ppm
CO2 concentration (ppm)
An increase of 50 % compared to the pre-industrial era
(277 ppm en 1750)
Source: NOAA-ESRL ; Scripps Institution of Oceanography Jessica Vial, Jan. 2020Evolution of CO2 concentration in the atmosphere
Today
CO2 concentration has
never been so high in
nearly 1 million years !
Pre-industrial level
Last Glacial
Maximum
The rise of
the Homo
sapiens
800 000 years history
Source : NOAA-ESRL ; Scripps Institution of Oceanography Jessica Vial, Jan. 2020Evolution of water vapor concentration
Water vapor is not the driver of climate change,
… but it certainly has an amplifying effect
→ Clausius-Clapeyron's law
Capacity of water
to vaporize
Rudolf Benoît
Clausius Clapeyron
A warmer atmopshere can hold
more water vapor
Figure: Bohren & Albrecht
Jessica Vial, Jan. 2020Evolution of water vapor concentration
Water vapor is not the driver of climate change,
… but it certainly has an amplifying effect
The Earth warms
Human activities
Greenhouse effect ↗
(CO2, CH4,… ↗)
Positive feedback loop
Water vapor ↗
Jessica Vial, Jan. 2020Ice albedo feedback
50 – 70% of solar radiation is reflected
The ice melts :
Open water
surface ↗
Temperature ↗
Positive feedback loop
Absorption of solar
radiation ↗
Jessica Vial, Jan. 2020Recent changes
What has been measured
Jessica Vial, Jan. 2020Temperature changes at the Earth surface
Average over the whole planet
0.82°C in 2018
Reference
Period
Source: Météo-France, données du Climatic Research Unit, University of East Anglia
● Planetary warming
→ 1,1°C since 1850 (industrial revolution)
Jessica Vial, Jan. 2020Temperature changes at the Earth surface
Average over the whole planet
0.82°C in 2018
Reference
period
Source: Météo-France, données du Climatic Research Unit, University of East Anglia
Changes between 2012 and 1901
● Planetary warming
→ 1,1°C since 1850 (industrial revolution)
● « Internal variability » of climate
→ Geographic disparity
→ One single year can be locally colder !
GIEC, 2013
Jessica Vial, Jan. 2020Temperature changes at the Earth surface
Average over France
Reference period
● 2002-2011 has been the warmest decade: warming over 1°C!
● 2010: relatively cold year, while at planetary scale, it was one of the warmest of
the past 130 years! It's the internal variability.
Jessica Vial, Jan. 2020Evolution of sea level rise
Satellite measurement: 1993 - present
+ 9 (± 0,1) cm
in 25 years
● Stable level until the 1900, then +1-3 mm / year
● Mean increase of 3,34 mm / year since 1992
What are the causes?
Jessica Vial, Jan. 2020Causes of sea level rise
Thermal expansion:
→ When temperature increases,
water expands (dilatation): 1,1 (± 0,3) mm / year
Continental ice sheet:
→ Mountain glaciers melting: 0,8 (± 0,4) mm / year
→ Polar ice caps loosing mass:
Greenland: 0,33 (± 0,08) mm/year The melting of
West Antarctica: 0,27 (± 0,11) mm/year icebergs do not lead to
sea level rise!
Other factors: ground subsidence, groundwater pumping, dams, coastal
urbanism, ocean currents,...
Jessica Vial, Jan. 2020Evolution of sea level rise
Average evolution from 1992 to 2018
mm / year
Heat is not spread uniformly over the ocean
→ Water level is rising faster in some regions than others
Jessica Vial, Jan. 2020Evolution of continental ice sheet Glacier of Ossoue (Pyrénées) -59% of it's surface in 100 years -1,80 m / year thickness since 2001 Source: Observatoire National sur les Effets du Réchauffement Climatique (ONERC) Jessica Vial, Jan. 2020
Evolution of continental ice sheet

                                                               Evolution of the volume of
                                                              3 glaciers in the French Alps

              Difference between
              winter accumulation
              and summer melting

Source: Laboratoire de Glaciologie et Géophysique de l’Environnement (LGGE)                   Jessica Vial, Jan. 2020
Sea ice melting in the Arctic
Evolution of sea ice
extent in summer
-12.8% per decade
[GIEC, 2013] Jessica Vial, Jan. 2020Evolution of grape harvesting date
Jessica Vial, Jan. 2020Distribution changes of Zenopsis conchifer
Progression de la distribution de Zenopsis conchifer
55 ° 55 °
50 ° 50 ° e
n ch
Ma
200 m
45 ° 45 ° Golfe de
Gascogne
40 °N 40 °N
1960 1965 1970 1975 1980 1985 1990 1995 10° 5°W
Source : Quero,Climate science:
from the XIX century to the present day
Jessica Vial, Jan. 2020Questions around climate sciences and climate change have been
tackled before changes started occuring
[GIEC, 2013]
1824: J. B. Fourrier
- Radiative equilibrium
temperature calculation 1960: C. Keeling
- Greenhouse effect hypothesis First direct measures of CO2 1988: IPCC creation
(Mauna Loa)
1861: J. Tyndall
Greenhouse effect
measures for H2O and CO2
1896: S. Arrhénius 1970-1980: first climate
Estimation of warming in
models & climate
response to CO2 projections
Jessica Vial, Jan. 2020The 1980's decade: when we almost stopped
climate change
Nathanael Rich, New York Times: A very interesting
“Losing Earth: The decade we almost stopped climate change” article!
● In the US, in 79-89, climate change due to human activities was taken very
seriously by:
- Scientists
- Politicians An unprecedented union!
- Activists
- Major oil companies
● A real awakening to this imminent danger:
- Effort to quantify climate risk
- Production of assessment reports (“The Charney report” en 1979, amazingly prescient!)
- Meetings: alternative energy planning projects (renewable energies)
● George Bush's election as president (1989-1993) marks the end of that period:
- Gulf war: oil energy supply is number one concern of the government
- Oil companies launch a “doubt propaganda” that has a major impact on public opinion
Jessica Vial, Jan. 20201988 → today: IPCC (GIEC in French)
● IPCC: Intergovernmental panel on climate change, created in 1988 by the World
Meteorological Organization (WMO) and the United Nation Environmental
Programme (UNEP). Has currently 195 member countries.
● Its mission: Evaluate the state of the art of scientific, technical and socio-economic
knowledge around climate change
➢ Does not perform research; summarizes the work of worldwide scientific community
➢ Does not prescribe political recommendations: “policy relevant, not policy prescriptive”
● Three working groups:
I- Physical science basis of climate change
II- Impacts, adaptation and vulnerability to climate change
III- Attenuation of climate change
2013 report:
1500 pages
14 chapters
259 authors and 600 contributors
9200 cited publications
54,677 comments from 1089 experts
… next report in 2021
Jessica Vial, Jan. 2020COP, What is it ?
● The United Nations Framework Convention on Climate Change
(UNNFCC); adopted during the Earth Summit in Rio de Janeiro in 1992 (ratified
by 189 countries)
● Its mission: setting climate commitments, relying on the IPCC conclusions
→ Conference of parties (COP). Composed of member states, it meets every
year.
1997: COP 3. Signature of the Kyoto protocol. Limit the increase in greenhouse
gas emissions by industrialized countries for the period 2005-2012.
2009: Failure of the Copenhagen conference (COP 15) goal to reach a global
agreement
2015: COP 21 Paris climate conference; reach an agreement to limit global
warming to 2 degrees and, if possible, to 1.5°C
IPCC special
report, published
The 1.5° report: this target requires -7% emissions of
in 2018 greenhouse gases every year to reach:
-45 % emissions in 2030 and 0 net emissions en 2050
Jessica Vial, Jan. 2020The future :
Modeling, scenarios and projections
Jessica Vial, Jan. 2020Climate modeling
Images from a movie describing climate modeling. Copyright CEA
https://www.youtube.com/watch?v=S5f5dJyvezY
● 3D representation of the atmosphere, ocean, sea ice and continental
surface (coupling between the different modules)
● Based on physics laws and equations (radiative transfer, fluid dynamics, ...)
● Climate model: a tool to understand and “predict” climate
Jessica Vial, Jan. 2020Using climate models to understand :
Are climate variations linked to human activities or to natural
climate variability ?
Simulations with only natural Simulations with natural factors and
factors (internal variability, volcanic anthropogenic factors
erruptions, solar variations) (… + greenhouse gases and aerosols)
Temperature Anomalies (°C)
[GIEC, 2013]
Jessica Vial, Jan. 2020Using climate models for projections:
IPCC greenhouse gas emission scenarios
→ Hypotheses on the evolution of demography and economic growth worldwide
Strong emissions
“Business as usual”
Control of the emissions
Limit warming to 2°C
RCP: representative pathways of the evolution
of greenhouse gas concentration
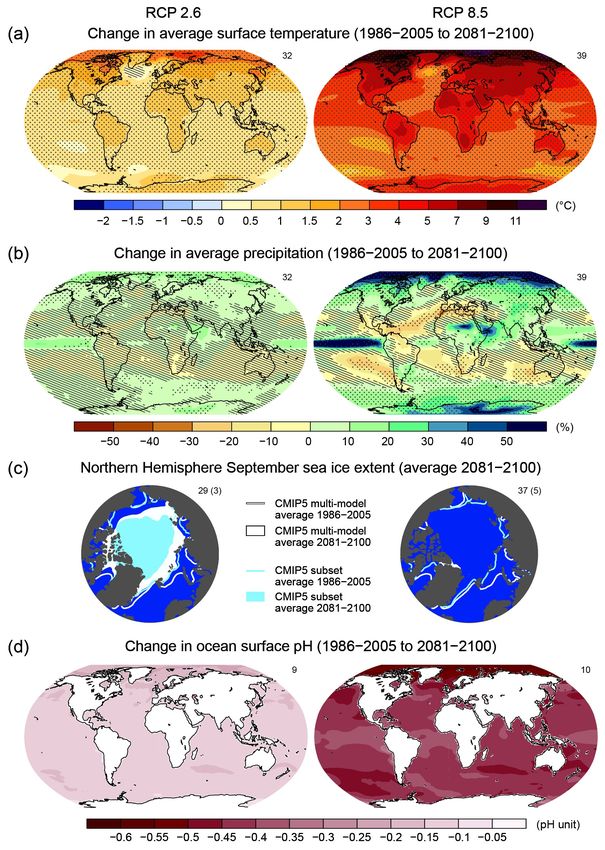
[GIEC, 2013] Jessica Vial, Jan. 2020Temperature change projections
Today:
+0.82°C
Changes at the RCP2.6 RCP8.5
end of the century
[GIEC, 2013] Jessica Vial, Jan. 2020Temperature change projections over France
winter
2003 heat wave
summer
[Terray et Boé, 2013] Jessica Vial, Jan. 2020Sea level rise projections
1m
80 cm
60 cm
40 cm
20 cm
Today: +9cm
GIEC, 2013 Jessica Vial, Jan. 2020Projections de l’extension de la glace de mer
RCP2.6 RCP8.5
No more ice!
1986-2005
2081-2100
GIEC, 2013
Jessica Vial, Jan. 2020Projections haven't changed over the past 40 years !
Surface warming projections
performed in 1980
Use of a very simple climate model:
- no ocean circulation
- no biogeochimical cycle
- partial representation of processes
(nuages, précipitations,…)
- etc…
Warming range between 3 and 4.5°C until 2100
for the worse case scenario (“fast growth”).
In comparison, IPCC estimations in 2013 range
between 3 and 5.5°C for the worse case scenario
(RCP 8.5)
1980 Hansen et al., 1981
Jessica Vial, Jan. 2020Projections haven't changed over the past 40 years !
Surface warming projections
performed in 1980
Use of a very simple climate model:
- no ocean circulation
- no biogeochimical cycle
- partial representation of processes
(nuages, précipitations,…)
- etc…
Warming range between 3 and 4.5°C until 2100
for the worse case scenario (“fast growth”).
In comparison, IPCC estimations in 2013 range
between 3 and 5.5°C for the worse case scenario
(RCP 8.5)
0.82°C in 2018
Warming projections until 2018 are very
close to the observed tendencies (in red)
1980 2018 Hansen et al., 1981
RealClimate, 2012
Jessica Vial, Jan. 2020Conclusions
Global warming is unequivocal, and human influence is
clearly established.
Since the 1950s, a lot of observed changes are unprecedented
since centuries, even milleniums.
Climate projections show that these changes could continue and
sometimes amplify by the end of the century.
Limiting warming to 1,5 or 2°C requires a radical reduction
in the emissions of CO2.
Jessica Vial, Jan. 2020You can also read