Spring Runoff Forecast - March 3, 2020 - Water Security Agency
←
→
Page content transcription
If your browser does not render page correctly, please read the page content below
Spring Runoff Forecast
                           March 3, 2020

Prepared by: Flow Forecasting & Operations Planning - Water Security Agency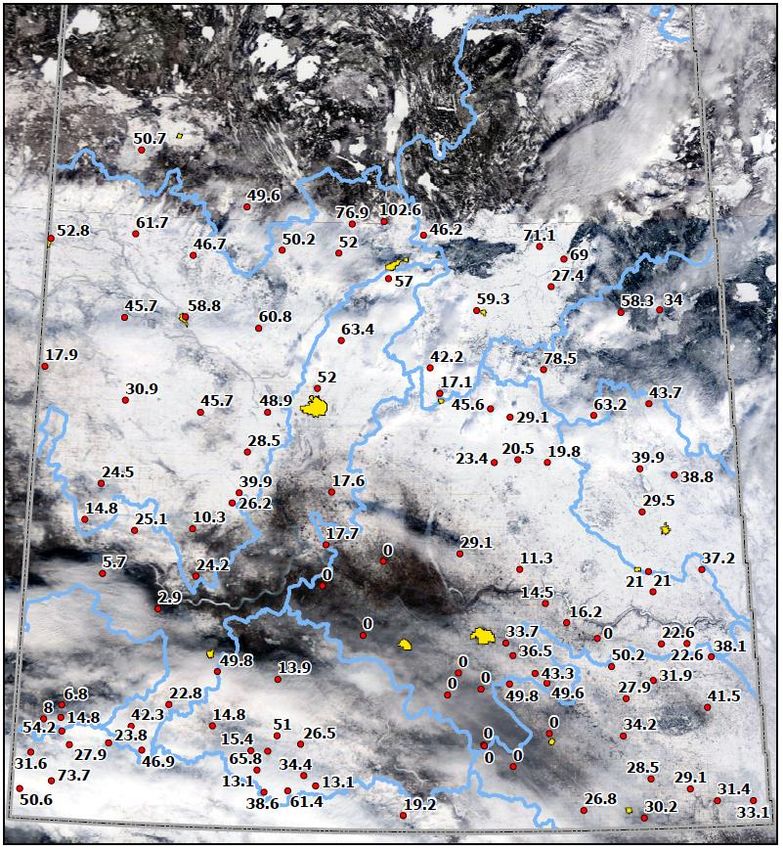
General Overview expected below Rafferty and Grant Devine dams and in the lower Antler River
and Gainsborough Creek basins. Above normal snowmelt runoff is also
expected south of the Cypress Hills in the Battle, Middle, and Lodge creek
The Water Security Agency (WSA) is preparing for 2020 spring runoff by basins and in the Lower Frenchman River Basin. Again, while flows are
issuing this runoff forecast. The spring runoff potential for the province, as of
forecasted to be above normal, flooding is not expected at this time.
March 1, 2020, is shown in Figure 1. Forecasted peak levels for select lakes
and reservoirs are included in Table 1, and peak flow estimates for select Water supplies from the province’s major reservoirs are expected to be
watercourses are included in Table 2. adequate in 2020. Some agricultural water supply issues could develop within
drier areas during 2020 if lack of moisture persists through spring.
Fall conditions, snowpack water content, and rate of melt are the primary
factors that influence snowmelt runoff. While we have a good understanding of Desirable summer operating levels are also expected at most recreational
the fall conditions and the snow accumulation season is nearing its end, it is lakes within the province in 2020. The Qu’Appelle Valley is the exception with
too early to be able to predict the conditions at melt. For this reason, this Last Mountain, Pasqua, Echo, and Crooked lakes likely to be lower than
forecast assumes normal/average conditions going forward through to the desirable.
conclusion of the spring runoff event. Above average snowfall over the
remaining weeks of winter and/or a rapid melt could increase runoff yields The snowpack over the alpine and foothill headwaters of the Saskatchewan
significantly. The converse is true for below normal snowfall going forward River is generally above normal at this time. Above average inflow is projected
and/or a slow melt. into Lake Diefenbaker from 2020 snowmelt. Rains over the mountain and
foothill headwater areas in May and June have a significant effect on the
As detailed in the WSA’s Conditions at Freeze-up Report, which was released overall inflow to the reservoir. Lake Diefenbaker is slightly above normal levels
in November of 2019, above normal precipitation in the fall of 2019 resulted in for this time of year and is expected to be close to full by the end of August if
areas south of Highway 1 going into winter with moisture conditions that were summer rainfall over the headwaters is near average.
wetter than normal with the wettest conditions found in the extreme southeast
corner of the province. North of Highway 1, most areas had near normal WSA will continue to monitor the 2020 spring runoff conditions across
moisture conditions at freeze-up in 2019 with a few exceptions through central Saskatchewan. If warranted, further updates will be issued as the spring runoff
portions of the agricultural area of the province. progresses.
Snow accumulations to date have been below average across most of the
province. Some areas have observed record dry conditions over the winter
period. With 88 years of record, the precipitation recorded at Estevan has
been the lowest on record with just 27% of normal accumulations thus far. The
second driest conditions on record were also observed at Moose Jaw and
Yorkton. The only area of the province where above normal snowpack exists is
south of the Cypress Hills in the southwest.
As shown in Figure 1, snowmelt runoff is projected to be below to well below
average across most of the province with the exception of the northwest
corner where near normal runoff is expected and the extreme southwest and
southeast corners where above normal runoff is expected. In the southeast,
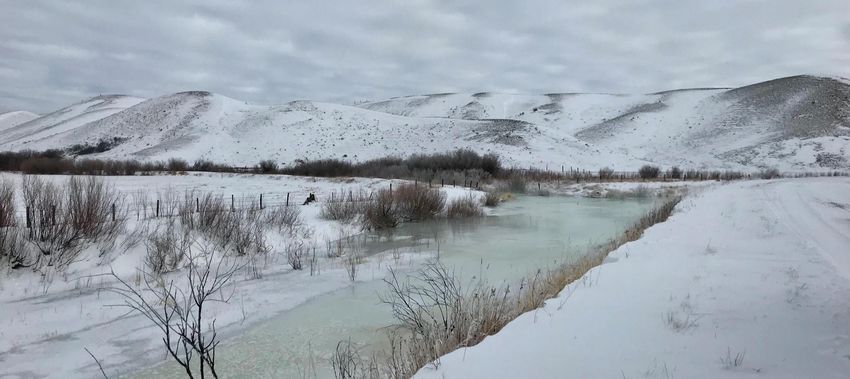
wet fall conditions combined with near normal snowfall is resulting in an Cover Photo: Sucker Creek near Cypress Lake, February 20, 2019
expectation of above normal runoff; however, flood damages are not expected Credit: Allana Howell, WSA
if normal conditions occur between now and the melt. Highest flows are
March 2020 Runoff Outlook 1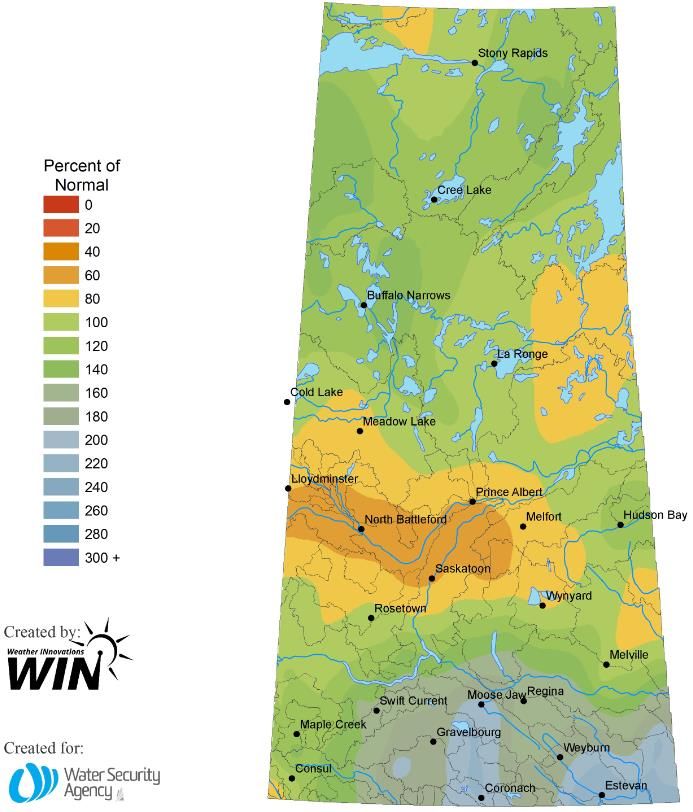
The following descriptions provide some context to the categories of snowmelt
runoff potential used to describe the potential for runoff from the spring
snowmelt in Figure 1.

                                                                  Approximate
Category                       Description                    Frequency of Expected
                                                                      Flow
 Well Below
                       Little to no runoff is expected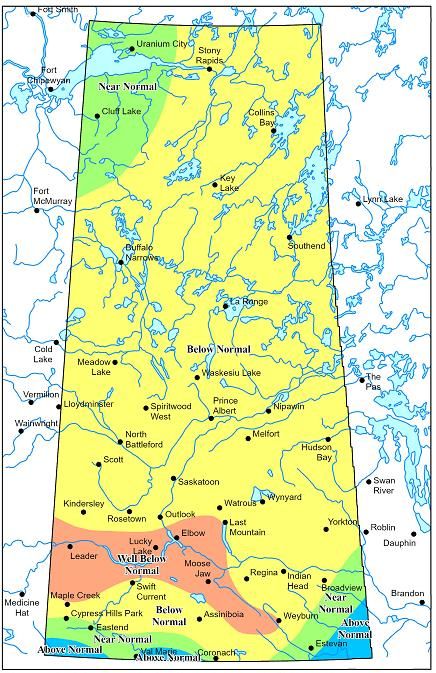
Fall Conditions
The majority of Saskatchewan received near to above normal rainfall in the
summer of 2019. This precipitation alleviated the drought like conditions that
were being experienced to some degree across most of the grain belt earlier in
the year.

As shown in Figure 2, throughout the fall of 2019 most of southern
Saskatchewan received precipitation amounts that were well above normal.
This fall precipitation resulted in most of southern Saskatchewan going into
freezing-up with wetter than normal soil moisture conditions. The wettest areas
were around Swift Current and in the Souris River Basin. Despite the above
normal fall precipitation, no flooding was observed; however, streamflow in
some areas were above normal going into winter.

The well above normal precipitation over southern portions of the province
improved soil moisture conditions which reduces the potential infiltration in the
spring and increases the runoff potential.

Depressional storage still exists in many areas. These potholes/wetlands will
need to fill and spill prior to contributing to streamflow. While conditions over
much of the south were wetter than normal in the fall of 2019, conditions were
not as wet as the conditions in the falls of 2010 and 2016.

Northern Saskatchewan received near normal precipitation in the fall; this,
combined with near to slightly above normal summer precipitation, has
resulted in the area going into the fall with near normal moisture conditions.

The only areas where drier than normal conditions still existed at freeze-up
were a small area around Kindersley, the area between Saskatoon and Prince
Albert, and a small area northeast of Yorkton that extends to the Manitoba
border.

                                                                                    Figure 2: Percent Normal Precipitation
                                                                                           Aug. 3 to Oct. 31, 2019

March 2020 Runoff Outlook                                                                                                    3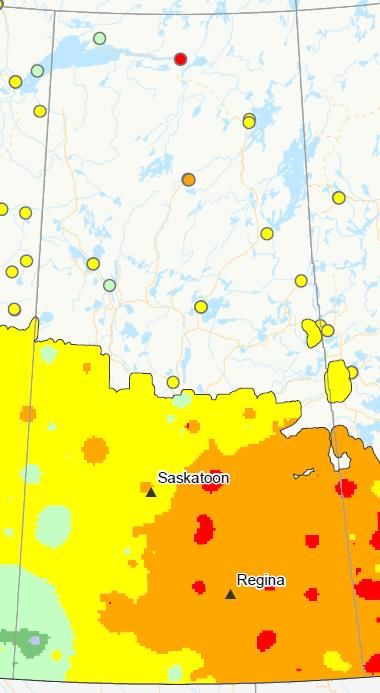
Early Winter 2019/2020 Precipitation
Point snowfall data, mapped as a percent of average, is provided in Figure 3.
This figure shows that the winter snowfall has been below average across most
of the province. Only a small area in the extreme southwest corner of the
province has received near to above normal snowfall to date. It is important to
note that this map is based on a relatively small number of sites across
Saskatchewan, and due to the challenges of measuring point snowfall data in a
windy environment and losses during the winter period, it may not represent
the water equivalent available for runoff. This is particularly true for many areas
where the snowpack was almost completely melted or sublimated due to
periods of well above normal temperatures in late January and late February;
however, this meltwater would have wetted the soil surface, reducing the
infiltration capacity available for the melt of any late season snow.

Environment and Climate Change Canada produces a snow water equivalent
(SWE) map generated using satellite passive microwave signals. Their
March 1, 2020 map is provided as Figure 4. WSA completed point snow
course surveys between February 24 and 27. This data, which is provided in
Figure 5, is believed to be the best available information on current snow water
equivalents. As shown in these products, the southwest corner of the province
has near to above normal snow accumulations for this time of the year. The
remainder of the province has received below to well below normal
accumulations. Due to unseasonably warm temperatures in late January and
again late February, much of the southcentral area of the province only has
trace amounts of snow present at this time.

                                                                                         Figure 3: Percent Normal Winter Precipitation
                                                                                           November 1, 2019 to February 27, 2020
                                                                                      (Map Courtesy of Agriculture and Agri-Food Canada)

March 2020 Runoff Outlook                                                                                                                  4
Figure 5: WSA February 24-27, 2020, Snow Survey Data
                                                                                    (mm of SWE)

         Figure 4: March 1, 2020 Passive Microwave Snow Water
                             Equivalent Map
            (Map Courtesy of Environment and Climate Change
                                Canada)

March 2020 Runoff Outlook                                                                                          5
Long Range Forecasts
Most long lead precipitation forecasts are predicting near normal precipitation
across the majority of the province for March, April, and May. One model is
predicting above normal precipitation for the entire province over this period
and most are forecasting above normal precipitation over southwestern areas
of the province. There is a lack of consensus on the temperature outlook over
this period, with four models expecting above normal temperatures and three
expecting below normal temperatures. With that said, it is important to note
that seasonal weather forecasts are largely unreliable. Their skill is particularly
poor for precipitation.
Three-month spatial anomalies maps for precipitation (Figure 6) and
temperature (Figure 7) covering the March 1 to May 31 period are provided
here.

                                                                                                 Figure 7: Multi Model Ensemble Temperature Anomaly
                                                                                                          Forecast (March 1 to May 31, 2020)
                                                                                                   Map Courtesy of the US National Weather Service

                                                                                      Water Supply Outlook
                                                                                      Most reservoirs and dugouts went into winter at near normal levels as a result
                                                                                      of wet conditions in the fall. One exception was the Souris River Basin
                                                                                      reservoirs (Rafferty, Boundary, and Grant Devine) which were below normal
                                                                                      levels. Based on the current forecast, we expect to see some recovery at
                                                                                      these reservoirs, but it is unlikely that Rafferty Reservoir and Grant Devine
                                                                                      Lake will fill from snowmelt runoff. However, we do not expect to experience
                                                                                      any surface water supply shortages in the Souris Basin or any other basin in
                                                                                      2020. Nickel Lake is also unlikely to fill in 2020 which may impact water quality
           Figure 6: Multi Model Ensemble Precipitation Anomaly                       in 2020.
                    Forecast (March 1 to May 31, 2020)
             Map Courtesy of the US National Weather Service

March 2020 Runoff Outlook                                                                                                                                             6
Summary of Major River Systems slightly above to well above normal snowpack in the South Saskatchewan
River Basin, and slightly above normal in the North Saskatchewan River
Basins.
Souris Basin
Rafferty Reservoirs and Grant Devine Lake were at or below their normal The snowpack in the Rockies does not typically peaks until late May or early
drawdown levels prior to February 1. Even with the wetter than normal June at the upper altitudes; therefore, conditions can change between now
conditions at freeze-up in 2019, the well below normal snowpack present and the melt. Additionally, high flows on the system are also largely driven by
across much of the basin has resulted in non-flood operations being in effect. significant summer rainfall events in June and July. At this time, assuming near
No additional drawdown of these reservoirs is expected to occur in 2020. The normal precipitation over southern Alberta, Lake Diefenbaker levels are
extreme southeast corner of the basin, below the reservoirs, is expected to expected to be near or slightly above normal this summer.
experience above normal snowmelt runoff; however, the Sherwood Crossing is
only expected to experience about a 1:3 year event. Flows on the North Saskatchewan River are above normal for this time of year.
This, combined with above normal outflows from Lake Diefenbaker, has
Based on current conditions, the only reservoir expected to fill is Boundary resulted in above normal flows on the Saskatchewan River.
Reservoir. Since Rafferty Reservoir is not expected to fill, any excess from
Boundary will be diverted to Rafferty Reservoir. It is anticipated that reservoir Qu’Appelle System
releases during the spring runoff period will be limited to diversions to Rafferty, Most of the lakes in the Qu’Appelle River basin are at near normal levels for
and what may be required to meet international apportionment obligations. Any this time of year. The exception is Last Mountain Lake which is just above the
releases to appease international obligations will be made from Grant Devine median level for this time of year.
Dam.
Currently the Echo Lake and Crooked Lake control structures are fully open.
Detailed forecasts for the Souris River Basin are developed on or near the 1 st With the below to well below normal snowmelt runoff excepted throughout the
and 15th of each month, beginning in February, up until the snowmelt runoff basin, these structures are likely to be operated early to maximize diversions
event. These forecasts can be found on www.wsask.ca.
into storage during the melt. If there is insufficient runoff to raise lakes levels
into their desirable ranges, additional diversions into the system from Lake
Saskatchewan River Basin Diefenbaker via the Upper Qu’Appelle Conveyance may be made. The controls
Lake Diefenbaker was a little above the median water level going into winter. structure located at the outlet of Round Lake will not be operated in 2020 as
Winter inflow into Lake Diefenbaker have also been slightly above normal for. the Government of Canada does not possess adequate land control.
Despite above normal outflows through the winter, this has resulted in Lake
Diefenbaker water level being slightly above median as well. The operating Churchill System
plan is to maintain the current outflow of around 320-330 m3/s in order to draw Runoff within the headwater areas of the Churchill System is expected to be
the reservoir down to near median level prior to the spring runoff. Spring and near normal in response to adequate soil moisture condition in the fall and a
early summer target levels on the reservoir will be adjusted in March based on near normal snowpack. Portions of the basin east of Lac La Ronge are
the hydrological conditions in the headwaters of the basin. Near to above expected to experience slightly below normal snowmelt runoff as a result of
normal releases are likely for both March and April. drier conditions in the fall of 2019 and below normal snowfall.
Snow pillows operated by Alberta Environment and Parks located at higher
elevations within the alpine headwaters of the basin are showing above or well
Quill Lakes
above average snowpack for the South Saskatchewan River headwaters, and Both Big Quill and Little Quill lake water levels are 520.19 m. This is their
slightly above average for the North Saskatchewan River. Snow courses lowest pre-spring runoff level since 2014 and 0.28 m lower than the pre-spring
completed at lower elevations in late January and early February also suggest level in 2019. Topsoil moisture conditions were below normal at freeze-up in
March 2020 Runoff Outlook 72019 within the Quill Lakes Basin. The Basin has also received below normal Swift Current & Rush Lake Creeks
snowfall to date, about 50% of normal. As such, below normal snowmelt
The Swift Current Creek basin was wetter than normal at freeze-up in 2019,
inflows are currently forecasted for the Quill Lakes in 2020. Based on current
but has received a below normal snowfall this winter. As such, a below normal
conditions, the Quill Lakes are forecasted to increase by about 0.05 m in
runoff is expected. Highfield Reservoir is approximately 50% full and may not
response to snowmelt inflows in 2020 resulting in a peak of about 520.24 m.
fill in 2020.
With average climatic conditions in 2020, the Quill Lakes water levels would
continue to decline.
Old Wives Lake Next Forecast
Runoff potential is expected to be near to slightly below normal for most of the
Old Wives Lake basin in spring 2020. This is a result of wet conditions at freeze The WSA will issue a Spring Snowmelt Forecast in early April unless runoff is
up and near to slightly below normal snow accumulations throughout most of underway.
the basin. The exception is the upper portions of the Wood River where the
snow surveys conducted in late February showed considerable snowpack, as
a result, near normal snowmelt runoff is expected from these areas.
In response to the well above normal temperature in late January/early
February, some runoff occurred within the basin. This required the release of
some water at Lafleche Dam to maintain Thomson Lake within a safe level.
Thomson Lake is expected to fill in response to snowmelt inflows in 2020.
Frenchman River
Runoff yields from the basin’s headwaters and areas south of the Frenchman
River are expected to be near normal, while the lower portions near Val Marie
are expected to be above normal. With normal conditions going forward,
Eastend Reservoir, Huff Lake and Newton Lake are expected to fill.
Battle, Middle, Lodge Creeks
With the wet fall followed by a near to above normal snowpack in southeastern
Alberta and the southwestern corner of Saskatchewan, the expectation is that
there will be above average inflow into both Middle Creek Reservoir and
Altawan Reservoir in 2020.
Maple Creek
With the below normal snowpack in the basin, below normal inflows into all
reservoirs in the Maple Creek Basin (Junction, McDougald, Harris, and
Downie) is expected.
March 2020 Runoff Outlook 8Table 1: Provincial Forecast for Saskatchewan – March 2020
Normal Recorded Historical
2020 March 2019
Forecast* 2020 Peak Shoreline 1 Summer Extreme
Lake 1st Level Peak
Spring Levels (metres) Level/FSL (metres) Level Level
(metres) (metres) Year
(metres) (metres)
Anglin 515.39 515.5 515.4 515.3 515.52 516.05** 2013
Big Quill 520.19 520.24 521.47 (spill) 515 520.54 520.92 2017
Boundary Reservoir 559.53 560.8 560.83 560.5 560.20 561.15 1979
Buffalo Pound 509.29 509.45 509.9 509.4 509.57 511.45 1974
Candle Lake 494.31 494.4 494.5 494.4 494.39 495.25 1973
Cookson Reservoir 752.76 753.0 753 752.5 753.03 753.35 1979
Crooked 450.79 451.6 452.3 451.7 451.74 454.40** 2014
Echo and Pasqua 478.35 479.1 479.3 479.1 479.19 480.98 2011
Fishing 529.67 529.9 529.7 528.5 529.96 530.92 2011
Good Spirit 484.28 484.5 484.6 484.6 484.57 485.68** 2010
Grant Devine 560.99 561.7 562.0 561.5 561.79 566.58** 2011
Jackfish 529.45 529.6 529.4 529.4 529.75 530.0 1985
Katepwa and Mission 478.45 478.3 478.7 478.3 478.31 479.58 2011
La Ronge 364.14 364.3 364.1 364.4 364.45 364.98** 2011
Last Mountain 489.92 490.1 490.7 490.2 490.02 492.09 1955
Moose Mountain 620.04 620.3 620.3 620.4 620.29 621.9 2011
Nickel Lake 562.58 562.7 563.0 562.75 563.19 564.0 2011
Rafferty 549.17 549.6 550.5 550 549.45 554.05** 2011
Round 441.57 441.7 443.28 442.4 441.57 445.70** 2014
Wascana 570.60 570.7 570.6 570.5 570.72 572.23 1974
* These forecasted peaks are based on a typical spring precipitation and rate of melt. Above normal precipitation and/or rapid melt may result in significantly higher
levels.
** Occurred after spring runoff during summer event(s).
1
The “Shoreline Level” and “Full Supply Level” refer to the highest elevation before spill occurs
March 2020 Runoff Outlook 9Table 2: Spring Runoff Forecast
March 2020 Forecast* Historical
2019 Spring
Basin and Location Peak Peak Flow Recorded Maximum
Peak Flow Normal Year
Flow (m3/s) Spring
Frequency
(m3/s) Flow (m3/s) Flow (m3/s) Year
ASSINIBOINE RIVER BASIN
Assiniboine River at Sturgis 15 < 1:2 7.6 30 111 1995
Whitesand River near Canora 18 < 1:2 7.5 36 247 1995
Assiniboine River at Kamsack 40 < 1:2 28.4 78 488 1995
QU’APPELLE RIVER BASIN
Qu’Appelle River near Lumsden 13March 2020 Forecast* Historical
2019 Spring
Basin and Location Peak Peak Flow Recorded Maximum
Peak Flow Normal Year
Flow (m3/s) Spring
Frequency
(m3/s) Flow (m3/s) Flow (m /s)
3
Year
BEAVER RIVER BASIN
Beaver River near Dorintosh 45 < 1:2 85.9 92 654 1962
LAKE WINNIPEGOSIS BASIN
Red Deer River near Steen 11 < 1:2 8.0 20 102 1972
Red Deer River near Erwood 77 < 1:2 79.8 150 878 2006
NORTH SASKATCHEWAN RIVER BASIN
North Saskatchewan River near Deer Creek 460 < 1:2 768.0 900 1660 1974
Eagle Creek near Environ 6 < 1:2 17.1 12 136 1970
North Saskatchewan River at Prince Albert 530 < 1:2 1404.4 1100 3880 1974
SASKATCHEWAN RIVER BASIN
White Fox River near Garrick 15 < 1:2 15.0 26 160 1974
Torch River near Love 25 < 1:2 25.3 43 170 1955
Carrot River near Armley 33 < 1:2 46.5 71 377 1974
Carrot River near Smoky Burn 100 < 1:2 124.9 200 816 1972
SWIFT CURRENT CREEK BASIN
Swift Current Creek below Rock Creek 9 < 1:2 29.1 18 85 1955
Rushlake Creek above Highfield Reservoir 5 < 1:2 10.9 7.4 38 1969
* These forecasted values are based on typical spring precipitation and typical rate of melt. Above normal precipitation and/or rapid melt may
result in significantly higher flows.
** Occurred after spring runoff during summer event(s).
March 2020 Runoff Outlook 11March 2020 Forecast* Historical
2019 Spring
Basin and Location Peak Peak Flow Recorded Maximum
Peak Flow Normal Year
Flow (m3/s) Spring
Frequency
(m3/s) Flow (m3/s) Flow (m /s)
3
Year
SOURIS RIVER BASIN
Long Creek near Noonan 19 1:2 20.5 50 183 2011
Yellow Grass Ditch near Yellow Grass 1You can also read