Whole Tablet Measurements Using the Spectrum One NTS Tablet Autosampler System
←
→
Page content transcription
If your browser does not render page correctly, please read the page content below
A P P L I C A T I O N
Whole Tablet Measurements
Using the Spectrum One NTS Tablet
Autosampler System

                                                                                                                N O T E
Introduction                         individual assays by HPLC. The        er speeds and also provides more
                                     standard deviation of assay is        sample matrix information. It is
Recent advances in NIR technology
                                     intended to provide an idea of        also readily automated thus pro-
have changed the ways in which
                                     the uniformity of the blend. This     viding the potential for more
both the pharmaceutical industry
                                     measurement is required before        and/or faster tablet testing using
and the regulators view the
                                     batch release and can cause seri-     less specialized operators. More
current approaches to tablet
                                     ous bottlenecks, especially if out-   efficient, more informative
testing in manufacturing.
                                     of-specification results are gener-   measurement in this area is a
In 2001, among the FDA’s top 10      ated. The HPLC technique used is      key factor in delivering more
reasons for product recall were      slow, requires skilled analysts,      process understanding; an
problems with sub-potency and        provides little or no information     objective pursued by industry
tablet dissolution. In addition,     on the matrix and destroys the        and regulators alike.
recent cases of cGMP violations      sample. Analysts are actively
                                     seeking faster, non-destructive       This note describes an example
have highlighted issues in tablet
                                     methods which can provide more        showing the application of NIR
manufacturing. One area where
                                     information on the sample and         tablet transmission measurements
the industry is seeking to improve
                                     are capable of being used by less     to determine the active content of
its processes is in the blending
                                     experienced operators.                whole tablets
area. After tablet pressing,
measurement of uniformity of
                                     NIR now offers the possibility
content usually involves taking
                                     of performing non-destructive,
a sample (typically 10 tablets)
                                     whole tablet testing at much high-
from the batch and performing

www.perkinelmer.com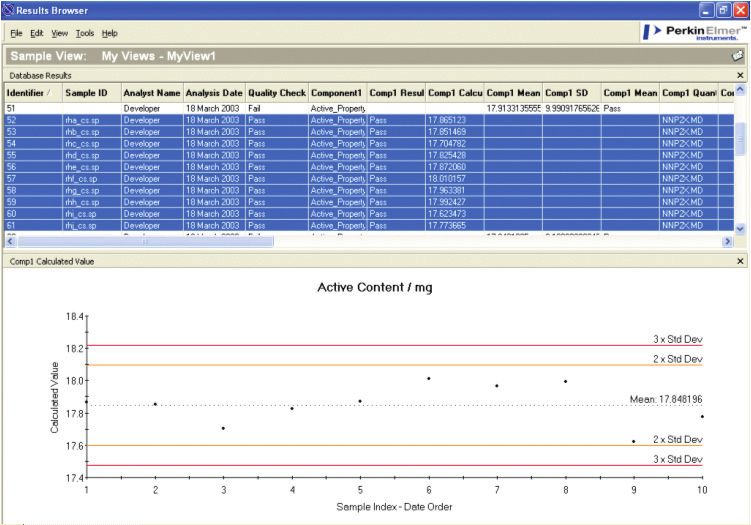
Method integration software (AssureID™
version 2) provides simple
The aim of the study was to present
construction of methods which can
whole, coated tablets to the analyser
be easily readied for effective
to determine active level, then to
push-button operation in the plant
perform a series of analyses on a
(Figure 3). Given the method is
batch of tablets to provide informa-
generally used by users in a
tion on the uniformity of the batch.
production environment numerous
Using the system described below,
system design features in both
the samples are presented
software and hardware are oriented
horizontally to the spectrometer and
towards more robust methods – from
a masked beam illuminates each
sample presentation to the software
sample with a spot diameter of
workflows designed to minimize the
6 mm. The power of the beam at the Figure 1: Tablet holder for
likelihood of operational errors.
sample position is relatively low NIR transmission measurements.
(ca 200 mW) in order to avoid
unwanted heating problems in
the tablet, which could interfere
with results.
The tablets to be tested were 350 mg
in weight, ca 12 mm in length and
ca. 5-mm thick. Using the NIR
transmission approach, it is
important to present the sample
to the instrument in such a way as
to minimize stray radiation from the
instrument passing around the side
of the sample and going onto the
detector. To overcome this potential
problem, special custom tablet
holders may be fabricated to ensure
a tight fit between tablet holder and
tablet. An illustration of the sample
holders is shown in Figure 1.
The Spectrum™ One NTS FT-NIR
spectrometer was equipped with the
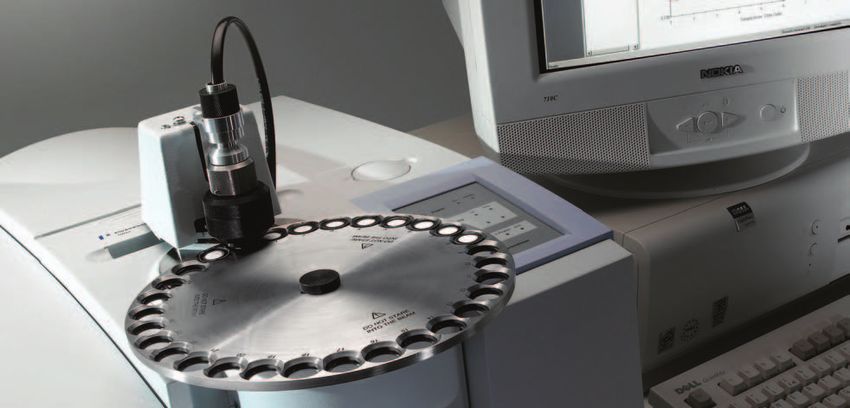
Tablet Autosampler sampling system. Figure 2: Spectrum One NTS tablet autosampler system.
The system includes detectors for
both transmission and reflectance
measurement, and an automated
sample wheel for batch measurements
(Figure 2). Dedicated detectors allow
for optimized operation for this
potentially demanding measurement.
The method development and system
Figure 3: AssureID software for tablet analysis automation.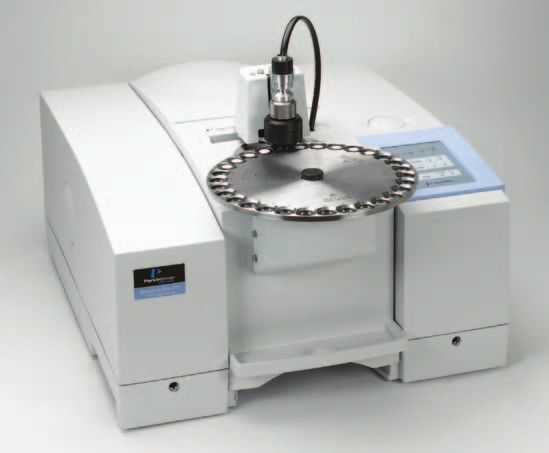
Calibration                                  with 68 independent samples,             For the batch calculations, 10 tablets
                                             spanning the same concentration          were placed into the tablet holders
When setting up the system for
                                             range (validation set) were used.        which in turn were mounted onto
analysis, it is necessary to calibrate
                                             Calibration details are shown            the wheel. It is also advisable to
the system using a training set of
                                             in Table 1.                              generate a tablet presentation SOP
samples which span the target assay
                                                                                      to ensure correct positioning of the
value – usually 80-120% of target            When the primary property of             tablets into the autosampler between
value is chosen. This can sometimes          interest is chemical composition         different operators. The AssureID
be the slowest part of the system            such as active content, there are        software allows users to display
implementation as it can be difficult        some steps that can be taken to          their own SOP prior to analysis.
to obtain samples which are so               improve the robustness of the            This can contain product-specific
"off-spec," especially for mature            method to operator and/or sampling       information which is linked to that
processes. Hence it is often most            variability. For example, the choice     particular method.
effective to implement this technology       of using derivative spectra for the
earlier in the product lifecycle in the      analysis can considerably improve
formulation development or scale-up          the robustness of the calibration with   Results and Discussion
stages when a wider range of                 respect to sampling variations such
calibration tablets is more likely                                                    For this analysis, batches of 10
                                             as tablet height position and for this
to be at hand.                                                                        samples were analysed using the
                                             method it was found that a smoothed
                                                                                      PLS1 method outlined above and
                                             second derivative approach worked
The target concentration for this                                                     simple batch statistics including
                                             well. It is a very simple operation
product was 20 mg per 350-mg                                                          the mean assay value, standard
                                             in Quant+ to switch-on various
tablet. To generate the calibration,                                                  deviation, and minimum and
                                             forms of data pre-treatment and to
samples ranging from 16-mg content                                                    maximum batch values were
                                             view the effects on the calibration
to 24-mg content were scanned and                                                     calculated and output to the reports
                                             performance. The calibration model
the Quant+ quantitative software                                                      and secure database. The database
                                             used and certain sampling precau-
application used to generate the cali-                                                may be queried within the AssureID
                                             tions are key factors in determining
bration equation relating the spectral                                                application to show result trends,
                                             the ultimate robustness of the
changes to the concentration values.                                                  revealing important information
                                             method in everyday use and, as a
The Quant+ software offers a full                                                     about the process. An example plot
                                             rule, extra care taken at this stage
suite of diagnostics to help optimise                                                 is shown in Figure 4. A typical
                                             is easily paid back in terms of the
the calibration before incorporating                                                  output from a query is shown in the
                                             reliability of the final method.
the model into the analysis                                                           figure below. Individual records may
workflow. For this study, it was             Relevant instrument data collection      also be examined, tracing calculated
found adequate to use a sample               parameters for optimum results for       results to associated instrument
training set, a calibration set of           this sample set are shown in Table 2.    conditions, spectra and system
20 samples and to test the model                                                      check results, Figure 5.

                                                                                      Table 2: Instrument details for tablet
Table 1: Quantitative calibration details.                                            assay measurement.
  Number of calibration samples                                 20                      Scan range/cm-1          12000-8500
  Number of validation samples                                  68                      Resolution/cm-1              16
  Calibration algorithm                                    Partial least                Scan time/per sample       60 sec
                                                          squares (PLS1)                Scan time per batch        10 min
  Data pre-processing                                      2nd derivative,              Apodization                Strong
                                                       25 point smooth width
                                                                                        Background reference     Open beam
  Number of PLS factors                                          2
  Standard error of calibration (20 samples)/mg                 0.8
  Standard error of prediction (60 samples)/mg                  0.9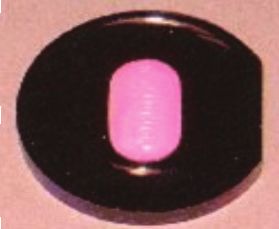
This kind of display provides useful      As the technique becomes more             samples. In this case changes in the
information on a number of important      accepted by the industry, it is           spectra are related directly to some
process issues, assisting the overall     expected that more "calibration-free"     variability in the process. For
understanding of the process:             approaches will be adopted in tablet      example, the standard deviation of
                                          analysis. Such methods skip the step      an isolated active peak height may
■   Potency drift during the run of the   of developing a model relating the        be related directly to uniformity of
    tablet press                          spectral changes to properties of         a batch thereby eliminating the need
■
                                          interest for a pre-analysed training      to calibrate using samples which are
    Potency variability between runs
                                          set of samples and applying the           already beyond the bounds of normal
    on a tablet press
                                          model to predict properties for the       process variability. This approach
■   Potency variability between tablet
    presses
■   Potency variability with differing
    blending conditions
■   Direct comparison with HPLC
    assay values. In general due to
    the much faster and more
    representative NIR analysis it is
    possible to obtain trend plots
    with far more data points than the
    corresponding HPLC trend plots.

This kind of information is beneficial
not only from the point of view of
improved understanding of the
blending/pressing from the point of
view of potency, but can be extended
to provide similar information on
other ingredients, and in favourable
cases some physical properties such
as coating thickness and hardness –
with no significant impact of on
batch analysis time.                      Figure 4: Trend display showing variation of potency within a batch.

Next, it is envisaged tablet analysis
will be extended to the following:

■   Other matrix components
■   Physical properties such as
    hardness and/or coating thickness
■   Powder blends before tablet
    pressing. This will be possible by
    extracting sample from the blender
    using a sample thief and pressing
    the blend into wafers prior to NIR
    transmission analysis.
■   Other uncoated tablets where
    moisture will be measured in
    addition to active. Moisture will
    be measured by reflectance and
    active content by transmission.

                                          Figure 5: Tablet analysis database display.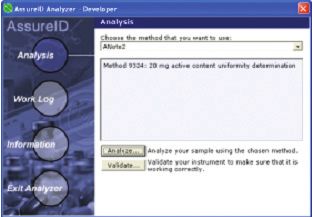
may be easier for some products,          based approach worked better. The         Increasing scrutiny from the
where the active absorption in the        method can be run in parallel with        regulators and the drive for
spectrum is very clearly differentiated   the conventional HPLC method              improved process understanding will
from the other ingredients in the         during the validation stage.              ensure the technique will become
spectrum. For other products,                                                       more widespread. The
however, the distinction is less clear                                              anticipated development of official
making it necessary to introduce          Conclusion                                guidelines for setting up and testing
more sophisticated data analysis          The use of NIR transmission for           NIR transmission methods in a
techniques. Figure 6 shows the NIR        whole tablet analysis can effectively     similar manner to the NIR reflectance
transmission spectra of two different     improve the efficiency of the tablet      methods will be another factor in the
products. In Figure 6a, the active        pressing step by allowing faster          growth of this exciting development.
band is not overlapped with those         feedback into the process than the
of the other ingredients and simple                                                 As the pharmaceutical industry
                                          conventional HPLC method. NIR can
band height measurements can be                                                     begins to realize the benefits of
                                          be an order of magnitude faster.
correlated directly with the potency.                                               the new technologies for NIR testing,
                                          More analytical information per
In Figure 6b, the active band is                                                    it will then be just a matter of time
                                          sample and more tablet analyses
overlapped with the absorption of                                                   before NIR becomes established as a
                                          in a given time greatly increases
the other ingredients and for this                                                  standard method used as commonly
                                          process understanding.
particular product, a chemometrics-                                                 as mid-IR in pharmacopeial methods.

Figure 6a: NIR transmission spectra where active absorp-       Figure 6b: NIR transmission spectra where active
tion is separated from other components in the matrix.         absorption is overlapped with other ingredients. The
Spectra from 0-, 10-, 50-, 200-mg strength tablets.            two traces show spectra from tablets of two strengths,
                                                               ca 5 and 10% active, where the absorption due to the
                                                               active indicated.
PerkinElmer Life and Analytical Sciences 710 Bridgeport Avenue Shelton, CT 06484-4794 USA Phone: (800) 762-4000 or (+1) 203-925-4602 www.perkinelmer.com © 2003 PerkinElmer, Inc. All rights reserved. PerkinElmer is a registered trademark and AssureID and Spectrum are trademarks of PerkinElmer, Inc. All trademarks depicted are the property of their respective holders or owners. PerkinElmer reserves the right to change this document at any time and disclaims liability for editorial, pictorial, or typographical errors. 006832_02 070300 Printed in USA
You can also read