Supplement of Investigation of the global methane budget over 1980-2017 using GFDL-Atmos. Chem. Phys
←
→
Page content transcription
If your browser does not render page correctly, please read the page content below
Supplement of Atmos. Chem. Phys., 20, 805–827, 2020
https://doi.org/10.5194/acp-20-805-2020-supplement
© Author(s) 2020. This work is distributed under
the Creative Commons Attribution 4.0 License.

Supplement of
Investigation of the global methane budget over 1980–2017 using GFDL-
AM4.1
Jian He et al.

Correspondence to: Jian He (jian.he@noaa.gov)

The copyright of individual parts of the supplement might differ from the CC BY 4.0 License.
S1. Observational data

                             Table S1. List of NOAA-GMD marine boundary layer (MBL) sites
                                                                                                Elevation
          Code              Name             State            Country   Latitude    Longitude
                                                                                                   (m)
          ALT               Alert           Nunavut           Canada     82.451      -62.507       190
                         Amsterdam
         AMS                                  N/A             France    -37.798      77.538        55
                           Island
                                                            United
          ASC       Ascension Island          N/A                        -7.967       -14.4        85
                                                           Kingdom
                                                            United
          AVI             St. Croix      Virgin Islands                  17.75        -64.75       3
                                                             States
                                                            United
         BME        St. Davids Head         Bermuda                      32.368      -64.648       12
                                                           Kingdom
                                                            United
         BMW              Tudor Hill        Bermuda                      32.265      -64.879       30
                                                           Kingdom
                                                            United
         BRW               Barrow            Alaska                      71.323      -156.611      11
                                                             States
                                                            United
          CBA             Cold Bay           Alaska                      55.21       -162.72      21.3
                                                             States
          CGO            Cape Grim         Tasmania        Australia    -40.683      144.69        94
                                                          Republic of
          CHR       Christmas Island          N/A                         1.7        -157.152      0
                                                           Kiribati
                                                            United
         CMO             Cape Meares        Oregon                       45.478      -123.969      30
                                                             States
          CRZ        Crozet Island            N/A           France      -46.434       51.848      197
          EIC        Easter Island            N/A            Chile       -27.16      -109.428     47
          GMI       Mariana Islands           N/A            Guam        13.386       144.656      0
                                                            United
          HBA        Halley Station        Antarctica                   -75.605       -26.21       30
                                                           Kingdom
          ICE             Storhofdi      Vestmannaeyjar     Iceland       63.4       -20.288      118
                                                            United
          KEY        Key Biscayne           Florida                      25.665      -80.158       1
                                                             States
                                                            United
         KUM        Cape Kumukahi           Hawaii                       19.52       -154.82       3
                                                             States
                                           Northwest
         MBC             Mould Bay                            Canada     76.247      -119.353      30
                                           Territories
         MHD             Mace Head       County Galway        Ireland    53.326       -9.899       5
                                                              United
          MID            Sand Island        Midway                       28.21       -177.38       11
                                                               States
                    Pacific Ocean (0
        POC000*                               N/A              N/A         0          -155         10
                           N)
                    Pacific Ocean (5
       POCN05*                                N/A              N/A         5          -151         10
                           N)
                     Pacific Ocean
       POCN10*                                N/A              N/A        10          -149         10
                         (10 N)
                     Pacific Ocean
       POCN15*                                N/A              N/A        15          -145         10
                         (15 N)
                     Pacific Ocean
       POCN20*                                N/A              N/A        20          -141         10
                         (20 N)
                     Pacific Ocean
       POCN25*                                N/A              N/A        25          -139         10
                         (25 N)
                     Pacific Ocean
       POCN30*                                N/A              N/A        30          -135         10
                         (30 N)
                    Pacific Ocean (5
        POCS05*                               N/A              N/A         -5         -159         10
                           S)

                                                          1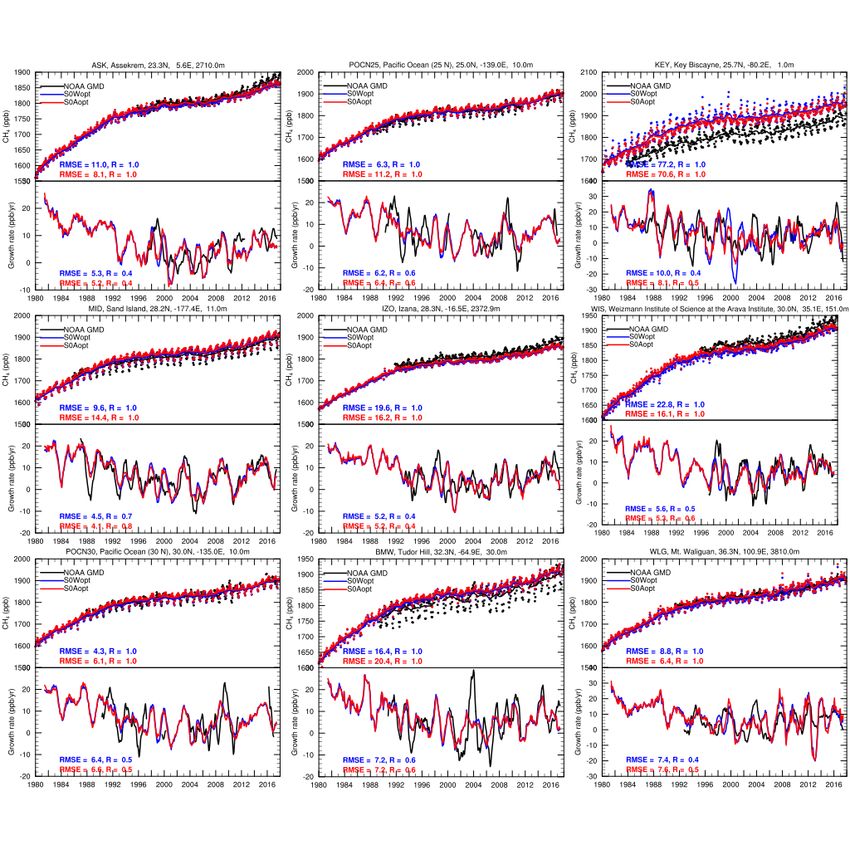
Pacific Ocean
         POCS10*                                  N/A               N/A             -10           -161             10
                           (10 S)
                        Pacific Ocean
         POCS15*                                  N/A               N/A             -15           -164             10
                           (15 S)
                        Pacific Ocean
         POCS20*                                  N/A               N/A             -20           -167             10
                           (20 S)
                        Pacific Ocean
         POCS25*                                  N/A               N/A             -25           -171             10
                           (25 S)
                        Pacific Ocean
         POCS30*                                  N/A               N/A             -30           -176             10
                           (30 S)
                        Pacific Ocean
         POCS35*                                  N/A               N/A             -35            180             10
                           (35 S)
                                                                 United
           PSA          Palmer Station        Antarctica                          -64.92            -64            10
                                                                  States
            RPB          Ragged Point          N/A              Barbados          13.165         -59.432           15
                                                                 United
            SHM         Shemya Island        Alaska                               52.711         174.126           23
                                                                  States
                                                               American
            SMO              Tutuila           N/A                               -14.247        -170.564           42
                                                                 Samoa
                                                                 United
            SPO           South Pole        Antarctica                            -89.98           -24.8          2810
                                                                  States
            STM        Ocean Station M         N/A               Norway             66               2              0
            SYO         Syowa Station       Antarctica            Japan          -69.013          39.59            14
            USH             Ushuaia            N/A             Argentina         -54.848         -68.311           12
                                                              Norway and
            ZEP           Ny-Alesund        Svalbard                              78.907          11.888           474
                                                                 Sweden
*
  Latitude values given for the POCN and POCS sites are the centers of latitude bands of +/- 2.5 degrees, and observations can fall
anywhere within those bands.

                                                                2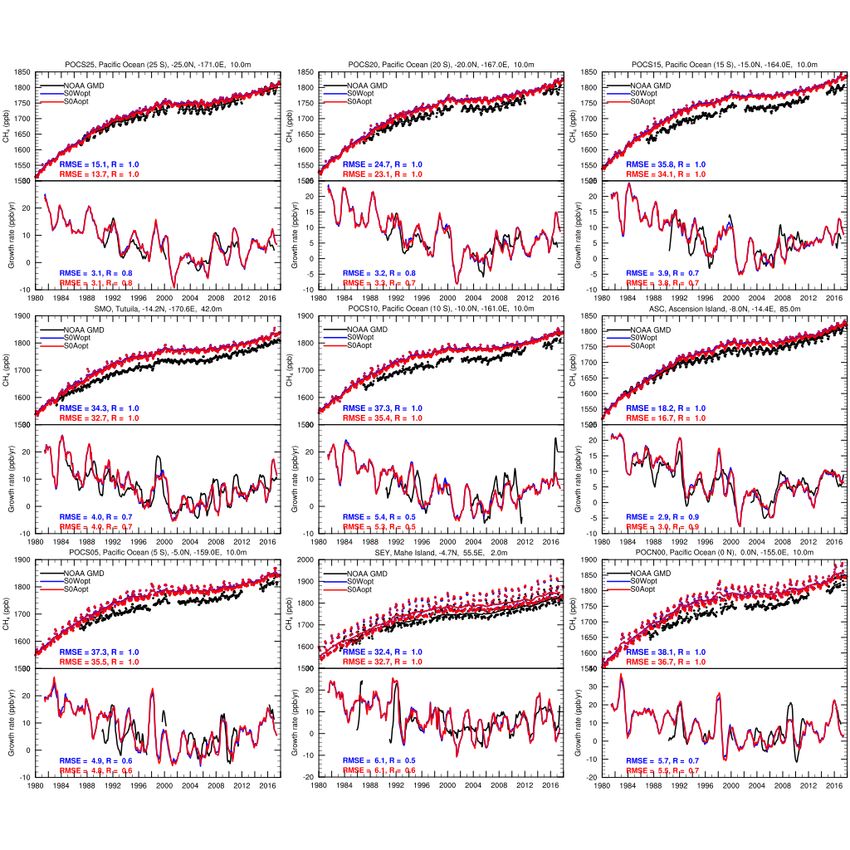
Table S2. List of NOAA-GMD sites with at least 20-year observations
                                                                                     Elevation
 Code         Name              State            Country     Latitude    Longitude
                                                                                     (meters)
 ALT          Alert            Nunavut          Canada       82.451       -62.507       190
            Ascension                           United
 ASC                             N/A                         -7.967         -14.4       85
             Island                            Kingdom
 ASK        Assekrem             N/A            Algeria      23.262        5.632       2710
 AZR      Terceira Island      Azores          Portugal      38.766       -27.375       19
                                                United
 BMW        Tudor Hill         Bermuda                       32.265       -64.879       30
                                               Kingdom
                                                United
 BRW         Barrow             Alaska                       71.323       -156.611      11
                                                States
                                                United
 CBA         Cold Bay           Alaska                        55.21       -162.72      21.3
                                                States
 CGO        Cape Grim         Tasmania         Australia     -40.683       144.69       94
            Christmas                         Republic of
 CHR                             N/A                           1.7        -157.152      0
              Island                           Kiribati
 CRZ       Crozet Island         N/A            France       -46.434       51.848      197
  EIC      Easter Island         N/A              Chile      -27.16       -109.428      47
 GMI      Mariana Islands        N/A            Guam         13.386       144.656       0
                                                United
 HBA      Halley Station      Antarctica                     -75.605       -26.21       30
                                               Kingdom
 HUN        Hegyhatsal           N/A           Hungary        46.95        16.65       248
  ICE        Storhofdi      Vestmannaeyjar       Iceland      63.4        -20.288      118
  IZO         Izana            Tenerife           Spain      28.309       -16.499     2372.9
                                                 United
 KEY      Key Biscayne         Florida                       25.665       -80.158       1
                                                  States
                                                 United
 KUM      Cape Kumukahi        Hawaii                         19.52       -154.82       3
                                                  States
                                                 United
 LEF        Park Falls        Wisconsin                      45.945       -90.273      472
                                                  States
 MHD        Mace Head       County Galway        Ireland     53.326        -9.899       5
                                                 United
 MID        Sand Island        Midway                         28.21       -177.38       11
                                                  States
                                                 United
 MLO        Mauna Loa          Hawaii                        19.536       -155.576     3397
                                                  States
                                                 United
 NWR       Niwot Ridge        Colorado                       40.053       -105.586     3523
                                                  States
          Pacific Ocean
POCN00*                          N/A              N/A           0           -155        10
              (0 N)
          Pacific Ocean
POCN05*                          N/A              N/A           5           -151        10
              (5 N)
          Pacific Ocean
POCN10*                          N/A              N/A          10           -149        10
             (10 N)
          Pacific Ocean
POCN15*                          N/A              N/A          15           -145        10
             (15 N)
          Pacific Ocean
POCN20*                          N/A              N/A          20           -141        10
             (20 N)
          Pacific Ocean
POCN25*                          N/A              N/A          25           -139        10
             (25 N)
          Pacific Ocean
POCN30*                          N/A              N/A          30           -135        10
             (30 N)

                                             3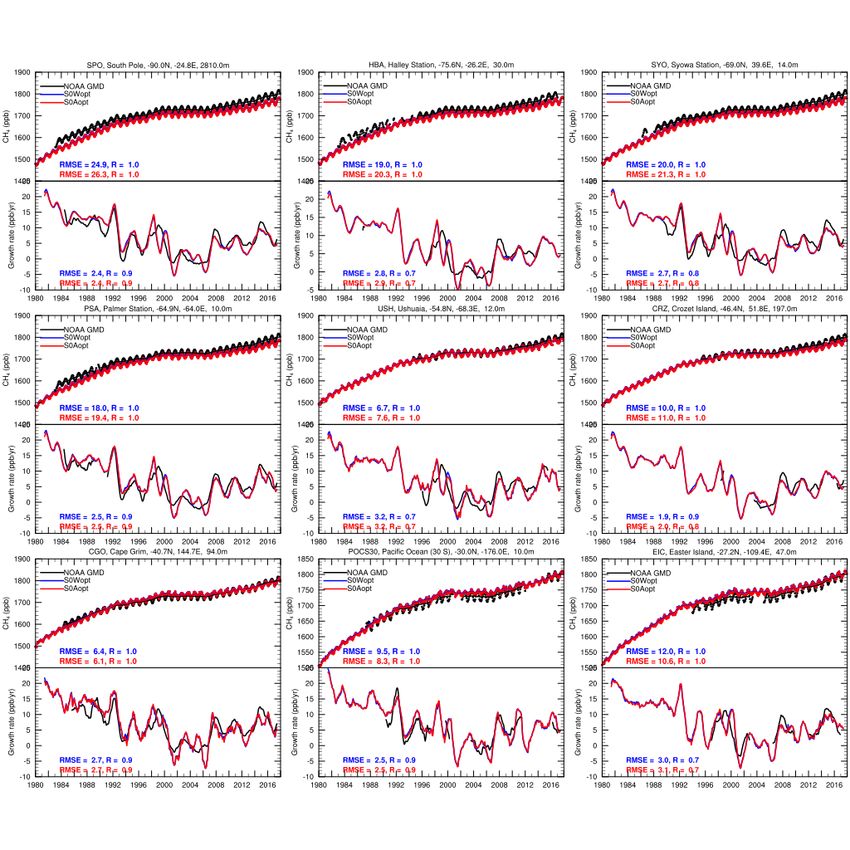
Pacific Ocean
         POCS05*                                 N/A                N/A            -5            -159            10
                            (5 S)
                        Pacific Ocean
         POCS10*                                 N/A                N/A            -10           -161            10
                           (10 S)
                        Pacific Ocean
         POCS15*                                 N/A                N/A            -15           -164            10
                           (15 S)
                        Pacific Ocean
         POCS20*                                 N/A                N/A            -20           -167            10
                           (20 S)
                        Pacific Ocean
         POCS25*                                 N/A                N/A            -25           -171            10
                           (25 S)
                        Pacific Ocean
         POCS30*                                 N/A                N/A            -30           -176            10
                           (30 S)
                                                                  United
           PSA          Palmer Station        Antarctica                         -64.92          -64             10
                                                                  States
           RPB          Ragged Point             N/A             Barbados        13.165        -59.432           15
           SEY           Mahe Island             N/A            Seychelles       -4.682         55.532            2
                                                                 United
           SHM          Shemya Island           Alaska                           52.711        174.126           23
                                                                  States
                                                                American
           SMO             Tutuila               N/A                            -14.247        -170.564          42
                                                                 Samoa
                                                                 United
           SPO            South Pole          Antarctica                         -89.98          -24.8          2810
                                                                  States
                        Ocean Station
           STM                                   N/A               Norway          66             2               0
                             M
           SYO          Syowa Station         Antarctica         Japan          -69.013         39.59            14
                           Tae-ahn                             Republic of
           TAP                                   N/A                             36.738        126.133           16
                          Peninsula                              Korea
           USH             Ushuaia               N/A           Argentina        -54.848        -68.311           12
                                                                 United
           UTA            Wendover               Utah                            39.902        -113.718         1327
                                                                 States
           UUM            Ulaan Uul              N/A            Mongolia         44.452        111.096          1007
                         Weizmann
                         Institute of
           WIS                                  Ketura             Israel        29.965         35.06            151
                        Science at the
                        Arava Institute
                                                                Peoples
           WLG          Mt. Waliguan             N/A          Republic of        36.288         100.896          3810
                                                                 China
                                                              Norway and
            ZEP           Ny-Alesund        Svalbard                             78.907          11.888           474
                                                                Sweden
*
  Latitude values given for the POCN and POCS sites are the centers of latitude bands of +/- 2.5 degrees, and observations can
fall anywhere within those bands.

                                                               4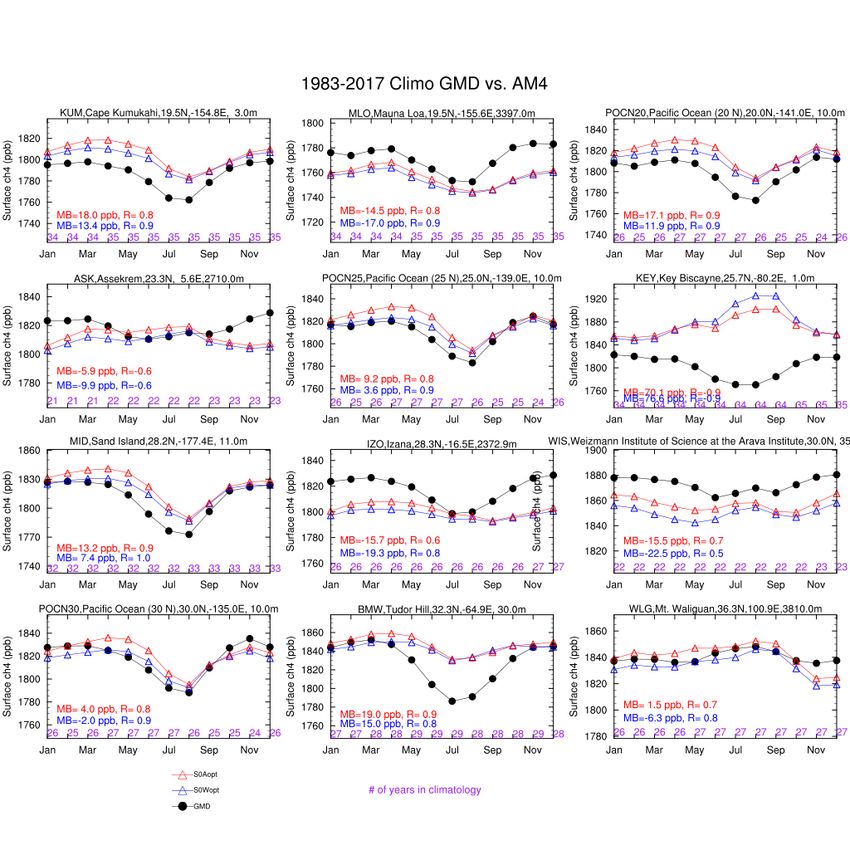
Figure S1. NOAA-GMD marine boundary layer (MBL) sites selected for background methane calculation.

                                                       5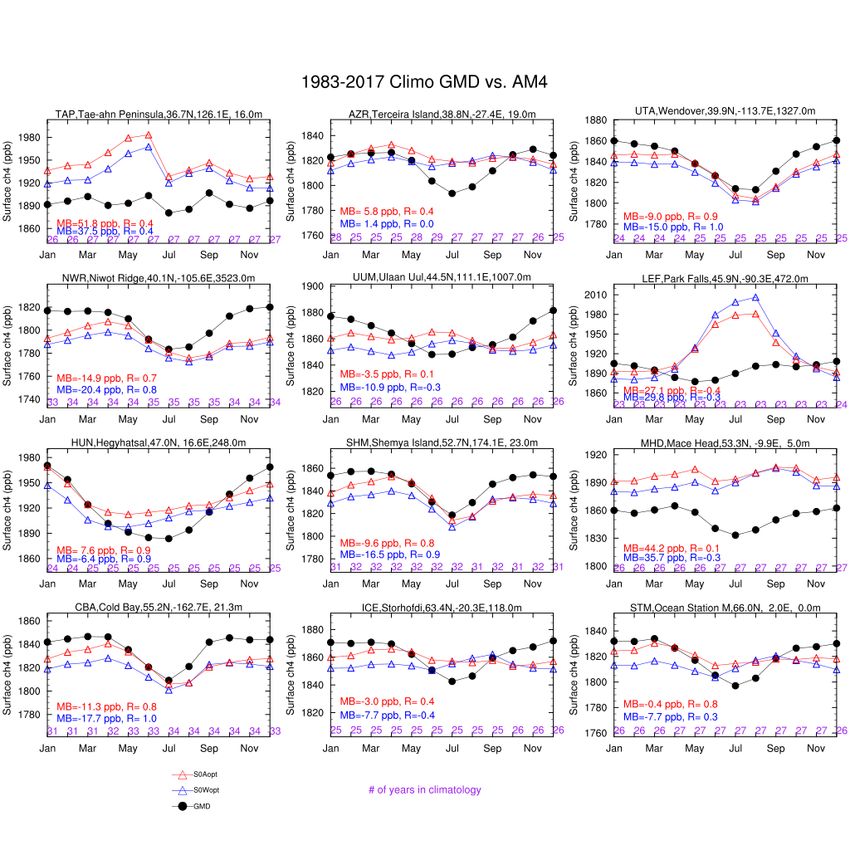
S2. Evaluation of model simulations with initial emission inventories

We conducted two model simulations with the initial methane emissions inventories for 1980-2017: 1) the initial emissions
described in Section 2.1 in the main text (referred to as “S0Orig”); 2) same as S0Orig but with time-varying wetland emissions
based on an extended ensemble version of WetCHARTs for 2001-2015 (Bloom et al., 2017), which is referred to as “S0Origtswet”.
The model evaluation of the two simulations are shown in Figure S2 and S3.

                   (a)                                       (b)                                       (c)

                   (d)                                      (e)                                        (f)
Figure S2. Comparison of GFDL-AM4.1 simulated methane concentrations and growth rates with NOAA-GMD surface
observations with initial emission inventories. For the upper plot in each panel, dash line represents smoothed trends (i.e.,
12-month running mean) from deseasonalized monthly data. A meridional curve (Tans et al., 1989) was fitted through
NOAA-GMD site observations to get the latitudinal distribution of methane. A function fit consisting of yearly harmonics
and a polynomial trend, with fast fourier transform and low pass filtering of the residuals are applied to the monthly
mean methane DMF (Thoning et al., 1989; Thoning, 2019) to approximate the long-term trend. For the lower plot in each
panel, the growth rates are calculated from the time derivative of the dash line in the corresponding upper plot.

                                                              6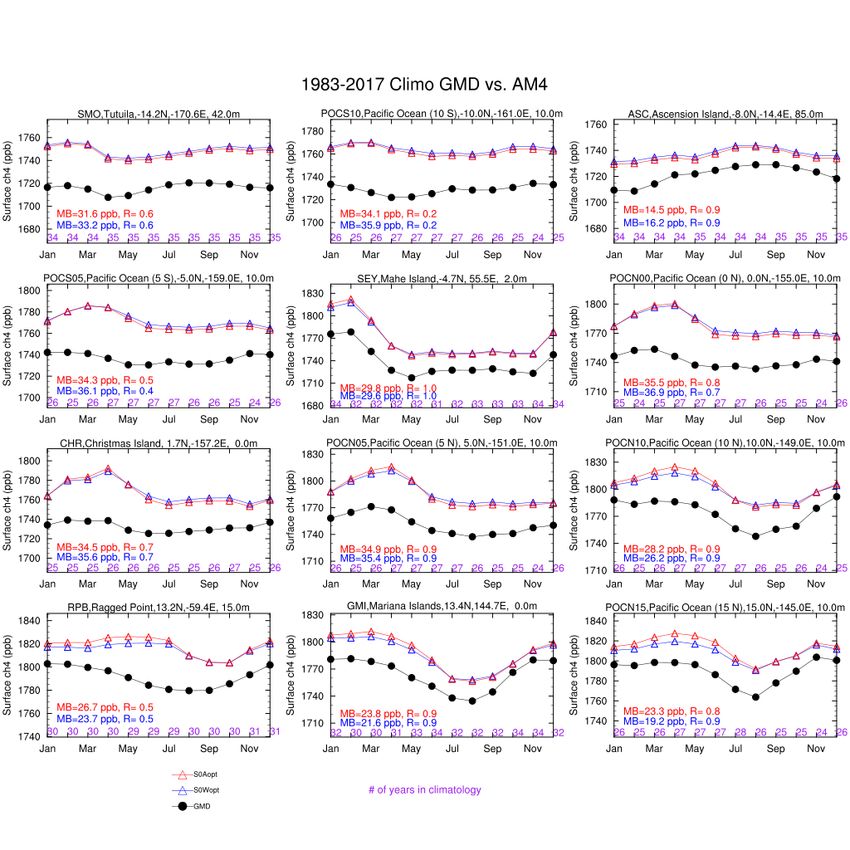
(a)                                 (b)                                 (c)

                   (d)                              (e)                                    (f)
Figure S3. Comparison of GFDL-AM4.1 simulated methane seasonal cycles of 2001-2015 with NOAA-GMD surface
observations with initial emission inventories.

                                                      7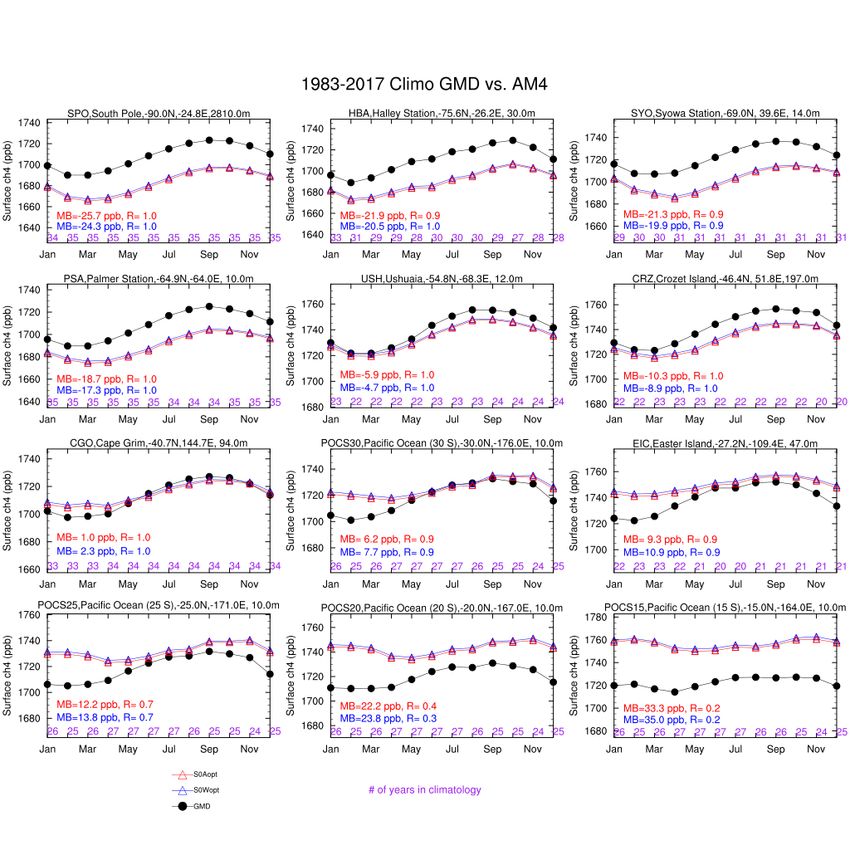
S3. Surface evaluation at individual sites

                                             8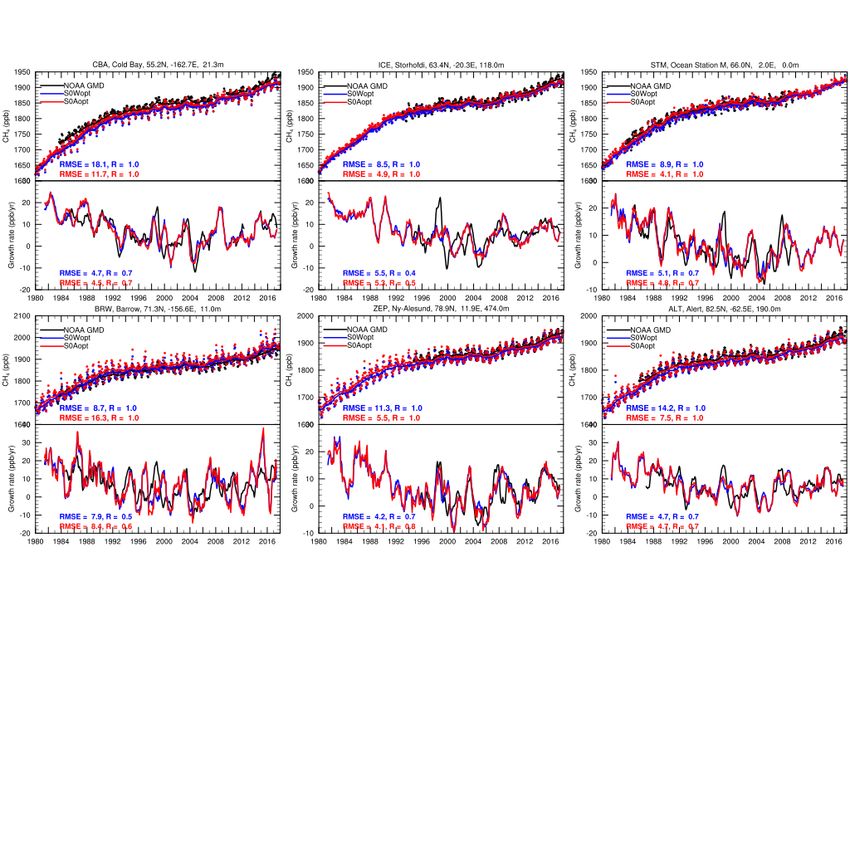
9
10
11
Figure S4. Comparisons of methane seasonal cycles against NOAA-GMD observations.

                                                      12
13
14
15
16
Figure S5. Comparisons of surface CH4 dry-mole fractions and growth rates to NOAA-GMD observations.

                                                       17
S4. Satellite evaluation
Due to the sparseness of the ground-based observational sites, especially over continental regions, we also evaluate simulated
methane against satellite retrievals to reveal information on regional characteristics. Total column-averaged methane DMFs are
evaluated against satellite retrievals from the Scanning Imaging Absorption Spectrometer for Atmospheric Chartography
(SCIAMACHY) instrument on board the European Space Agency’s environmental research satellite ENVISAT (Frankenberg et
al., 2011) for January 2003 to April 2012 and the Thermal And Near Infrared Sensor for carbon Observations – Fourier Transform
Spectrometer (TANSO-FTS) instrument onboard the Japanese Greenhouse gases Observing SATellite (GOSAT) (Kuze et al.,
2016) for April 2009 to December 2016. We compare monthly mean satellite retrievals with simulated monthly mean methane.
Retrieval-specific averaging kernels are also applied to simulated monthly mean methane to calculate simulated column-averaged
methane DMF.
Unlike the evaluation of global mean surface methane DMF, which is based on observations from a number of sites with well-
mixed MBLs, the evaluation of global mean column-averaged methane DMF against satellite retrievals mainly covers continents,
considering the impacts from polluted areas and the contributions from the troposphere and the stratosphere. Simulated monthly
mean column-averaged methane DMF are compared with satellite retrievals (e.g., SCIAMACHY and GOSAT) in Figure S5. The
averaging kernels of SCIAMACHY and GOSAT are individually applied to the model to calculate column-averaged methane
abundances. Both simulations are able to capture the monthly variation of methane with R greater than 0.9, but underestimate
column-averaged methane, with RMSE of about 21 ppb and 29 ppb when compared to SCIAMACHY and GOSAT retrievals,
respectively. The differences in the column-averaged methane abundances between satellite retrievals and model simulations are
mostly within 2% except in polar regions where there are large uncertainties in the satellite retrievals. Both simulations are also
able to capture the latitudinal distribution of the column-averaged methane DMF with R close to 1.
Figure S6. Comparisons of column-averaged methane concentrations with SCIAMACHY (left) and GOSAT (right)
satellite retrievals.
18S5. Spatial distribution
As described in Section 2.3, the emission optimization is conducted for anthropogenic sectors (i.e., S0Aopt) and wetland sector
(i.e., S0Wopt). Although global total methane emissions are the same for S0Aopt and S0Wopt, they have different allocations for
anthropogenic and wetland sectors and different spatial distributions as well. Here we analyze the sensitivity of sector optimization
on the spatial distribution of simulated methane concentrations. Figure S7 shows the spatial distributions of the simulated methane
DMF at surface by S0Aopt and S0Wopt and Figure S8 shows the spatial distributions of the differences in surface methane
abundance between S0Aopt and S0Wopt during the four periods (i.e., 1980-1989, 1990-1999, 2000-2006, and 2007-2017). Surface
methane is always lower in Aopt than Wopt in the tropics (e.g., 15o S-10o N) during the four periods. This is mainly due to much
lower wetland emissions in S0Aopt than in S0Wopt (Figure S9), which dominates total emissions over these regions (e.g., tropical
South America and Central Africa). There is not much difference in surface methane over low and high southern latitudes (e.g.,
15-90o S) between the two simulations. This agreement is mainly because larger anthropogenic emissions in S0Aopt compensate
smaller wetland emissions, producing only small differences in the total emissions, within 0.1 Tg yr-1. Unlike the Southern
Hemisphere, surface methane concentrations are in general higher in S0Aopt than S0Wopt in the Northern Hemisphere, especially
over the Eastern U.S. and Eurasia, due to much higher anthropogenic emissions in S0Aopt. The lower surface methane values in
S0Aopt over northern Canada are due to much lower wetland emissions in S0Aopt.
Figure S10 shows the methane growth rates simulated by Aopt and Wopt during the four time periods. Global mean methane
growth rates simulated by Aopt and Wopt are very consistent during the four periods, with growth rates decreasing from 1980s to
1990s, stabilizing during 2000-2006, and increasing after 2007. During the 1980s and 1990s, methane growth rates in both S0Aopt
and S0Wopt increase over most of the globe except a decrease over Russia, due to significant decreases in anthropogenic emissions
(mainly from the energy sector) in the former Soviet Union, consistent with previous studies (Dlugokencky et al., 2011). During
2000-2006, methane growth rates increase significantly over East Asia in both S0Aopt and S0Wopt while they decrease over
tropical South America and Central Africa in S0Wopt but not in Aopt. This is mainly due to decreases in wetland emissions in the
S0Wopt case, while wetland emissions are constant for each year in Aopt case. After 2007, both Aopt and Wopt suggest large
increases in methane growth rates over East Asia (mainly due to increases in anthropogenic emissions) by up to ~38 ppb yr-1 with
smaller increases elsewhere (< 7 ppb yr-1) while noticeable increases over the Arctic ( > 7 ppb yr-1). The relatively large methane
growth over the Arctic is mainly due to increases in anthropogenic methane from lower latitudes.
As discussed in Sections 3.1 and 3.2, the similarity in S0Aopt and S0Wopt simulation results suggests that for 3-dimensional
chemistry transport models, reasonable estimates of total global methane emissions are critical for global methane predictions,
despite the uncertainties in the spatial distribution of the emissions and in the estimates of individual sources, which are more
important for regional methane predictions. At the same time, accurate estimates of individual sources are necessary to attribute
the methane trend and variability into individual sources.
19Figure S7. Surface CH4 dry-air mole fractions by S0Aopt and S0Wopt overlaid with NOAA-GMD surface observations
for the periods of 1980-1989, 1990-1999, 2000-2006, and 2007-2017. The circles represent observations at individual sites.
20Figure S8. Absolute difference in surface CH4 predictions between S0Aopt and S0Wopt for the periods of 1980-1989,
1990-1999, 2000-2006, and 2007-2017.
Figure S9. Absolute difference in total annual methane emissions between S0Aopt and S0Wopt for the periods of 1980-
1989, 1990-1999, 2000-2006, and 2007-2017.
21Figure S10. Spatial distribution of surface methane growth (ppb/yr) by S0Aopt (upper panel) and S0Wopt (lower panel)
overlaid with NOAA-GMD surface observations for the periods of 1980-1989, 1990-1999, 2000-2006, and 2007-2017. The
circles represent observations at individual sites.
22References:
Bloom, A. A., Bowman, K. W., Lee, M., Turner, A. J., Schroeder, R., Worden, J. R., Weidner, R., McDonald, K. C., and Jacob,
D. J.: A global wetland methane emissions and uncertainty dataset for atmospheric chemical transport models (WetCHARTs
version 1.0), Geosci. Model Dev., 10, 2141-2156, https://doi.org/10.5194/gmd-10-2141-2017, 2017.
Dlugokencky, E. J., Nisbet, E. G., Fisher, R., and Lowry, D.: Global atmospheric methane: budget, changes and dangers, Philos.
T. R. Soc. A, 369, 2058–2072, 2011.
Frankenberg, C., Fisher, J. B., Worden, J., Badgley, G., Saatchi, S. S., Lee, J.-E., Toon, G. C., Butz, A., Jung, M., Kuze, A., and
Yokota, T.: New global observations of the terrestrial carbon cycle from GOSAT: patterns of plant fluorescence with gross
primary productivity, Geophys. Res. Lett., 38, 1–6, doi:10.1029/2011GL048738, 2011.
Kuze, A., Suto, H., Shiomi, K., Kawakami, S., Tanaka, M., Ueda, Y., Deguchi, A., Yoshida, J., Yamamoto, Y., Kataoka, F.,
Taylor, T. E., and Buijs, H. L.: Update on GOSAT TANSO-FTS performance, operations, and data products after more than 6
years in space, Atmos. Meas. Tech., 9, 2445-2461, doi:10.5194/amt-9- 2445-2016, 2016.
Tans, P. P., Conway, T. J., and Nakazawa, T.: Latitudinal distribution of the sources and sinks of atmospheric carbon dioxide
derived from surface observations and an atmospheric transport model, J. Geophys. Res., 94, 5151–5172,
doi:10.1029/JD094iD04p05151, 1989.
Thoning, K. W.: Curve Fitting Methods Applied to Time Series in NOAA/ESRL/GMD, path:
https://www.esrl.noaa.gov/gmd/ccgg/mbl/crvfit/crvfit.html, 2019.
Thoning, K.W., Tans, P. P., and Komhyr, W. D.: Atmospheric carbon dioxide at Mauna Loa Observatory, 2. Analysis of the
NOAA/GMCC data, 1974-1985, J. Geophys. Res., 94, 8549-8565, 1989.
23You can also read