Evaluation of chlorophyll a extraction techniques * - SUNY ...
←
→
Page content transcription
If your browser does not render page correctly, please read the page content below
Evaluation of chlorophyll a extraction techniques*

                                  Marissa Mehlrose1 and Kiyoko Yokota2

                                              INTRODUCTION

          Chlorophyll a is a pigment essential for electron transport during photosynthesis, making
it vital to the success of all photosynthetic organisms. Because it is found in all organisms that
photosynthesize, and its concentration is relative to the biomass of the organism, it is commonly
used as an indicator of the planktonic algal biomass in water samples (Wasmund et al. 2006).
The process of extracting the chlorophyll a from the sample appears to be a key step in
chlorophyll a analysis; in order to get the accurate and most consistent results, it is important to
determine which method of extraction is the best (Simon and Helliwell 1998).

        Typically, chlorophyll a determinations involve passing raw water through glass fiber
microfilters to remove algae from the samples, then performing methods to extract chlorophyll a
from these filters through chemical and physical means (APHA 1989). Despite the extraction
being such an important step, there is still conflicting evidence on which methods are most
effective (Simon and Helliwell 1998; Nelson 1981). Some suggest that disrupting the cell wall
mechanically and creating a homogeneous mixture is the best way to ensure all chlorophyll a is
extracted (Simon and Helliwell 1998), while others suggest that leaving the cells intact in
solution is just as efficient (Saratory and Grobbelaar 1984).

        The ability of certain solvents to facilitate extraction has also been debated, as some
report that acetone is not effective on green algae (chlorophytes) and blue-green algae
(cyanophytes) (Arvola 1981; Shoaf and Lium 1976), though it has been commonly used (APHA
1989). It has also been suggested that ethanol is a better solvent choice because it is safer to
work with, and that it works well with all phyla of algae (Arvola 1981). Filter type could also
influence reported chlorophyll a concentrations, as filters with smaller pores would be expected
to collect smaller-celled (nano- and pico-) phytoplankton. Additionally, chlorophyll a extraction
could be a function of the amount of time that the processed filter is subjected to chemical
extraction by the solvent.

        Historically, chlorophyll a processing at the BFS lab has involved passing water through
a GF/A glass microfiber filter under low pressure vacuum. Filters were cut into pieces, placed in
a grinding tube to which 90% buffered acetone had been added, and ground into a slurry with a

* Addendum (9th page) issued 6 July 2021
1
    Department of Marine Biology and Environmental Science, University of New Haven.
2
    Assistant Professor of Biology, SUNY Oneonta.
grinding pestle. After approximately two hours of incubation followed by centrifugation,
chlorophyll a in the supernatant was determined fluorometrically according to Arar and Collins
(1997). While providing reasonably reproducible results, the process was time consuming and
not proven to be optimal.
This experiment aimed to evaluate the combinations of solvent type, glass filter pore size,
and the inclusion of physical disruption (i.e., use of a tissue grinder) on the effectiveness of
chlorophyll a extraction from surface waters. After this work commenced, preliminary results
indicated that measuring chlorophyll a immediately after processing the filters resulted in
underestimation of chlorophyll a concentrations. Therefore, the additional variable included in
the matrix was whether chlorophyll a was determined immediately after extraction or whether it
was held to “steep” (soak) in the solvent for three hours prior to determination.
METHODS
Samples were analyzed from two water bodies in Otsego County, New York. Otsego
Lake (Figure 1) is a deep oligotrophic lake of glacial origin (Waterfield and Albright 2016).
Conversely, Moe Pond (Figure 2) is a shallow, eutrophic pond (Busby and Casscles 2016).
Sampling water from two such distinct sources was intended to represent samples having distinct
and variable algal communities, including differing taxa and cell size distributions.
In order to determine which method of chlorophyll a extraction worked best, different
combinations of filter paper, solvent, and sample extraction methods were used to determine
which combination produced the highest and most consistent concentrations, thus providing the
best results. Initial work compared a 3 hour soaking (or “steeping”) step during the extraction
process vs. immediate sample processing following sample filtration and placement of the filter
into the solvent. The combinations of each of these four variables yielded sixteen distinct
iterations, which are summarized in Table 1. These sixteen methods were evaluated on both
Otsego Lake and Moe Pond samples, with each evaluation having five trials.
Table 1. Thirty-two (= 25) combinations of the five major factors in chlorophyll a extraction,
each with two levels, that were evaluated. N = 5 for each of 32 combinations, resulting in 25 × 5
= 160 samples total.
Solvent type Grinding Filter Type Steeping Sample source
Buffered acetone Ground GF/A No steeping Otsego Lake
(oligotrophic)
Ethanol Not ground GF/F 3 hour steeping Moe pond
(eutrophic)Collection
Using a 20-liter carboy, 12 liters of water were collected from Rat Cove in Otsego Lake
(Figure 1) on 7 July 2016 and from Moe Pond (Figure 2) on 20 July 2016. These samples were
transported in low light conditions, and all work was performed in low light to minimize
degradation of chlorophyll a (APHA 1989). Sub-samples of the water from the lake and pond
were preserved with approximately 1 mL of Lugol’s iodine for later microscopic evaluation of
algal communities.
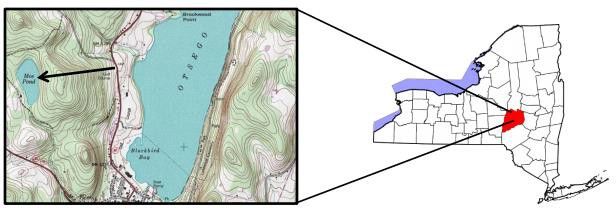
Sample site
Figure 1. The location of sampling in Otsego Lake in Cooperstown, NY (from Waterfield and
Albright 2016 ).Figure 2. The location of Moe Pond in Cooperstown, NY (from Busby and Casscles 2015).
Processing
Samples were filtered immediately to prevent degradation of chlorophyll a. For Otsego
Lake samples, a volume of 250 mL was filtered, and for Moe Pond samples, 100 mL was
filtered. This was based on the chlorophyll a concentration ranges anticipated. Two types of 4.7
cm diameter Whatman® glass microfiber filters were compared: GF/A filter papers (having a
pore size of 1.6 μm) and GF/F filter paper (having a pore size of 0.7 μm). All samples were
filtered using a low pressure (15 psi) vacuum pump. Once filtration was complete, filters were
folded in half with the exposed side inside, gently pressed onto paper towel to remove excess
water, and the edges not contacted by the sample were trimmed. Each filter was stored in a petri
dish wrapped in aluminum foil and stored at -4 °C for 21- 24 hours.
A total of 160 filters were preserved, 80 for each Otsego Lake and Moe Pond samples
(Table 1). Half of the filters used were GF/A filters and half were GF/F filters (see above). In all
cases, using fine scissors, the filters were cut into small (~ 3 mm x 3 mm) pieces. Half of each of
these filters were extracted using buffered acetone, the other half using ethanol. Half of each of
these treatments were ground to a slurry using a Teflon pestle chucked in an electric drill and a
grinding tube (with the pestle and tubes being rinsed well between samples to avoid cross-
contamination), the other half were not ground. Both the cut up filter pieces and the ground
slurries were transferred to 15 ml centrifuge tubes and the volume of solvent was taken up to 10
ml. Half of each of these treatments were allowed to steep for three hours under refrigeration, the
other half were processed immediately.
At the appropriate times (either immediately or after three hours), the samples were
centrifuged at 10,000 xG for ten minutes and chlorophyll a concentrations were determined on
the supernatant using a Turner Designs TD 700® fluorometer using the methods of Arar and
Collins (1997).Algal Analysis
Ten milliliters of algal samples preserved with Lugol’s iodine were poured into an
Utermöhl settling chamber and refrigerated for a minimum of 24 hours to allow the
phytoplankton cells to sink to the bottom of the chamber. The algal cells were identified and
enumerated using an inverted microscope under a 40 x objective using taxomic keys by Bellinger
and Sigee (2010) and Prescott (1964).
RESULTS
Figure 3 compares chlorophyll a concentrations from samples collected from the
oligotrophic Otsego Lake, processed using different filter types, extraction solvents, filter
grinding vs no grinding, and steeping vs no steeping. When compared to the same filter and
extraction method, all filters with an extraction time of 3 hours showed higher chlorophyll a
concentrations than those that were centrifuged immediately after filtering (no steep).
7.5
6.5
Chlorophyll a concentration (μg/L)
5.5
4.5
GF/A 2 3 hr. steep
3.5 GF/A 1 no steep
2.5 GF/F 2 3 hr. steep
1.5 GF/F 1 no steep
0.5
-0.5 Acetone Ground Acetone Not Ground Ethanol Ground Ethanol Not Ground
Method
Figure 3. Comparison of Otsego Lake chlorophyll a values when the filters were allowed to
steep for three hours compared to values being obtained immediately after filtering. GF/A “no
steep” and GF/F “no steep” were processed immediately (without a steeping period), while GF/A
“3 hr. steep” and GF/F “3 hr. steep” had an extraction time of 3 hours before processing.
Otsego Lake chlorophyll a concentrations derived from the different filter types were
similar when those filters were ground as part of the extraction process. However, the GF/F
filters provided higher chlorophyll a concentrations when the filters were not ground. Not
grinding the samples resulted in more consistent chlorophyll a concentrations, and when thefilters were not ground, acetone was somewhat more effective as an extractant than was ethanol
(Figure 4).
7.5
6.5
Chlorophyll a concentration (μg/L)
5.5
4.5
3.5
GF/A
2.5 GF/F
1.5
0.5
-0.5 Acetone Ground Acetone Not Ground Ethanol Ground Ethanol Not Ground
Method
Figure 4. Comparison of methods used to obtain chlorophyll a concentrations on two different
filter types and extraction methods using water from Otsego Lake, NY.
The eutrophic Moe Pond samples also indicated that GF/F filters were more effective
than GF/A filters, and not grinding the filters resulted in the highest chlorophyll a concentration
(Figure 5). Acetone resulted in somewhat higher chlorophyll a concentrations than ethanol in
the Moe Pond water samples.
40
Chlorophyll a concentration (μg/L)
35
30
25
20
GF/A
15
GF/F
10
5
0
Acetone Ground Acetone Not Ground Ethanol Ground Ethanol Not Ground
Method
Figure 5. Comparison of methods used to obtain chlorophyll a concentrations on two different
filter types and extraction methods using water from Moe Pond, NY.The relative abundance of algal genera was quantified in order to assess relative
abundance of green algae and cyanobacteria in the oligotrophic Otsego Lake and the eutrophic
Moe Pond, to evaluate the effectiveness of acetone and ethanol as solvents for extracting
chlorophyll a from two different types of phytoplankton samples. In Otsego Lake, the majority
of the identifiable taxa were diatoms (bacillariophytes), and only a small percentage of the algae
were cyanobacteria (cyanophytes) or green algae (chlorophytes) (Figure 6).
450 411
400
350
Number of Cells
300
240
250
200
150
100 75 72 82
60
50 30 27 32
16 5 8 16
1
0
Genera
Figure 6. The abundance of genera found in a 10 mL sample of Otsego Lake water. Striped bars
indicate green algae (chlorophytes), a dotted bar indicates a cyanobacterium (cyanophyte).
There was much less algal diversity in the Moe Pond samples than in the Otsego Lake
samples, with Rhodomonas (a cryptophyte) being the most abundant, and Anabaena (a
cyanophyte) and Monoraphidium (a chlorophyte) being the second and third most abundant
(Figure 7).700 686
600
500
Abundance
400
300
216 210
200
100
1 2 17 22 9
0
Genera
Figure 7. The abundance of genera present found in 10 mL of preserved Moe Pond water.
Striped bars (incl. Mougiotia) indicate green algae (chlorophytes), dotted bars indicate
cyanobacteria (cyanophytes).
DISCUSSION
In both the eutrophic Moe Pond and the oligotrophic Otsego Lake water samples, the
highest chlorophyll a concentrations (and, presumably, the most effective method of extraction)
came from the samples passed through GF/F filters, used buffered acetone as a solvent, were not
ground, and were allowed to steep for three hours in the solvent before being analyzed
fluorometrically. Replicates of samples that were not ground had smaller within-group variance
and therefore better reproducibility. The process of grinding seemed to introduce several
additional uncontrolled variables such as pressure and speed of pestle, pulsing vs. continuous
grinding, etc. that increased error, which would account for the larger variance, especially when
a large number of individuals perform the same protocol. Also when grinding, it is possible that
incomplete or inconsistent rinsing of the pestle and grinding tube could lead to cross-
contamination, or sample loss by spilling or evaporation (Wasmund et al. 2006) could cause
concentration and overestimation of chlorophyll a. Frictional heat generated by the grinding
process could cause chlorophyll a degradation as well as evaporation of solvents.
Implementing an extraction steep of 3 hours significantly increased the effectiveness of
chlorophyll a extraction when evaluated on Otsego Lake water samples. By allowing the
samples to steep for that duration, maximum extraction efficiency of the ethanol was achieved(Arvola 1981). Evidence has suggested that acetone is an insufficient solvent for chlorophyll a
extraction from chlorophytes and cyanophytes (Shoaf and Lium 1976; Arvola 1981; Saratory and
Grobbelaar 1984; Wasmund et al. 2006). However, when allowed to steep for three hours, data
presented here suggest that for the algal taxa present in both Otsego Lake and Moe Pond (14.3%
of Otsego Lake and 37.5% of Moe Pond samples and samples were composed of green and blue-
green algae, respectively, by cell counts), acetone was a more effective solvent than was ethanol.
CONCLUSIONS
When sampling water bodies as diverse as the large, deep and oligotrophic Otsego Lake
to small, shallow and eutrophic Moe Pond, the most effective chlorophyll a extraction was
achieved by using GF/F filters, buffered acetone, not grinding the filters and allowing for an
extraction time of at least 3 hours. This combination consistently yielded higher chlorophyll a
concentrations and also decreased variability between sample replicates compared to other
combinations. Not having to expend the time required to grind the filters reduces the laboratory
processing time and effort considerably. One factor that remains untested is the duration of filter
storage in a freezer at - 20 °C between sample filtration and further processing; it was about 24
hours for filters in this study. The effect of varying this time, or of eliminating it, was not
evaluated.
ADDENDUM
This report resulted from a short-term summer undergraduate research project, which
included a limited number of local samples with no known standards or dilution series. The
applicability of the findings in this report to samples beyond those used in the original study has
not been systematically evaluated nor peer-reviewed. KY has since found that the abbreviated (no
grinding, 3-hour steep) chlorophyll extraction protocol can result in insufficient pigment extraction
in some samples when compared to the USEPA Methods 445.0 and 446.0. Care should be taken if
you consider adopting this abbreviated method in your study. (K. Yokota, 6 July 2021)
REFERENCES
APHA, 1989. Standard methods for the examination of water and wastewater. 17th Edition.
American Public Health Association, Washington, DC.Arar, E.J. and G.B. Collins.1997. Method 445.0, In Vitro Determination of Chlorophyll a and
Pheophytin a in Marine and Freshwater Algae by Fluorescence. In Methods for
the Determination of Chemical Substances in Marine and Estuarine Environmental
Matrices, 2nd Edition. National Exposure Research Laboratory, Office of Research
and Development, USEPA., Cincinnati, Ohio. EPA/600/R-97/072.
Arvola, L. 1981. Spectrophotometric determination of chlorophyll a and phaeopigments in
ethanol extractions. Annales Botanici Fennici 18 (3): 221-227.
Bellinger, E.G. and Sigee D.C. 2010. Freshwater algae: Identification and use as bioindicators.
West Sussex (UK): John Wiley & Sons, Ltd.
Busby, D. and Casscles B. 2016. Continued monitoring of the Moe Pond ecosystem in
conjunction with biomanipulation. In 48th Annual Report (2015). SUNY Oneonta Biol.
Fld. Sta., SUNY Oneonta.
Nelson, D.J. 1981. Improved chlorophyll extraction method. Science 132 (3423): 351.
Prescott, G.W. 1964. How to know the freshwater algae. Dubuque (IA): WM. C. Brown
Company.
Saratory, D. P. and J.U. Grobbelaar. 1984. Extraction of chlorophyll a from freshwater
phytoplankton for spectrophotometric analysis. Hydrobiologia 114: 177-187.
Shoaf, W.T. and B.W. Lium. 1976. Improved extraction of chlorophyll a and b from algae using
dimethyl sulfoxide. Limnology and Oceanography 21(6): 926-928.
Simon, D. and S. Helliwell. 1998. Extraction and quantification of chlorophyll a from
freshwater green algae. Wat. Res. 32 (7): 2220-2223.
Wasmund N., L. Topp and D. Schories. 2006. Optimising the storage and extraction of
chlorophyll samples. Oceanologia 48 (1): 125-144.
Waterfield, H.A. and M.F. Albright. 2016. Otsego lake limnological monitoring, 2015. In 48th
Ann. Rept. (2015). SUNY Oneonta Biol. Fld. Sta., SUNY Oneonta.You can also read