IN PRESS, ACCEPTED MANUSCRIPT - NOTE TO USER - IJNEAM UNIMAP
←
→
Page content transcription
If your browser does not render page correctly, please read the page content below
International Journal of Nanoelectronics and Materials

In Press, Accepted Manuscript – Note to user
 Analysis on Continuous Wearable Device for Blood Glucose Detection
                         Using GSR Sensor
     W.H.M Saad1,2*, N.A. Rahman1, M. S. Karis3, S.L. Chia1, S.A.A Karim4, M.H. Talib5 and M.S.J.A. Razak6

  1Facultyof Electronics and Computer Engineering, Universiti Teknikal Malaysia Melaka, 76100 Durian
                                        Tunggal, Melaka, Malaysia.
  2Centre for Telecommunication Research & Innovation (CeTRI), Universiti Teknikal Malaysia Melaka,

                                 76100 Durian Tunggal, Melaka, Malaysia.
 3Faculty of Electrical Engineering, Universiti Teknikal Malaysia Melaka, 76100 Durian Tunggal, Melaka,

                                                  Malaysia.
       4Department of Electrical, Politeknik Ibrahim Sultan, 81700 Pasir Gudang, Johor, Malaysia
            5Coffs Medical Centre, Gordan St, Coffs Harbour, New South Wales, 2450, Australia
                         6MSJ Perwira Enterprise, Duyung, 75460 Melaka, Malaysia.

                                                     ABSTRACT

         This paper presents the development of a non-invasive approach to detect the blood glucose
         level using a galvanic skin response (GSR) technique. Previously, GSR had been used in many
         applications such as lie detector and emotion monitoring. GSR application on blood glucose
         reading has shown a promising potential detecting the blood glucose reading. The
         experimental study has been conducted to analyses the conductivity of the GSR sensor in
         order to find the correlation between skin conductance and the blood glucose level. The GSR
         sensor is used to measure the skin conductivity between two electrodes attached to the two
         fingers of the same hand and the electrodes are connected to the analogue input of the
         microcontroller to process the readings and display it. While taking a reading, the skin
         temperature and movement variation were minimized. The reading of GSR is taken on
         several samples throughout the day and compare with the reading taken by conventional
         finger pricking method. From the result, it shows a significant correlation between blood
         glucose level and GSR readings which inversely proportional to each other with correlation
         factor of 0.670.

         Keywords: Galvanic Skin Response (GSR), Blood Glucose Level, Android Application
         (.apk), Firebase Database

1.   INTRODUCTION

Diabetes is an incurable condition of human body with high glucose concentration in blood.
Without a proper management of diabetes, it can lead to various complications including organs
failure and even fatal [1]. Insulin is a hormone that helps lowering glucose concentration in the
blood by storing the excessive glucose into the liver and other cells. Diabetes can be categorized
into two types, Type 1 and Type 2. Type 1 occurred when the body loses the ability to produce an
insulin while Type 2 occurred when there is a resistance to the action of insulin or the pancreas
itself cannot make enough amount of insulin to overcome the resistance [1], [2].

There are three type of approach for blood glucose monitoring method as shown in Figure 1. It
can either be using invasive, minimally invasive or non-invasive approach. In a current practice,
diabetes patient must prick their fingers in order to draw the blood to measure their glucose
concentration. The non-invasive method is a pain-free monitoring method and it is lowering the
risk of infection due to their nature of measurement that did not required to withdraw the blood.
Due to that, currently it is preferable to make a comparison between invasive and minimally
invasive method. In addition, minimally invasive and non-invasive allowing a continuous

Note: Accepted manuscripts are articles that have been peer-reviewed and accepted for publication by the Editorial Board.
These articles have not yet been copyedited and/or formatted in the journal house style.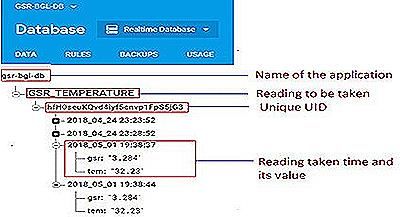
International Journal of Nanoelectronics and Materials

In Press, Accepted Manuscript – Note to user
monitoring method using a wearable sensor that can be connected to smartphone or direct to the
server and databased through an internet network [3].
__________________________________________
*wira_yugi@utem.edu.my

                          (a)                         (b)                             (c)
   Figure 1. Blood glucose monitoring approach (a) Invasive; (b) Minimally Invasive; (c) Non-invasive

The galvanic skin response (GSR) sensor is known to measure human skin conductance [3]. The
skin conductance can be influenced by a variety of factors, though the most important factor is, it
needs to be measured with enough moisture on the skin surface [5] Originally, GSR sensor was
solely used in the fields of psychology and psychoanalysis as a lie detector but it also has a
potential to be applied into the fields of medicine including measuring blood sugar concentration
[6], [7], [8].

Previously, there are a few studies and development that had been done for non-invasive device
to monitor the blood glucose level [9], [10], [11]. A comprehensive review had been done on the
sensors and the functionalities of non-invasive approach used in wrist wearable device [9], The
study has reviewed that, there are three level of functionality differences in the wrist wearable
device application. Each level is summarized in Table 1.

                Table 1 Level of application for non-invasive wearable device in monitoring
                                                the blood glucose.
 Level                                            Device Functionality
 Level 1        The device is used only for tracking and/or logging the raw inputs from the monitoring
                activities. The device will not share the information with the user who wear the device.
 Level 2        The device is used for tracking and/or logging the raw inputs from the monitoring
                activities. The output can be displayed back to the user through graphical user interface
                (GUI) form
 Level 3        The device can provide an intelligent information to the user. The output is made up
                by some mathematical formulation or machine learning model. The device can
                transform the input to a variety of information and display to the user. The output can
                also be remotely stored and viewed in the cloud or other connected devices such as
                smartphone or computer,

Even though the non-invasive approach has been trendily developed among the researcher, the
accuracy issue, device calibration issue and the standard device regulatory are still the most
challenging matter to make this approach towards replacing the current practice [10]. By using
GSR as a sensor to measure the sweat, this study is under categories of non-invasive: electrical
bio-impedance (EBI) for Level 3 application for non-invasive wearable device for monitoring
blood glucose. The advantages of this bio-impedance are that these methods are inexpensive, and
easy to use it on the skin. Meanwhile, the disadvantages of the measurement taken might be
influence by variations of temperature and motion of the hands while taking the results. At the
same time, the sensor placement contributed towards the reading value as the sensor itself is
quite sensitive to the amount of sweat and electrolyte content in the sweat itself.

Note: Accepted manuscripts are articles that have been peer-reviewed and accepted for publication by the Editorial Board.
These articles have not yet been copyedited and/or formatted in the journal house style.
International Journal of Nanoelectronics and Materials
In Press, Accepted Manuscript – Note to user
This study aims to find the correlation between skin conductance and the blood glucose level
while other factors such as skin temperature, amount of sweat and body movement are remained
constant. This paper outline starting with the introduction section related to the topics and
followed by the methodology of the overall process as stated in Section 2.0. Section 3.0 present
the result and discussion and the last section is Section 4.0 explaining the conclusion of the whole
study.
2. MATERIAL AND METHODS
The development of the GSR systems was divided into two parts, which are hardware and
software implementation. For hardware part, a conditional circuit was built using GSR and
temperature sensor to detect human skin conductance and skin temperature that has a
correlation with blood glucose level. For the software part, microcontroller was coded to collect
user data. A smartphone application was created to read the data send by microcontroller to the
phone via Bluetooth 4.0.
1.1 Development of GSR system and circuit
The whole conditional circuit consists of two main part; the first part is the GSR sensor (detector)
circuit for skin conductance measurement. The second part is a temperature sensor circuit which
is used to measure the skin temperature of the user. The GSR sensor monitors skin conductivity
between two reusable electrodes attached to the two fingers at the same hand. Figure 2 shows
the overall schematic design of the hardware prototype.
Figure 2. Schematic design of the hardware prototype
2.2 System application and database
Bluno Beetle microcontroller is programmed by using Arduino IDE environment. The
microcontroller is coded to read the GSR and skin temperature measurement. The measurements
taken by the microcontroller are sent to a smartphone for display purposes. The application
(.apk) with the name of “GSR-BGL” is created and the main GUI of the created application is as
shown in Figure 3
Note: Accepted manuscripts are articles that have been peer-reviewed and accepted for publication by the Editorial Board.
These articles have not yet been copyedited and/or formatted in the journal house style.International Journal of Nanoelectronics and Materials
In Press, Accepted Manuscript – Note to user
.
Figure 3. GSR-BGL application on Android application
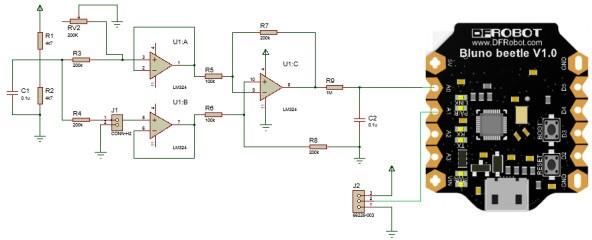
Only the authorized person with email registered in GSR-BGL application can access the
application. Each user will have an autogenerated of unique user ID as shown in Figure 4. Figure
5 shows, the real time measurement recorded to the cloud database stored under a specific user
ID.
Figure 4. GSR-BGL email authentication on Firebase database
Figure 5. Firebase cloud database
3. RESULTS AND DISCUSSION
The GSR measurement was extracted from three nondiabetic persons. It is predicted to get the
reading of the blood glucoses concentration to be less than 11 mmol/L as it is a common reading
for nondiabetic person even after taking a food. This information is very crucial in order to plan
a data intake for glucose reading in order to get a diversify variation of glucose concentration
reading [6], [11].
Note: Accepted manuscripts are articles that have been peer-reviewed and accepted for publication by the Editorial Board.
These articles have not yet been copyedited and/or formatted in the journal house style.International Journal of Nanoelectronics and Materials
In Press, Accepted Manuscript – Note to user
Table 2 User’s physical data
User Age Height (cm) Weight (kg)
User 1 24 172 64
User 2 23 180 75
User 3 22 178 70
Table 3 Average of calories intake and calories burn for each user
Section / User User 1 User 2 User 3
Calories Calories Calories Calories Calories Calories
Calories
intake burnt intake burnt intake burnt
Morning 89 2.112 270 2.794 - 5.258
Afternoon 670 3.959 485 4.446 330 6.551
Evening 810 6.048 682 8.011 884 6.729
The physical information of all three subject is shown in Table 2. On the day of the experiment is
running, subject calorie intake and calorie burn were estimated based on the types and amount
of food as well as step count by referring to the calculator in Fitness and Health Calorie Calculator.
Retrieved from https://www.calculator.net/calorie-calculator.html. The details of calorie intake
and calorie burn for each user is shown in Table 3.
3.1 Pre analysis of subject’s daily activity and its glucose reading affect
The analysis is made based on data collection on the user such as user’s GSR value, number of
steps, calories burn, skin temperature, calories intake and actual blood glucose level. These data
are essential to schedule the measurement of the glucose consumption using a finger pricking
method appropriately, as this method is mildly discomforting to be used repeatedly.
GSR (V)
Time (HH:mm)
Note: Accepted manuscripts are articles that have been peer-reviewed and accepted for publication by the Editorial Board.
These articles have not yet been copyedited and/or formatted in the journal house style.International Journal of Nanoelectronics and Materials
In Press, Accepted Manuscript – Note to user
Figure 6. GSR graph with respective blood glucose level for User 1
The GSR sensor reading in voltage had been logged in every 15 minutes for 12 hours period
continuously for all users. Figure 6 shows the GSR reading of User 1, taken throughout the days.
The same measurement was repeated for User 2 and User 3. Within that interval, six samples of
blood glucose level have been taken to be analyzed for the next experimental observation on
finding a correlation between skin conductance and the blood glucose level.
Table 4 GSR Value with respective to Blood Glucose Level
Blood Glucose Blood Glucose
GSR data (V) GSR data (V)
Level (mmol/L) Level (mmol/L)
1.963 5.7 1.293 7.1
2.213 5.7 2.035 5.9
1.625 7.6 2.693 5.3
1.330 7.4 2.492 5.8
2.681 3.8 1.676 9.4
2.454 4.3 1.394 7.0
1.966 7.1 2.013 6.8
2.192 5.9 1.303 7.3
1.408 8.8 2.682 5.1
Based on the plot in Figure 6, the blood glucose reading was up and down throughout the whole
day and as we can see from the early observation of blood glucose and GSR readings, it shows that
when the GSR value is decreased, the blood glucose reading is increased and vice versa. This
indicate that the relationship between GSR and blood glucose level are inversely proportional to
each other. This correlation is important in the process of predicting the value of the glucose
reading based on the GSR value. Details on the correlation between GSR and blood glucose
reading is further discussed in the next section.
3.2 Correlation between blood glucose concentration and GSR reading
The GSR value is measured by using the designed GSR system and blood glucose level was taken
with the help of conventional glucometer using finger pricking technique. Table 4 is a collective
data reading of GSR reading in voltage and its consecutive blood glucose level reading in mmol/L
for all user taken several times throughout the day as stated previously in Figure 6.
By using data from Table 4, the graph in Figure 7 was plotted. After putting all the data point into
the graph, a best fit line was formed with a linear equation below:
y = -2.233x + 10.83 (1)
where the y variable represents the blood glucose level and the x variable represent GSR value.
Based on the best fit line graph, it shows that there is a correlation between the GSR value and
Note: Accepted manuscripts are articles that have been peer-reviewed and accepted for publication by the Editorial Board.
These articles have not yet been copyedited and/or formatted in the journal house style.International Journal of Nanoelectronics and Materials
In Press, Accepted Manuscript – Note to user
the blood glucose level with correlation factor, R2 is 0.670. This relation is important in order to
predict the value of blood glucose level without needing to draw the blood pricking from the
finger. With the value taken by using the developed GSR system measured in voltage and apply it
in Equation 1, the value of blood glucose of users can be predicted. Minimizing the temperature
of the skin and body movement variation while taking a reading, help in stabilizing the GSR
readings and contribute to such of correlation.
Blood Glucose Level (mmol/L)
GSR data (V)
Figure 7. Correlation between blood glucose level and GSR readings.
4. CONCLUSION
At the end of the study, we manage to demonstrate a wearable embedded system device for
continuous GSR monitoring. The device can be connected wirelessly to the smartphone with its
application installed in it for display purposes. The correlation of blood glucose level and GSR
data reading is determined as inversely proportional to each other with correlation factor of 0.67.
This equation can be used for glucose reading prediction directly from GSR readings. It shows
that GSR reading can be more stable by minimizing the variation of external parameters such as,
temperature and hand movement while taking results reading. For future improvement, there
are a few suggestions that can be done to improve the whole study. First improvement is by
applying a light pleasure to the hand so that the measuring area can receive an equivalent
compression to stretch the surface for a better constant reading. Secondly, by applying an
indicator into the system such as a vibrator to the GSR device. It will help the user to stay still
while the measurement is taking place.
ACKNOWLEDGEMENTS
The authors would like to thank to the Machine Learning & Signal Processing (MLSP) research
group under Center for Telecommunication Research and Innovation (CeTRI), Rehabilitation
Engineering & Assistive Technology (REAT) research group under Center of Robotics & Industrial
Automation (CeRIA) of Universiti Teknikal Malaysia Melaka (UTeM) and Faculty of Electronics
and Computer Engineering (FKEKK), UTeM for the use of the existing facilities to complete this
project
Note: Accepted manuscripts are articles that have been peer-reviewed and accepted for publication by the Editorial Board.
These articles have not yet been copyedited and/or formatted in the journal house style.International Journal of Nanoelectronics and Materials
In Press, Accepted Manuscript – Note to user
REFERENCES
[1] Lucaccioni, L. & Iughetti, L. Issues in Diagnosis and Treatment of Type 1 Diabetes Mellitus
in Childhood. Journal of Diabetes Mellitus, Vol 6, issue 2 (2016), pp.175-183.
[2] Pratley, R. E. The Early Treatment of Type 2 Diabetes. The American Journal of Medicine,
Vol 126 issue 9 (2013), pp.2–9.
[3] Padmapriya, S. (2013). Wireless sensor networks to monitor Glucose level in blood.
International Journal of Advancements in Research & Technology, Vol 2, issue 4 (2013),
pp.322–326.
[4] Jayanthi, A. N., Nivedha R. & Vani, C. Galvanic Skin Response Measurement and Analysis.
International Journal of Applied Engineering, Vol. 10 issue 16, pp.12447–12452.
[5] Bjorklund, S., Ruzgas T. & Nowacka, A. Skin Membrane Electrical Impedance Properties
under the Influence of a Varying Water Gradient. Biophysical Journal, Vol 104, issue 2
(2013), pp.2639–2650.
[6] Saad, W.H.M., Razak, M.S.J.A., Tan, Y.S., Salam, N.A.A., Salehuddin, F., Chiew, W.Y.,
Implementation of Continuous Wearable Low Power Blood Glucose Level Detection using
GSR Sensor. Journal of Telecommunication, Electronic and Computer Engineering Vol. 10,
issue 1 (2016), pp. 59–65.
[7] Khalfallah, K., Ayouband, H., Calvet, J. H. Noninvasive Galvanic Skin Sensor for Early
Diagnosis of Sudomotor Dysfunction: Application to Diabetes. IEEE Sensors Journal, Vol. 12,
issue 3(2012), pp.456– 463.
[8] Das, T., Sharma, P., Kundu, S., Noninvasive Detection of Diabetes using Galvanic Skin
Response by its Frequency Spectrum Analysis by dint of Fast Fourier Transform.
International Journal of Computer and Mathematical Sciences, Vol. 6, issue 10((2017),
pp.2347–8527.
[9] Kamišalić, A., Fister, I., Turkanović, M., Karakatič, S. Sensors and Functionalities of Non-
Invasive Wrist-Wearable Devices: A Review. Sensors. Vol. 18, issue 6, pp.1714.
[10] Gonzales, W.V., Mobashsher, A., Abbosh, A., The Progress of Glucose Monitoring—A Review
of Invasive to Minimally and Non-Invasive Techniques, Devices and Sensors, Sensors, Vol.
19, issue 4 (2019), pp.800.
[11] Salam, N.A.A., Saad, W.H.M., Manap, Z., Salehuddin, F., The Evolution of Non-Invasive Blood
Glucose Monitoring System for Personal Application, Journal of Telecommunication,
Electronic and Computer Engineering, Vol. 8, issue 1 (2016), pp.59-65.
Note: Accepted manuscripts are articles that have been peer-reviewed and accepted for publication by the Editorial Board.
These articles have not yet been copyedited and/or formatted in the journal house style.You can also read