Deep Learning-Based Food Calorie Estimation Method in Dietary Assessment$
←
→
Page content transcription
If your browser does not render page correctly, please read the page content below
Deep Learning-Based Food Calorie Estimation Method
                                                       in Dietary AssessmentI

                                                                       Yanchao Lianga,∗, Jianhua Lia
                                           a School   of Information Science and Engineering, East China University of Science and
                                                                               Technology, China
arXiv:1706.04062v4 [cs.CV] 18 Feb 2018

                                         Abstract

                                         Obesity treatment requires obese patients to record all food intakes per day.
                                         Computer vision has been applied to estimate calories from food images. In
                                         order to increase detection accuracy and reduce the error of volume estimation
                                         in food calorie estimation, we present our calorie estimation method in this
                                         paper. To estimate calorie of food, a top view and side view are needed. Faster
                                         R-CNN is used to detect each food and calibration object. GrabCut algorithm
                                         is used to get each food’s contour. Then each food’s volume is estimated by
                                         volume estimation formulas. Finally we estimate each food’s calorie. And the
                                         experiment results show our estimation method is effective.
                                         Keywords: computer vision, calorie estimation, deep learning

                                         1. Introduction

                                            Obesity is a medical condition in which excess body fat has accumulated to
                                         the extent that it may have a negative effect on health. People are generally
                                         considered obese when their Body Mass Index(BMI) is over 30 kg/m2 . High
                                         BMI is associated with the increased risk of diseases, such as heart disease, type
                                         two diabetes, etc[1]. Unfortunately, more and more people will meet criteria
                                         for obesity. The main cause of obesity is the imbalance between the amount
                                         of food intake and energy consumed by the individuals. Conventional dietary

                                           ∗ Correspondingauthor
                                            Email addresses: yc_liang@qq.com (Yanchao Liang), jhli@ecust.edu.cn (Jianhua Li)

                                         Preprint submitted to Journal of Food Engineering                        February 20, 2018
assessment methods include food diary, 24-hour recall, and food frequency ques-
tionnaire (FFQ)[2], which requires obese patients to record all food intakes per
day. In most cases, patients do have troubles in estimating the amount of food
intake because they are unwillingness to record or lack of related nutritional
information. While computer vision-based measurement methods were applied
to estimate calories from food images which includes calibration objects; obese
patients have benefited a lot from these methods.
In recent years, there are a lot of methods based on computer vision proposed
to estimate calories[3, 4, 5, 6]. For these methods, the accuracy of estimation
result is determined by two main factors: object detection algorithm and volume
estimation method. In the aspect of object detection, classification algorithms
like Support Vector Machine(SVM)[7] are used to recognize foods type in general
conditions. In the aspect of volume estimation, the calibration of food and the
volume calculation are two key issues. For example, when using a circle plate[3]
as a calibration object, it is detected by ellipse detection; and the volume of
food is estimated by applying corresponding shape model. Another example is
using peoples thumb as the calibration object, the thumb is detected by color
space conversion[8], and the volume is estimated by simply treating the food as
a column. However, thumbs skin is not stable and it is not guaranteed that each
persons thumb can be detected. The involvement of human’s assistance[4] can
improve the accuracy of estimation but consumes more time, which is less useful
for obesity treatment. After getting foods volume, food’s calorie is calculated
by searching its density in food density table[9] and energy in nutrition table1 .
Although these methods mentioned above have been used to estimate calories,
the accuracy of detection and volume estimation still needs to be improved.
In this paper, we propose our calorie estimation method. This method takes
two food images as its inputs: a top view and a side view; each image includes
a calibration object which is used to estimate images scale factor. Food(s) and
1 http://www.hc-sc.gc.ca/fn-an/nutrition/fiche-nutri-data/nutrient_
value-valeurs_nutritives-tc-tm-eng.php
2calibration object are detected by object detection method called Faster R-CNN
and each foods contour is obtained by applying GrabCut algorithm. After that,
we estimate each food’s volume and calorie.
2. Material and Methods
2.1. Calorie Estimation Method Based On Deep Learning
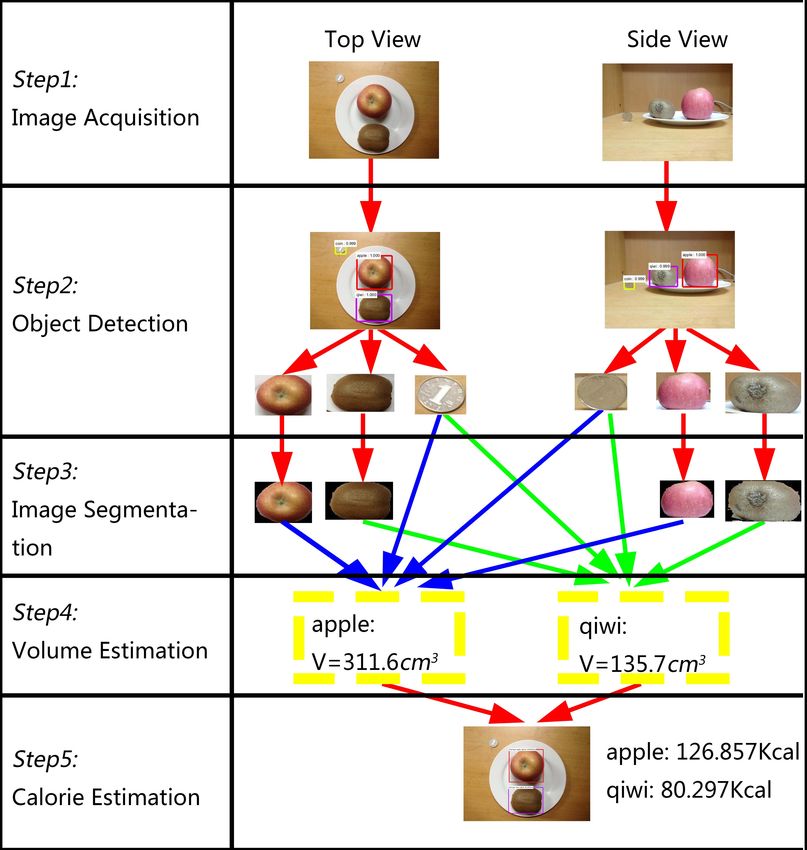
Figure 1 shows the flowchart of the proposed method. Our method includes
5 steps: image acquisition, object detection, image segmentation volume esti-
mation and calorie estimation. To estimate calories, it requires the user to take
a top view and a side view of the food before eating with his/her smart phone.
Each images used to estimate must include a calibration object; in our exper-
iments, we use One Yuan coin as a reference. In order to get better results,
we choose to use Faster Region-based Convolutional Neural Networks (Faster
R-CNN)[10] to detect objects and GrabCut [11] as segmentation algorithms.
2.2. Deep Learning based Objection detection
We do not use semantic segmentation method such as Fully Convolutional
Networks (FCN)[12] but choose to use Faster R-CNN. Faster R-CNN is a frame-
work based on deep convolutional networks. It includes a Region Proposal Net-
work (RPN) and an Object Detection Network[10]. When we put an image
with RGB channels as input, we will get a series of bounding boxes. For each
bounding box created by Faster R-CNN, its class is judged.
After the detection of the top view, we get a series of bounding boxes
box1T ,box2T ,...,boxm i i
T . For ith bounding box boxT , its food type is typeT . Be-
sides these bounding boxes, we regard the bounding box cT which is judged as
the calibration object with the highest score to calculate scale factor of the top
view. In the same way, after the detection of the side view, we get a series of
bounding boxes box1S ,box2S ,...,boxnS . For j th(j ∈1,2,...,n) bounding box boxjS , its
food type is typejS . And we treat the bounding box cS judged as the calibration
object with the highest score to calculate scale factor of the side view.
3Figure 1: Calorie Estimation Flowchart
2.3. Image Segmentation
After detection, we need to segment each bounding box. GrabCut is an im-
age segmentation approach based on optimization by graph cuts[11]. Practicing
GrabCut needs a bounding box as foreground area which can be provided by
Faster R-CNN. Although asking user to label the foreground/background color
can get better result, we refuse it so that our system can finish calorie estima-
tion without users assistance. For each bounding box, we get precise contour
after applying GrabCut algorithm. After segmentation, we get a series of food
4images P1T ,P2T ,...,Pm 1 2 n i
T and PS ,PS ,...,PS . The size of PT is the same as the size of
boxiT (i ∈1,2,...,m), but the values of background pixels are replaced with zeros,
which means that only the foreground pixels are left. The calibration object
boxes cT and cS are not applied by GrabCut. After image segmentation, we
can estimate every food’s volume and calorie.
2.4. Volume Estimation
In order to estimate volume of each food, we need to to calculate scale factors
based on the calibration objects first. When we use the One Yuan coin as the
reference, according to the coin’s real diameter(2.50cm), we can calculate the
side view’s scale factor αS (cm) with Equation 1.
2.5
αS = (1)
(WS + HS )/2
Where WS is the width of the bounding box cS and HS is the height of the
bounding box cS .
Then the top view’s scale factor αT (cm) is calculated with Equation 2.
2.5
αT = (2)
(WT + HT )/2
Where WT is the width of the bounding box cT and HB is the height of the
bounding box cT .
For each food image PiT (i ∈1,2,...,m), we try to find an image in set P1S ,P2S ,...,PnS
with the same food type. If typeiT is equal to typejS (j ∈1,2,...,n), PjS will be
marked so that it won’t be used again; then PiT and PjS will be used to calculate
this food’s volume. We divide foods into three shape types: ellipsoid, column,
irregular. According to the food type typeiT , we select the corresponding volume
estimation formula as shown in Equation 3.
PHS
π k 2 3
β × 4 × k =1 (LS ) × αS if the shape is ellipsoid
v= 2
β × (sT × αT ) × (HS × αS ) if the shape is column
β × (sT × α2 ) × PHS ( MAX LkS
)2 × αS if the shape is irregular
T k =1 LS
(3)
5In Equation 3, HS is the number of rows in side view PS and LkS is the number
of foreground pixels in row k (k ∈ {1 , 2 , ..., HS }). LMAX
S = max(L1S , ..., LH
S )
S
PHT k
records the maximum number of foreground pixels in PS . sT = k =1 LT is
the number of foreground pixels in top view PT , where LkT is the number of
foreground pixels in row k (k ∈ 1 , 2 , ..., HT ). β is the compensation factor and
the default value is 1.0.
2.5. Calorie Estimation
After getting volume of a food, we get down to estimate each food’s mass
first with Equation 4.
m =ρ×v (4)
Where v(cm3 ) is the volume of current food and ρ(g/cm3 ) is its density value.
Finally, each food’s calorie is obtained with Equation 5.
C =c×m (5)
Where m(g) is the mass of current food and c(Kcal/g) is its calories per gram.
3. Results and Discussion
3.1. Dataset Description
For our calorie estimation method, a corresponding image dataset is nec-
essary for evaluation. Several food image datasets[13, 14, 15, 16] have been
created so far. But these food datasets can not meet our requirements, so we
use our own food dataset named ECUSTFD2 .
ECUSTFD contains 19 kinds of food: apple, banana, bread, bun, doughnut,
egg, fired dough nut, grape, lemon, litchi, mango, mooncake, orange, peach, pear,
plum, qiwi, sachima, tomato. For a single food portion, we took some pairs of
images by using smart phones; each pair of images contains a top view and a
side view. For each image, there is only a One Yuan coin as calibration object.
2 http://pan.baidu.com/s/1o8qDnXC
6If there are two food in the same image, the type of one food is different from
another. For every image in ECUSTFD, we provide annotations, volume and
mass records.
3.2. Object Detection Experiment
In this section, we compare the object detection results between Faster R-
CNN and another object detection algorithm named Exemplar SVM(ESVM)
in ECUSTFD. In order to avoid using train images to estimate volumes in
the following experiments, the images of two sets are not selected randomly
but orderly. The numbers of training images and testing images are shown in
Figure 2. And we use Average Precision(AP) to evaluate the object detection
results. In testing set, Faster R-CNN’S mean Average Precision(mAP) is 93.0%
Figure 2: training and testing image numbers
while ESVM’S mAP is only 75.9%, which means that Faster R-CNN is up to
the standard and can be used to detect object.
73.3. Food Calorie Estimation Experiment
In this section, we present our food calorie estimation results. Due to the
limit of experimental equipments, we can not get each food’s calorie as a ref-
erence; so our experiments just verify the volume estimation results and mass
estimation results. First we need to get the compensation factor β in Equation
3 and ρ in Equation 4 for each food type with the training sets. β is calculated
with Equation 6.
PN
Vki
βk = Pi=1
N
(6)
i=1 vki
Where k is the food type, N is the number of volume estimation. Vki is the real
volume of food in the ith volume estimation; and vki is the estimation volume
of food in the ith volume estimation.
ρ is calculated with Equation 7.
PN
Mki
ρk = ( Pi=1
N
) (7)
i
i=1 Vk
Where k is the food type, N is the number of mass estimation. Mki is the real
mass of food and Vki is the real volume of food in the ith mass estimation.
The shape definition, estimation images number, β, ρ of each food type are
shown in Table 1. For example, we use 122 images to calculate parameters for
apple, which means that N = 122/2 = 61 volume estimation results are used to
calculate β.
Then we use the images from the testing set to evaluate the volume and mass
estimation results. The results are shown in Table 2 either. We use mean volume
error to evaluate volume estimation results. Mean volume error is defined as:
Ni
1 X vj − V j
MEVi = (8)
Ni j=1 Vj
In Equation 8, for food type i , 2Ni is the number of images Faster R-CNN
recognizes correctly. Since we use two images to calculate volume, so the number
of estimation volumes for type i is Ni . vj is the estimation volume for the jth
pair of images with the food type i; and Vj is corresponding real volume for the
8Table 1: Shape Definition and Parameters in Our Experiments
Food Type shape estimation image βk ρk
number
apple ellipsoid 122 1.08 0.78
banana irregular 82 0.62 0.91
bread column 26 0.62 0.18
bun irregular 32 1.07 0.38
doughnut irregular 42 1.28 0.30
egg ellipsoid 30 1.01 1.17
fired dough twist irregular 48 1.22 0.60
grape column 24 0.45 1.00
lemon ellipsoid 34 1.06 0.94
litchi irregular 30 0.82 0.98
mango irregular 20 1.16 1.08
mooncake column 64 1.00 1.20
orange ellipsoid 110 1.09 0.88
peach ellipsoid 48 1.05 1.01
pear irregular 72 1.02 0.97
plum ellipsoid 82 1.22 0.97
qiwi ellipsoid 54 1.16 0.98
sachima column 54 1.10 0.22
tomato ellipsoid 46 1.21 0.90
same pair of images. Mean mass error is defined as:
Ni
i 1 X mj − Mj
MEM = (9)
Ni j=1 Mj
In Equation 9, for food type i , the number of mass estimation for ith type is
Ni . mj is the estimation volume for the jth pair of images with the food type
i; and Mj is corresponding real mass for the same pair of images.
Volume and mass estimation results are shown in Table2. For most types of
9Table 2: Volume and Mass Estimation Experiment Results
Food Type estimation mean mean volume mean mean mass
image volumeestimation error mass estimation error
number volume (%) mass (%)
apple 154 333.64 270.66 -11.59 263.82 292.51 -13.14
banana 90 162.00 204.16 -21.42 146.38 127.24 -20.94
bread 20 155.00 180.62 -26.47 29.04 112.04 -29.13
bun 56 245.36 235.39 2.80 77.87 252.11 22.76
doughnut 118 174.75 143.47 5.36 56.26 183.64 -0.74
egg 34 52.94 62.13 17.56 61.64 62.52 17.67
fired dough twist 44 65.00 54.50 4.78 40.80 66.64 -2.53
grape 30 240.00 323.57 -38.86 219.50 146.73 -33.45
lemon 112 96.79 94.03 3.88 94.24 100.11 0.13
litchi 48 43.33 49.25 -6.05 43.80 40.54 -8.88
mango 96 81.67 70.43 4.34 88.11 81.48 -0.07
mooncake 66 67.58 52.52 -16.57 62.13 52.54 2.15
orange 104 234.42 235.93 10.06 216.99 257.83 4.66
peach 62 110.65 115.52 6.46 117.06 121.03 1.62
pear 82 260.00 225.93 -10.05 248.10 229.41 -8.91
plum 94 100.00 98.35 20.22 105.14 120.22 11.35
qiwi 56 127.14 123.08 8.65 127.31 143.33 5.93
sachima 96 147.29 129.05 -3.28 31.89 142.35 -1.48
tomato 90 174.22 168.28 17.11 182.64 203.07 0.36
food in our experiment, the estimation results are closer to reference real values.
The mean error between estimation volume and true volume does not exceed
±20% except banana, bread, grape, plum. For some food types such as lemon,
our estimation result is close enough to the true value. The mass estimation
results are almost the same as the volume estimation results. But for some food
types like mooncake and tomato, the mass estimation errors are less than the
10volume estimation errors; the way we measure volume needs to be blamed due
to drainage method is not accurate enough. All in all, our estimation method
is available.
4. CONCLUSION
In this paper, we provided our calorie estimation method. Our method needs
a top view and side view as its inputs. Faster R-CNN is used to detect the food
and calibration object. GrabCut algorithm is used to get each food’s contour.
Then the volume is estimated with volume estimation formulas. Finally we es-
timate each food’s calorie. The experiment results show our method is effective.
REFERENCE
References
[1] W. Zheng, D. F. Mclerran, B. Rolland, X. Zhang, M. Inoue, K. Matsuo,
J. He, P. C. Gupta, K. Ramadas, S. Tsugane, Association between body-
mass index and risk of death in more than 1 million asians, New England
Journal of Medicine 364 (8) (2011) 719–29.
[2] F. E. Thompson, A. F. Subar, Dietary assessment methodology, Nutrition
in the Prevention and Treatment of Disease 2 (2008) 3–39.
[3] W. Jia, H. C. Chen, Y. Yue, Z. Li, J. Fernstrom, Y. Bai, C. Li, M. Sun,
Accuracy of food portion size estimation from digital pictures acquired by
a chest-worn camera., Public Health Nutrition 17 (8) (2014) 1671–81.
[4] Z. Guodong, Q. Longhua, Z. Qiaoming, Determination of food portion size
by image processing, 2008, pp. 119–128.
[5] Y. Bai, C. Li, Y. Yue, W. Jia, J. Li, Z. H. Mao, M. Sun, Designing a
wearable computer for lifestyle evaluation., in: Bioengineering Conference,
2012, pp. 93–94.
11[6] P. Pouladzadeh, P. Kuhad, S. V. B. Peddi, A. Yassine, S. Shirmohammadi,
Mobile cloud based food calorie measurement (2014) 1–6.
[7] J. A. Suykens, J. Vandewalle, Least squares support vector machine clas-
sifiers, Neural processing letters 9 (3) (1999) 293–300.
[8] G. Villalobos, R. Almaghrabi, P. Pouladzadeh, S. Shirmohammadi, An im-
age procesing approach for calorie intake measurement, in: IEEE Interna-
tional Symposium on Medical Measurements and Applications Proceedings,
2012, pp. 1–5.
[9] FAO/INFOODS, U. R. Charrondire, D. Haytowitz, B. Stadlmayr,
Fao/infoods density database version 1.0.
[10] S. Ren, K. He, R. Girshick, J. Sun, Faster r-cnn: Towards real-time object
detection with region proposal networks, in: Advances in neural informa-
tion processing systems, 2015, pp. 91–99.
[11] C. Rother, V. Kolmogorov, A. Blake, Grabcut: Interactive foreground
extraction using iterated graph cuts, in: ACM transactions on graphics
(TOG), Vol. 23, ACM, 2004, pp. 309–314.
[12] J. Long, E. Shelhamer, T. Darrell, Fully convolutional networks for seman-
tic segmentation, in: Proceedings of the IEEE Conference on Computer
Vision and Pattern Recognition, 2015, pp. 3431–3440.
[13] L. Bossard, M. Guillaumin, L. Van Gool, Food-101–mining discriminative
components with random forests, in: European Conference on Computer
Vision, Springer, 2014, pp. 446–461.
[14] M. Chen, K. Dhingra, W. Wu, L. Yang, R. Sukthankar, J. Yang, Pfid:
Pittsburgh fast-food image dataset, in: IEEE International Conference on
Image Processing, 2009, pp. 289–292.
[15] P. Pouladzadeh, A. Yassine, S. Shirmohammadi, Foodd: An image-based
food detection dataset for calorie measurement, in: International Confer-
ence on Multimedia Assisted Dietary Management, 2015.
12[16] Y. Kawano, K. Yanai, Automatic expansion of a food image dataset lever-
aging existing categories with domain adaptation, in: Proc. of ECCV Work-
shop on Transferring and Adapting Source Knowledge in Computer Vision
(TASK-CV), 2014.
13You can also read