Crop and Rangeland monitoring in Angola (Huambo, Huila, Benguela, Cuanza Sul, Namibe and Cunene)
←
→
Page content transcription
If your browser does not render page correctly, please read the page content below
Agrometeorological Bulletin No. 4
Period October 2020 – April 2021
[English version]
Crop and Rangeland monitoring in Angola
(Huambo, Huila, Benguela, Cuanza Sul, Namibe and Cunene)
Highlights
● The worst drought in 30 years affected the 2020/2021 agricultural season in the
southwestern part of the country.
● Harvest of cereals will be completed in June and production prospects are very poor
in the affected provinces.
● Low pasture production is expected in Namibe and Cunene, two provinces already
stricken by drought also in the 2018/2019 agricultural season.
Overview
The six provinces of Huambo, Huila,
Benguela, Cuanza Sul, Namibe, and
Cunene, located in the central and
southern part of the country, experienced
a poor agricultural season in 2020/2021
due to the worst drought in 30 years that
affected these provinces. Although rainfall
started on time in most parts of the
country, the dry conditions from
December 2020 to February 2021
significantly impacted vegetation growth
at a critical period for crop development.
The rainfall graph with data from the meteorological
station in Huambo (note: missing data in March),
clearly highlights the good initial rainfall conditions,
and the long dry spell that followed.
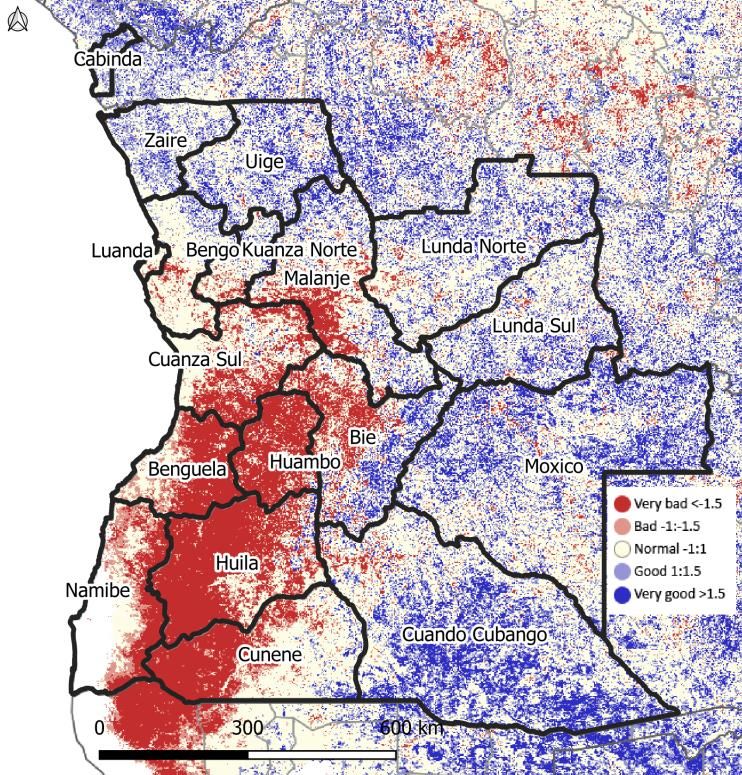
The map of the z-score of cumulative NDVI, an
indicator of vegetation biomass level, indicates in red
areas with very poor vegetation conditions at the
end of April 2021. Harvest of cereal crops will be
completed in June in the country and weather
conditions during the season as well as satellite
images of vegetation status suggest poor cereal and
pasture production prospects in the affected
provinces due to one of the worst droughts of the
last 30 years.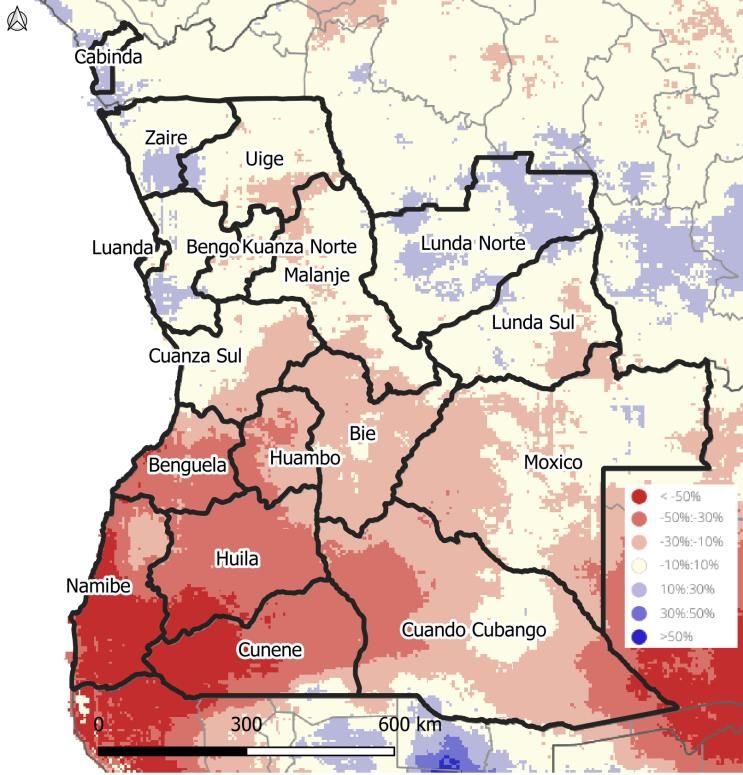
Table of Content
     Highlights                                                                                           1
     Overview                                                                                             1
     National overview of agricultural conditions                                                         2
     Characterization of provinces                                                                        4
     Analysis of ASAP Warnings                                                                            8
     Rainfall Data and Meteo-Based Indicators                                                            10
     Vegetation conditions since the start of the agricultural season                                    17
     High-Resolution satellite imagery                                                                   20
     Technical and organizational Notes                                                                  23
     ANNEX                                                                                               23
       Cumulative rainfall for all cropland for the years 1991-2021                                      23
       SPI-3 months for all cropland for the years 2001-2021                                             25
       Water Satisfaction Index (WSI) for active cropland for the years 2001-2021                        28
       NDVI for all cropland for the years 2001-2021                                                     30

National overview of agricultural conditions
The agricultural season started with average rainfall conditions across the northern and central parts of
the country in October and November. Particularly, Huambo, Benguela, and Cuanza Sul received close to
average cumulative rainfall for this period. On the contrary, Huila, Cunene, and Namibe received ca.60%,
40%, and 70% of the average rainfall, respectively, for the October-November period.
Significant rainfall deficits started in December over the main cereal-producing regions of Huambo, Huila,
and Benguela (received ca. 25%-45% of average rainfall in December) and persisted also in the months of
February-April (Figure 1). Similarly affected by poor rainfall conditions were the southern provinces of
Cunene and Namibe. Actually, the 2020-2021 season for most southern parts of the country was the driest
in the last 30 years for all indicators (NDVI, SPI-3 months, WSI) for January/February (cf. Annex). Rainfall
came back in March in most provinces; however, this was too late for crops to recover from the drought
conditions.
Vegetation conditions, at the end of the main agricultural season in April, are poor for most of Huambo,
Huila, Benguela, eastern Namibe, and western Cunene. Cuanza Sul is less impacted compared to the other
provinces, while in the northern and eastern provinces vegetation conditions are favourable. The poor
biomass conditions point to poor cereal output in the affected provinces.
Additionally, the impact of drought on pastures and water availability for livestock is worrying for Namibe
and Cunene, two provinces stricken by drought for the second time (after 2018-2019) in the last 3 seasons.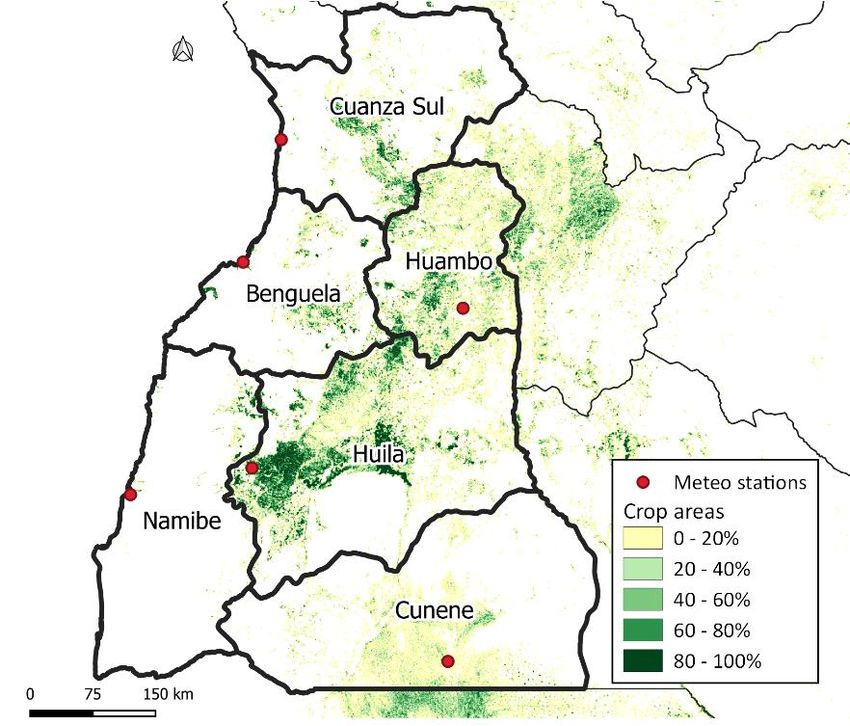
Figure 1. Cumulative rainfall anomaly for February/March/April in %, showing significant seasonal rainfall deficits
for most of the country. (source: EC-JRC ASAP Warning Explorer).

Figure 2. Standardized anomalies in cumulative NDVI from the start of the growing season until the end of April
2021 (source: EC-JRC ASAP Warning Explorer).
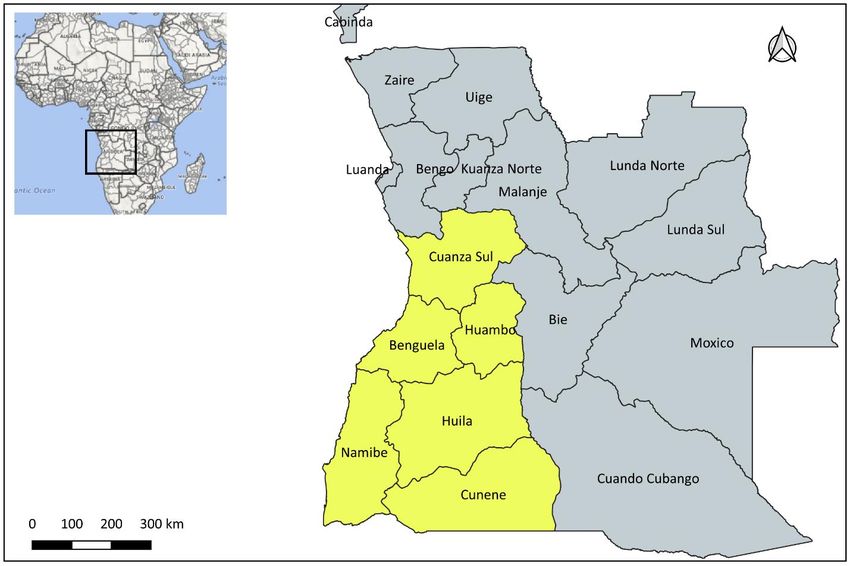
Characterization of provinces
The six provinces are located in the southwestern part of the country as shown in Figure 3.

Figure 3. Map of Angola with the six provinces highlighted in yellow

Namibe and Cunene are dominated by rangelands, with marginal cropping areas in the northeastern and
southern parts of the two provinces respectively (Figure 4). In terms of extent, the rangeland area in
Namibe is estimated at 27,000 km2 (ca. 45% of the total area of the province) and in Cunene at 32,000
km2 (ca. 40% of the total area of the province). Similarly, in Benguela rangelands are also covering a large
part of the province (ca. 20% of the total area of the province).

Huila and Huambo have a significantly larger cropping area compared to the other provinces (Figure 4),
estimated at ca. 14,000 km2 and at ca. 5,700 km2, respectively, covering almost 20% of the total area of
each province. The provinces of Benguela and Cuanza Sul are following in terms of extent of cropland
area, with ca. 2,100 km2 and 3,400 km2 of croplands.
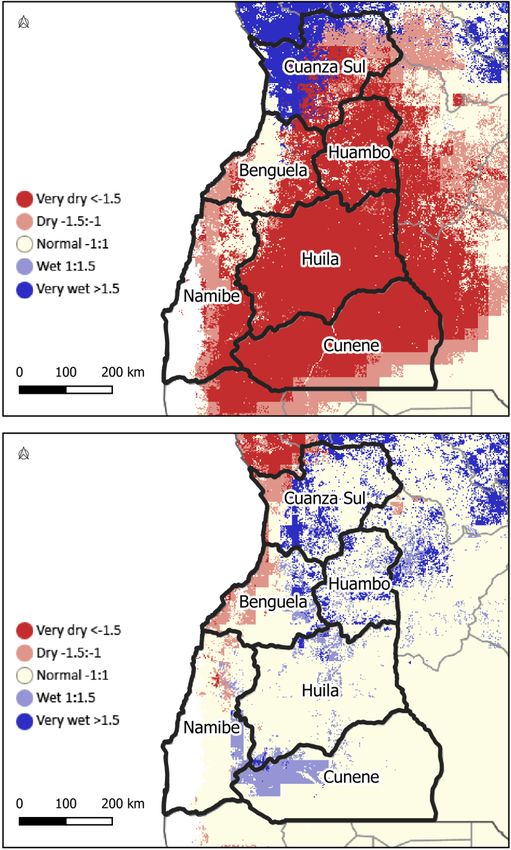
Figure 4. Crop (top) and rangeland (bottom) maps for Angola (source: EC-JRC ASAP Warning Explorer).
Angola has a main cereal cropping season, spanning from October/November to April/May which applies
also to the southwestern provinces. The planting, growing, and harvesting dates can be seen in Figure 5.

Figure 5. Crop calendar presenting the starting dates for sowing, growing, and harvest for major crops in Angola
(source: FAO/GIEWS).

According to information from the Ministry of Agriculture, Huila, Huambo, Benguela, and Cuanza Sul are
important provinces in terms of cereal production (Figure 6). Among the six provinces, Huambo has the
largest contribution to national maize production with nearly 30% (Figure 7). Huila and Cuanza Sul follow
with close to 15% contribution, each.

As shown in Figure 7, Cunene provides a significant contribution to the national sorghum and millet
production (15% and 32% of the national production respectively). Namibe’s contribution to national
production is limited (maximum 5% for sorghum), however, these marginal cropping areas are important
for food security at the provincial level. Moreover, both Namibe and Cunene are important provinces in
terms of rangeland and livestock production.
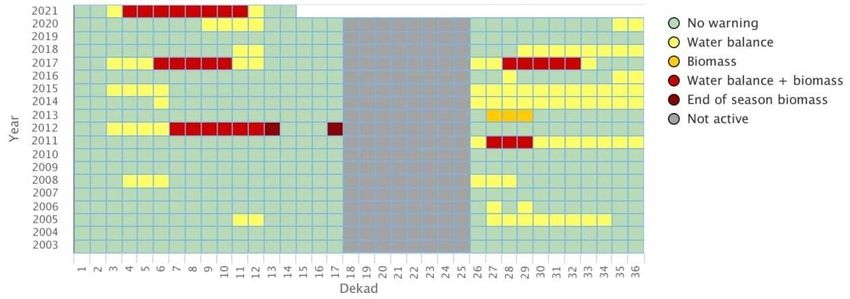
Figure 6. Average production for cereals for all provinces in Angola (source of data: GEPE/MINAGRI accessed
through CountryStat).

                             35
  % of national production

                             30
                             25
                             20
                             15
                             10
                              5
                              0
                                  maize    millet   sorghum   rice   cassava   potato    sweet    dry bean   peanut
                                                                                         potato

                                   Huila    Huambo        Benguela    Cuanza Sul        Cunene     Namibe
Figure 7. Contribution to the national production for various crops for the six provinces. (Average data for 2001-
2014, source of data: GEPE/MINAGRI accessed through CountryStat).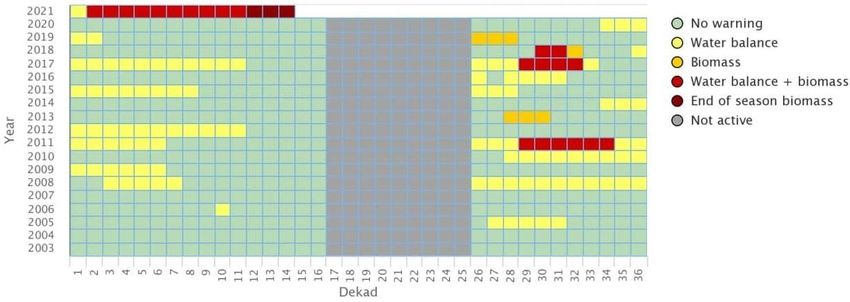
Analysis of ASAP Warnings
Figures 8a to 8f depict the ASAP warnings for crops in Huila, Huambo, Benguela, and Cuanza Sul and for
rangelands in Cunene and Namibe. The matrices show the warning history for the years 2003-2021 (up to
mid-May 2021).

 INFO BOX 1 - ASAP WARNINGS

 The ASAP warnings for a given province and production type (crop or rangeland) are automatically
 assigned by the system for each dekad of the season. A warning of level 1 (in yellow) refers to rainfall
 deficit that may evolve into poor vegetation growth, warning of level 2 (orange) points to poor
 vegetation growth (i.e. biomass deficit), whereas warning of level 3 (red) indicates a combination of
 rainfall and biomass deficits. Finally, warning of level 4 i.e. biomass deficit at the end of the season
 (dark red) suggests a failed season.

Huambo, Cuanza Sul, and Benguela started experiencing a rainfall deficit in December 2020 (dekads 34-
36 - see Figures 8b-8d). This deficit translated into biomass deficit in January and beginning of February
(dekak 2 for Benguela and Huambo, dekad 5 for Cuanza Sul - see Figures 8b-8c) and these adverse
conditions persisted in the provinces until the end of the agricultural season, resulting in a failed crop
season in Huambo and Benguela. In Huila province, the rainfall deficit started even earlier in November
(dekads 31- see Figure 8a) and quickly translated into biomass deficit at the end of November 2020. The
poor rainfall and biomass conditions persisted until the end of the agricultural season and resulted in a
failed cropping season.
Rangelands in Cunene and Namibe experienced a rainfall deficit early in the season (in November 2021)
that persisted throughout the agricultural season and resulted in a failed pastoral season. This situation
is of particular concern for the two provinces, where rangelands experience the 2nd important drought in
the last 3 years.

Figure 8a. Time series of ASAP warnings for croplands in Huila (source: EC-JRC ASAP Warning Explorer).
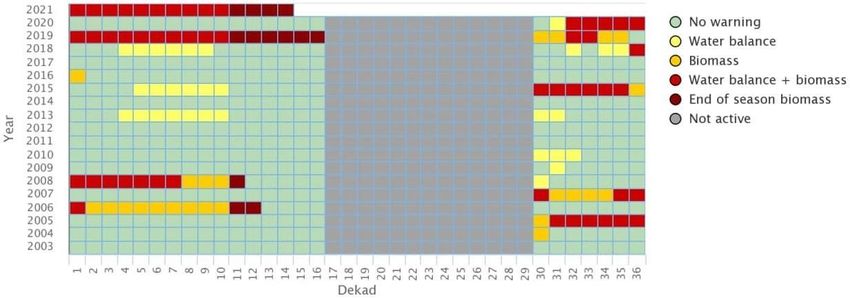
Figure 8b. Time series of ASAP warnings for croplands in Huambo (source: EC-JRC ASAP Warning Explorer).

Figure 8c. Time series of ASAP warnings for croplands in Benguela (source: EC-JRC ASAP Warning Explorer).

Figure 8d. Time series of ASAP warnings for croplands in Cuanza Sul (source: EC-JRC ASAP Warning Explorer).
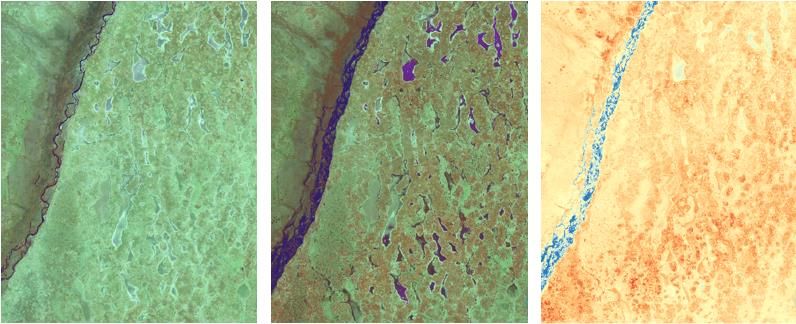
Figure 8e. Time series of ASAP warnings for rangelands in Cunene (source: EC-JRC ASAP Warning Explorer).

    Figure 8f. Time series of ASAP warnings for rangelands in Namibe (source: EC-JRC ASAP Warning Explorer).

Rainfall Data and Meteo-Based Indicators
Rainfall is a key indicator to monitor rainfed agriculture as it is one of the main limiting factors for plant
growth in these provinces. In this section, we present maps and graphs of a set of rainfall-derived
indicators (based on rainfall estimates derived from a combination of satellite and station data) to assess
the potential effects of rainfall on agriculture in the region during the last agricultural season (October
2020 - April 2021).

Figures 9a to 9f depict the rainfall received per dekad (10-day period) on the cropland area of each
province, the corresponding historical average rainfall, as well as the cumulative rainfall for 2020/2021,
and the cumulative historical average rainfall.

For Huila, Cunene, and Namibe the rainy season started in October 2020 - November 2020, with below-
average rainfall amounts (received 60%, 40%, and 70% of the average cumulative rainfall respectively).
For Huambo, Benguela, and Cuanza Sul, rainfall in October 2020 - November 2020, was close to average.
However, all provinces experienced a serious dry spell between December 2020 to February 2021, with
the cumulative amounts for this period being 15-50% of the average. This prolonged dry spell had a
negative impact on crop growth as this is a critical period for crop development.

The cumulative rainfall from the start of the rainy season until the beginning of May is ca. 50%-60% of the
average for Huila, Huambo, Benguela, and Namibe. By contrast, conditions at the end of the season are
closer to the average for Cuanza Sul, with cumulative rainfall ca. 16% below-average in early May thanks to good rainfall amounts in the beginning (October/November) and at the end of the season (March/April). Figure 9a. Ten-day and cumulative rainfall amounts for Huila based on CHIRPS rainfall estimate extracted for cropland areas (source: EC-JRC ASAP Warning Explorer). Figure 9b. Ten-day and cumulative rainfall amounts for Namibe based on CHIRPS rainfall estimate extracted for cropland areas (source: EC-JRC ASAP Warning Explorer). Figure 9c. Ten-day and cumulative rainfall amounts for Cunene based on CHIRPS rainfall estimate extracted for cropland areas (source: EC-JRC ASAP Warning Explorer).
Figure 9d. Ten-day and cumulative rainfall amounts for Huambo based on CHIRPS rainfall estimate extracted for
cropland areas (source: EC-JRC ASAP Warning Explorer).

Figure 9e. Ten-day and cumulative rainfall amounts for Benguela based on CHIRPS rainfall estimate extracted for
cropland areas (source: EC-JRC ASAP Warning Explorer).

Figure 9f. Ten-day and cumulative rainfall amounts for Cuanza Sul based on CHIRPS rainfall estimate extracted for
cropland areas (source: EC-JRC ASAP Warning Explorer).

The monthly cumulative rainfall recorded in the weather stations located in the provinces of interest (see
map of Figure 11) is consistent with the rainfall estimates graphs (Figures 10a-10c). Namibe and Cuanza
Sul stations were removed from the analysis, since the stations are located on the coast (Figure 11),
outside the cropland area of the province, and in a different environment. In contrast, for Huambo and
Huila, whose airport stations are located in the cropland areas, the monthly cumulative rainfall recorded
in the weather stations is consistent with the rainfall estimates graphs. The Benguela station has no data
yet as this is a new meteo station. For the Cunene meteo station, data for comparison is only available for
years 2018-20.

Figure 10a. Monthly cumulative rainfall of the weather station located in Huambo (note: missing data in March,
source: INAMET).

Figure 10b. Monthly cumulative rainfall of the weather station located in Huila (note: missing data in February,
March, April, source: INAMET).
Figure 10c. Monthly cumulative rainfall of the weather station located in Cunene (source: INAMET).

Figure 11. Locations of the weather stations in the six provinces, indicated by red circles (source of crop areas: EC-
JRC ASAP Download).

The Standardized Precipitation Index (SPI) (Figure 12), here derived from CHIRPS rainfall data, shows
persisting drought conditions for Huambo, Benguela, Huila, Namibe, and Cunene for the 3-month period
of February 2021 - April 2021. Actually, SPI3 reaches the value of -2 (or lower), which corresponds to the
2.5% driest years, and in fact 2020-21 is the worst season of the 30 years record for Huila, Namibe and
Benguela; in Cunene 2018-19 and 2012-13 were similar to 2020-21 in terms of SPI3 value and in Cuanza
Sul and Huambo 2016-17 and 2014-15 were equivalent to 2020-21 in intensity but at slightly different
periods in the season (see Annex). Only in Cuanza Sul conditions are close to average at the end of May
for the 3-month period thanks to the good rainfall in March and April in the province. In Huambo, Huila,
and Cunene the rainfall deficit (with respect to average rainfall) in the current agricultural season
contrasts with the “average to good” conditions of the previous agricultural season.
INFO BOX 3 - STANDARDIZED PRECIPITATION INDEX

 The Standardized Precipitation Index (SPI) is an index widely used to characterize meteorological
 drought at a range of timescales (1, 3, 6 months…). It is a way to transform precipitation data into a
 normal distribution, which allows interpreting a rainfall anomaly over a given timescale - anomaly
 expressed as an SPI value - as the number of standard deviations by which this rainfall anomaly
 deviates from the long-term mean. This way, we can derive the probability of occurrence of this
 anomaly and know if a given rainfall, deficit, or excess is rare or exceptional for a given location.

Figure 12. Spatial distribution of the Standardized Precipitation Index – 3 months (SPI3) for the current agricultural
season (February - April 2021 on the top) and for the previous one (February - April 2020 on the bottom) (source:
EC-JRC ASAP Warning Explorer).
Figure 13 illustrates the spatial distribution of the water available to plants during the growing season
based on the ASAP Water Satisfaction Index (WSI) at the end of April. Red areas represent negative
anomalies, whereas blue areas represent positive anomalies (i.e. the difference between the current year
and the average of the last 30 years, expressed as a number of standard deviations of WSI for the current
dekad).

 INFO BOX 2 - WATER SATISFACTION INDEX

 The Water Satisfaction Index (WSI) is an indicator of crop (or rangeland) performances based on the
 availability of water to the crop during the growing season. It is based on a water balance to compute
 the actual evapotranspiration of the crop (i.e. the water available to the plant) and compare it to the
 potential evapotranspiration of the crop (i.e. the crop water requirement). WSI varies from 0 (no
 water for the plant) to 100 (full satisfaction of the water requirement).
 See more in ASAP WSI documentation.

At the end of April, the dominant red pattern in Huambo, Huila, Cunene, Namibe, and the eastern part of
Benguela, indicates that crops and rangelands have not received sufficient rainfall to fulfill their water
requirements, in contrast with the previous season (2019/2020), where positive anomalies or normal
conditions (white color) indicated above-average or average water availability, respectively. Only in
western parts of Cuanza Sul, crops received adequate water.

The zWSI values are below -1.5 indicating that the 2020-21 season is among the 7% poorest years in terms
of WSI. In fact, the WSI graphs in Annex confirm that this season is by far the driest of the last 20 years
(actually 30 years), except in Cunene and Cuanza Sul where 2018-19 and 2016-17 were worse than the
current season as from March.
Figure 13. Spatial distribution of anomalies in the Water Satisfaction Index for crops from the start of the growing
season until the end of April 2021 (top) and for the same period in 2019/20 (bottom) (source: EC-JRC ASAP Warning
Explorer). The value represented on the map is the number of standard deviations by which the WSI is above or
below its mean value. For example, a score of -1.5 means that the current WSI minus the mean WSI (for the dekad
considered, here end of April) is equal to -1.5 times the standard deviation of WSI, and this score has a probability
of 6.7% to occur (i.e. it normally occurs once every 15 years).

Vegetation conditions since the start of the agricultural season
Figure 14 shows the spatial distribution of standardized anomalies in cumulative NDVI (Normalized
Difference Vegetation Index) from the start of the growing season until the end of April. These anomalies
indicate how many standard deviations the cumulative NDVI departs from its mean value calculated over
the same period (start of the season till the end of April) using all available years. The red pattern indicates
poor vegetation conditions in all five provinces except for Cuanza Sul.
INFO BOX 4 - NORMALISED DIFFERENCE VEGETATION INDEX

  The NDVI (Normalised Difference Vegetation Index) is largely used as a green biomass indicator. It is a
  combination of the red and near-infrared bands registered by satellites and is used either at a specific
  date or cumulated over the whole season.

Figure 14. Standardized anomalies in cumulative NDVI at the end of April 2021 (source: EC-JRC ASAP Warning
Explorer).
Figures 15a-15f show the temporal evolution of cropland NDVI for the provinces of interest. The charts
show how cropland NDVI has evolved from the start of the season in October 2020 (dekad 28) until mid-
May (dekad 14) as compared to the historical average and the past season.

In Huila, Benguela, Huambo, Cunene, and Namibe, biomass at the start of the season was close to average,
however poor rains since November (since December in Huambo) affected crop growth, resulting in well
below-average crop biomass as from December-early January (Figures 15a-15d). In all provinces, there
was a recovery in biomass levels after the heavy rainfall of the last two dekads of March (dekads 8-9),
however, this rainfall came too late for crop recovery. As a result, crop failure and reduced rangeland
production are expected in the affected provinces.

In Cuanza Sul, biomass conditions were average for the first part of the agricultural season (October-
December 2020), however, a significant dry spell between January and the first dekad of February (ca.
85% below-average cumulative rainfall for this period), had a negative impact on biomass level, evident
in January and February (Figure 15f). With the improvement of rainfall since the beginning of March, there
was a green-up and vegetation conditions are average at mid-May.
Figure 15a. NDVI time series profile for crops in Huila (source: EC-JRC ASAP Warning Explorer).

Figure 15b. NDVI time series profile for crops in Namibe (source: EC-JRC ASAP Warning Explorer).

Figure 15c. NDVI time series profile for crops in Benguela (source: EC-JRC ASAP Warning Explorer).
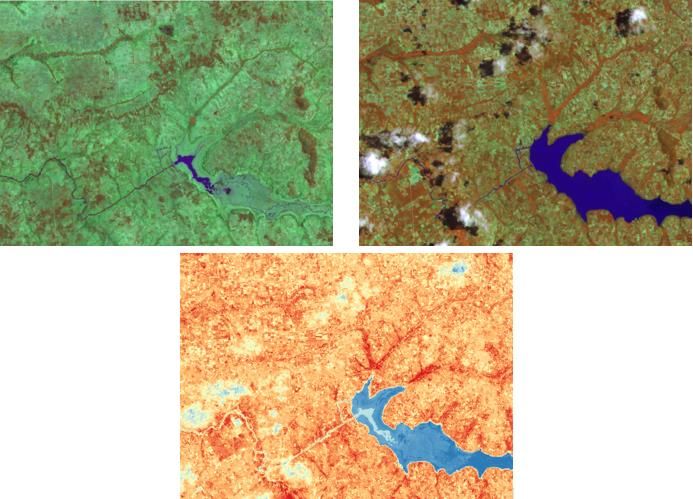
Figure 15d. NDVI time series profile for crops in Huambo (source: EC-JRC ASAP Warning Explorer).

Figure 15e. NDVI time series profile for crops in Cunene (source: EC-JRC ASAP Warning Explorer).

Figure 15f. NDVI time series profile for crops in Cuanza Sul (source: EC-JRC ASAP Warning Explorer).

High-Resolution satellite imagery
Sentinel 2 false-color composites in Figures 16, 17, and 18 show crop and rangeland areas, in Benguela,
Cunene, and Huila provinces, for the period 01-31 March 2021, for the same period in 2020 and their NDVI
differences. It is clear from the satellite images that in 2021 there is more bare soil or dry vegetation
(greenish color) prevailing due to the drought affecting the three provinces, in contrast with healthy
vegetation (red color) in the same period last year. Red fields in the NDVI difference image indicate crop
fields that have lower NDVI values in 2021 compared to 2020. In general, in all the NDVI difference images,
red color prevails, meaning that in the 2021 season, most fields are in worse conditions than in 2020. In
Figures 16 and 17, it is also evident that water bodies have decreased in size compared to last year (an
exceptionally wet year in Huila, a good year in Benguela, and an average year in Cunene).

  INFO BOX 5 - SENTINEL

  Sentinel is an Earth observation mission from the European Space Agency’s Copernicus Program that
  provides accurate, timely, and easily accessible information to improve the management of the
  environment, understand and mitigate the effects of climate change and ensure civil security (ESA).
  Sentinel 2 acquires optical imagery at high spatial resolution (10 m to 60 m) over land and coastal
  waters. Sentinel’s data are available to the public at no cost.

Figure 16. Sentinel 2 false-color composite images for the period 01-31 March for Benguela province (area
northwest of Chiqueque) in 2021 (top left) as compared to 2020 (top right). The NDVI difference between 2021 and
2020 (bottom) clearly shows poorer vegetation conditions in 2021. Note also that the Cubal Da Hanha stream (dark
blue color on the bottom right image) has decreased significantly in size between March 2020 and March 2021
(greenish color on the bottom right image). (source: EC-JRC ASAP High-Resolution Viewer). Since the water surface
extent has strongly decreased in 2021 with respect to 2020 (which was a wet year), the NDVI difference map shows
higher NDVI values in 2021 (blue color) due to the higher NDVI of bare soil or dry vegetation compared to water.
Figure 17. Sentinel 2 false-color composite images for the period 01-31 March for Cunene province (area northeast
of Calueque) in 2021 (left) as compared to 2020 (middle). Note that the 2020 image has green vegetation (red
color) while in the 2021 image there is only bare soil or dry vegetation (greenish color). The NDVI difference
between 2021 and 2020 (right) shows poorer vegetation conditions in 2021 with respect to 2020 with higher
differences in red. Since Cunene river’s water surface extent has strongly decreased in 2021 with respect to 2020
(which was an average year), the NDVI difference map shows higher NDVI values in 2021 (blue color) due to the
higher NDVI of bare soil or dry vegetation compared to water (source: EC-JRC ASAP High-Resolution Viewer).

Figure 18. Sentinel 2 false-color composite images for the period 01-31 March for Huila province (area eastern of
Lubango) in 2021 (top left) as compared to 2020 (top right). Note that the 2020 image has green vegetation (red
color) while in the 2021 image all fields appear as bare soil or dry vegetation (greenish color). The NDVI difference
between 2021 and 2020 (bottom) shows poorer vegetation conditions in 2021 with respect to 2020 with higher
differences in red (source: EC-JRC ASAP High-Resolution Viewer).

Technical and organizational Notes
The objective of this bulletin is to provide an overview of the agricultural season for the six provinces of
Huila, Huambo, Benguela, Cuanza Sul, Cunene, and Namibe from the start of the season in October 2020
until the end of the season in May 2021. These provinces are either important cereal producers (Huambo,
Huila, Benguela, Cuanza Sul) or highly vulnerable to drought (Cunene, Namibe), making agricultural
monitoring based on agrometeorological and Earth Observation data a relevant contribution to food
security early warning.

The bulletin includes a detailed analysis of the rainfall estimates (CHIRPS) patterns in connection with
available weather station data and the development of cropland and rangelands. We suggest combining
this kind of analysis with information available from other sources, in particular local information
feedback.

This fourth INAMET bulletin is part of the ongoing Collaborative Research Agreement between INAMET
and the Joint Research Centre of the European Commission in Ispra, Italy.

For comments and questions please contact INAMET: donascy@yahoo.com.br or the ASAP team of the
Joint Research Centre of the European Commission: jrc-asap@ec.europa.eu.

ANNEX
In this annex, the graphs for cumulative CHIRPS rainfall, SPI-3, the Water Satisfaction Index (WSI), and
NDVI for cropland are presented for the six provinces (graphs are similar for rangelands). The values of
the indicators have been plotted for the years 1991-92 to 2020-21 for the cumulative rainfall and the years
2001-2002 to 2020-2021 for SPI-3, WSI, and NDVI. The short-term average (STA) and long-term average
(LTA) are computed over 2016-2020, and 1991-2020 respectively, except for NDVI LTA which is based on
years 2002-2020. STA and LTA are both important to help evaluate if conditions are going towards more
frequent dry (or wet) years.

Cumulative rainfall for all cropland for the years 1991-2021
At the end of the agricultural season in May 2021, the cumulative rainfall for Huila and Namibe is at a
record low level, whereas last season was at a record high level. For Cuanza Sul, at mid-May cumulative
rainfall is close to the short-term average (STA), whereas, for Huambo, Cunene, and Benguela, cumulative
rainfall is well below the long-term average (LTA) and the STA.
SPI-3 months for all cropland for the years 2001-2021
Compared to all years since 2001, rainfall was above-average in Benguela and Cuanza Sul at the start of
the season in 2020 (close to 1, or even higher for Cuanza Sul), however after the end of October in
Benguela and after December for Cuanza Sul, SPI3 reached minimum values (-2 or below) in
January/February 2021.

For the other four provinces, from October/November 2020, SPI3 values were below zero, reaching
quickly minimum in December, with values below -2 characterizing an exceptional drought (drought
conditions occurring with a frequency below 2.5% i.e. less than once in 40 years).
Water Satisfaction Index (WSI) for active cropland for the years 2001-2021
WSI shows the exceptionally poor conditions in all provinces that started in January 2021 (even earlier in
Cunene, Huila, and Namibe) and persisted until the end of the season. Only in Cuanza Sul, there was a
recovery and values were close to average at mid-May.
NDVI for all cropland for the years 2001-2021
The lowest NDVI values by far in the last 20 years were reached in January 2021 in Benguela, Cuanza Sul,
Huambo, Huila, and Namibe. In Cunene, vegetation conditions are below the LTA for the period between
December to mid-March, but good rains in March resulted in improved biomass with NDVI close to the
LTA from April until the end of the season. Similarly in the rest of the provinces, after the beginning of
April, vegetation conditions improved due to the greening of mainly natural vegetation after the March
rainfall.
You can also read