Water Monitoring v2.0 Innovations through Local Involvement & Remote Sensing - hydrosolutions
←
→
Page content transcription
If your browser does not render page correctly, please read the page content below
Water Monitoring v2.0
         Innovations through
Local Involvement & Remote Sensing
      Dr. Tobias Siegfried, Dr. Silvan Ragettli & Tabea Donauer
                             02/07/2020

                        hydrosolutions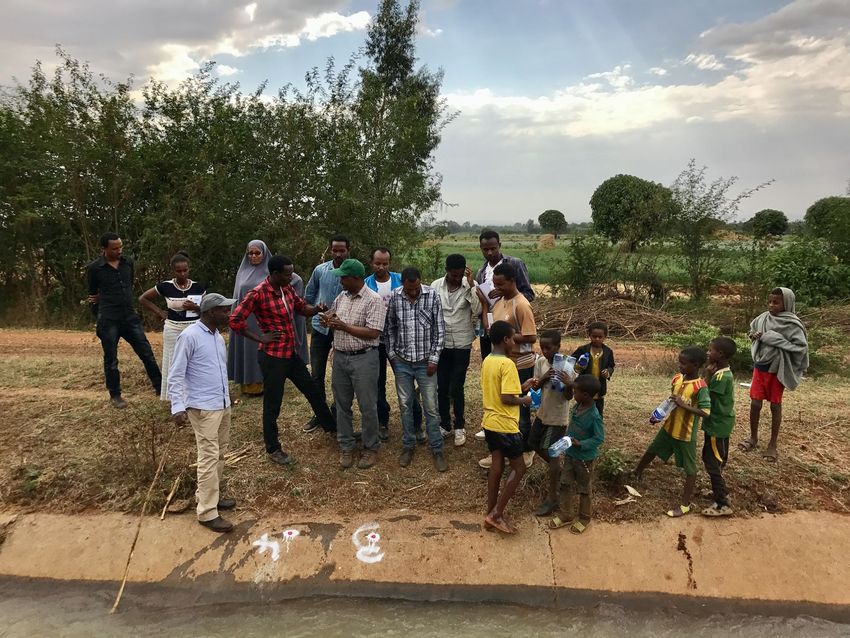
Overview

• Innovative Complementary Monitoring
    • Monitoring through local involvement
    • Remote Sensing
• Water Balance Applications
   • Changes in Water Storage
   • Water Accounting
• Operationalization & Private Sector Dev.
• Challenges & Risks
• Conclusions
Integral Monitoring

                 IN-SITU STATIONS          PEOPLE’S       REMOTE SENSING
                                         INVOLVEMENT

hydrosolutions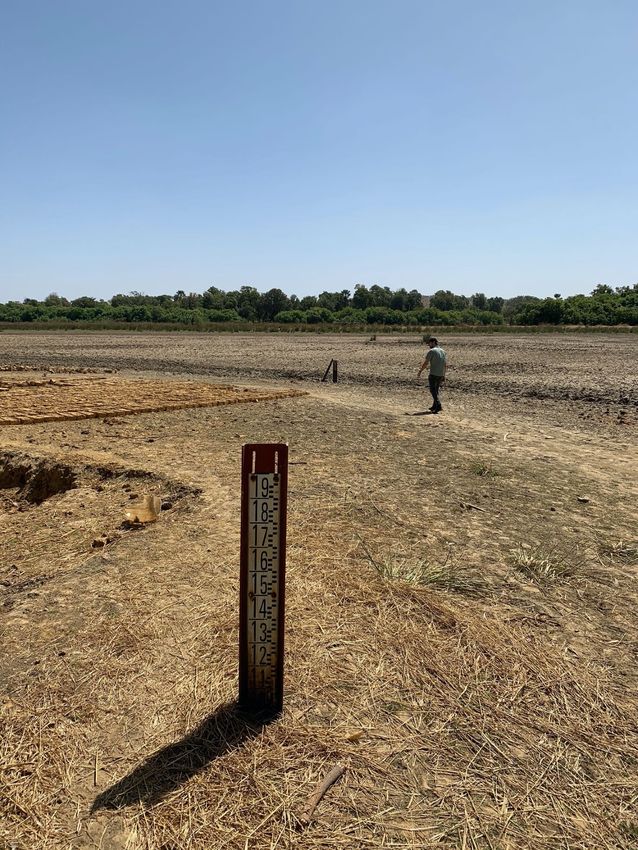
In-Situ Stations

                 • Normally, expensive acquisition.
                 • Operation & maintenance challenges
                 • Vandalism

hydrosolutions
iMoMo
             • Global initiative
             • Incubated by the Swiss Agency for
               Development and Cooperation (SDC).
             • Supported by the World Meteorological
               Organization (WMO).
             • Successful applications in Ethiopia,
               Kenya, Tanzania, Uganda, Mali,
               Mozambique, Kyrgyzstan, Uzbekistan,
               China, etc.

hydrosolutions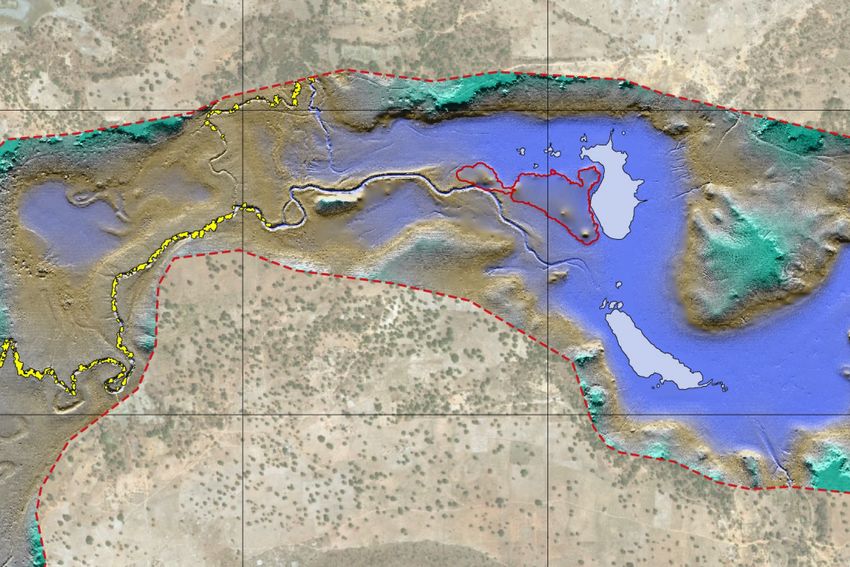
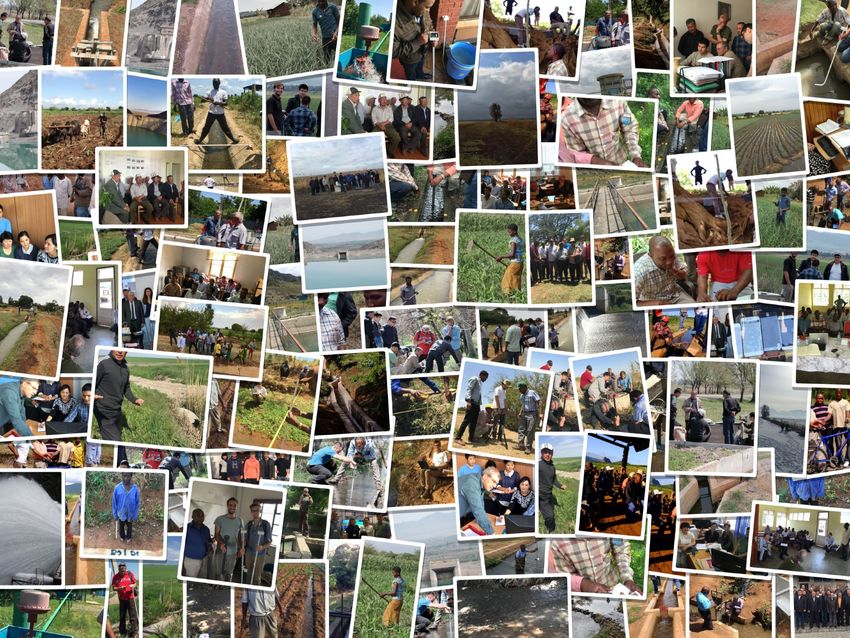
People’s
                 Involvement

                 • Monitoring conducted, in whole or in
                   part, by amateurs and/or non-
                   professionals.
                 • Data is acquired through local
                   involvement, rather than through
                   automatic sensors.

                 • Example: iMoMo Mozambique

hydrosolutions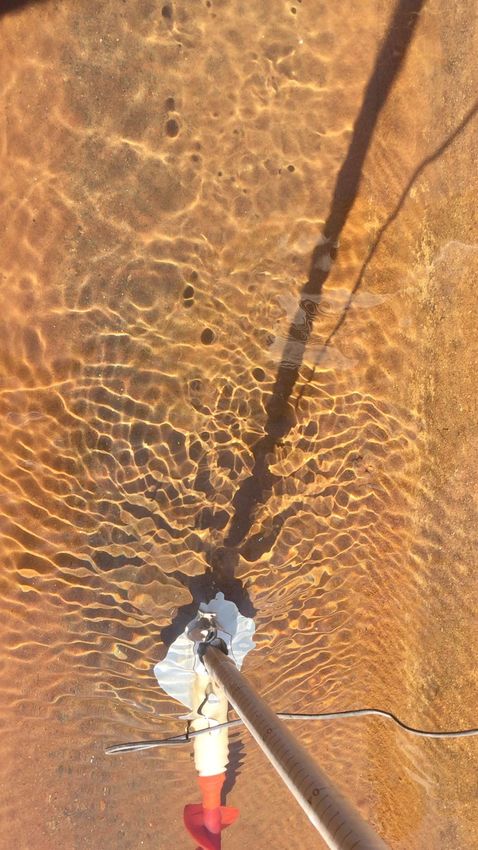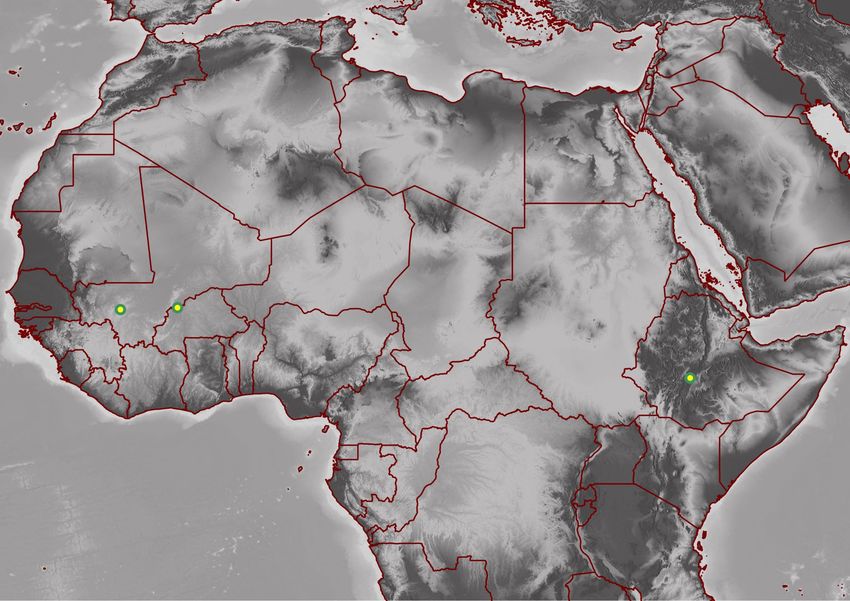
People’s
                 Involvement

                 • Example: iMoMo Mozambique
                  Emilio measuring water depth with a
                  simple ruler.

hydrosolutions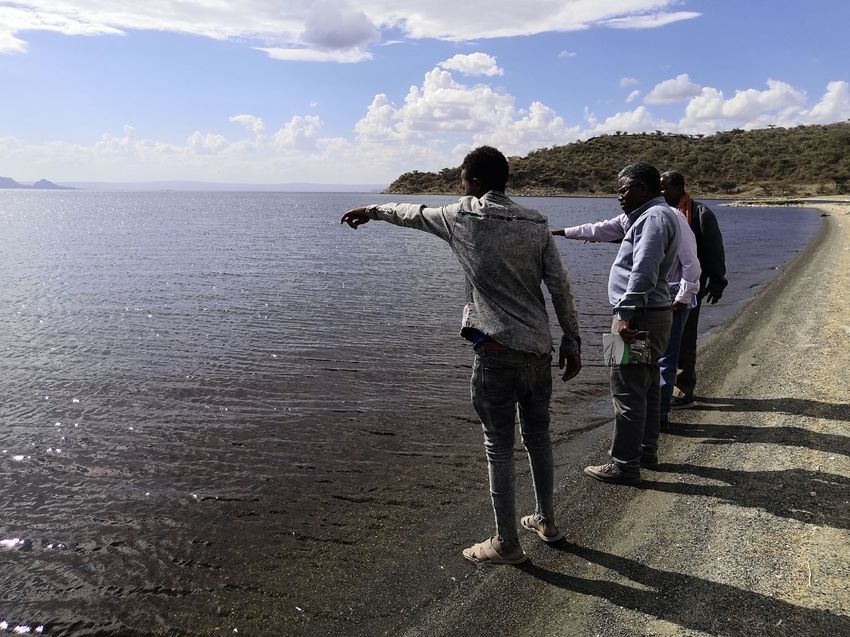
People’s
                 Involvement

                 • Example: iMoMo Mozambique
                  José writing the measurements in a
                  notebook. The notebook was regularly
                  photographed by an extension officer
                  who typed it into Excel, carried out quality
                  control and then shared it with
                  responsible persons.

hydrosolutions
100                                                  0

                 People’s                                                 90

                 Involvement
                                                                                                                              50
                                                                          80

                                                                          70

                                                                                  Campo4                                      100
                                                                                  Nhamandembe
                                                                                  Nhaumbwe2Gauge

                                                                                                                                    Precipitation [mm/week]
                                                                          60      Precipitation

                                                               Q [l/s]
                                                                          50                                                  150

                 • Example: iMoMo Mozambique
                  Resulting 5-year timeseries enabled to
                                                                          40

                  measure water productivity at field scales                                                                  200

                  and to help local farmers to improve
                                                                          30

                  water use efficiency.                                   20
                                                                                                                              250

                                                                          10

                                                                           0                                                  300
                                                                          Jan15           Jan16    Jan17   Jan18   Jan19   Jan20

hydrosolutions
People’s
Involvement
• The same workflow applies to
other low-cost sensors.
hydrosolutionsdischarge.ch
Measuring water level and discharge in a canal with your smartphone.
hydrosolutionsChallenges & Risks
• Monitoring through local involvement
• No free lunch
• Careful co-design of monitoring
protocols with locals required
• Data quality control and assurance
of utmost importance
• Establishment of a clear
communication chain
• Cross-agency collaboration can
create synergies
• Requirements for certification?Objective Observations
Systematic data in space &
time
Multiple spatial scales,
economies of scale
Source: ESA
Accessibility (open-source)
& cloud-based delivery
Remote Sensing Integration into models,
GIS und WIS
hydrosolutionsRemotely Sensed Variables of Interest
for the Water Manager
Directly Observable Derived Variables
Land cover and changes Water use (evapotranspiration)
Irrigated areas and crop types Crop health, incl. plant water stress / need
Soil moisture Irrigation performance indicators
Soil Salinity Crop production / yield
Precipitation Local high-quality meteorological forecasts
Lake/reservoir levels and volume changes Compound climatic events & agricultural risks
Snow cover extent & dynamics
hydrosolutionsCase Studies Central Asia
Lac Wegnia
Sourou
Basin Ziway-Shala
Lake System
hydrosolutionsLake Abijata, Ziway-Shala Lake System, Ethiopia
Measuring Storage Changes
                 • Place: Lake Abijata in the
                   Ethiopian Rift Valley
                 • Problem: Vanishing endhorreic
                   lake, lack of in-situ
                   measurements
                 • Challenge: Spotty, erroneous
                   data record

hydrosolutions
Lake Abijata, Ziway-
Shala Lake System
• Sensors: Landsat 5/7/8,
Sentinel 2, ICEsat 2
• A-E-V Approach: Multi-
sensor data for the
computation of lake area,
elevation and storage
volume over time
hydrosolutionsLake Abijata, Ziway-Shala Lake System
• Surface area decline from 186 km2 in 1984 to 54 km2 in 2019
180
160
Lake Surface Area [square km]
140 SATELLITE
LANDSAT_5
120 LANDSAT_7
LANDSAT_8
100 SATELLITE SENTINEL 2
LANDSAT_5
LANDSAT_7
80
LANDSAT_8
SENTINEL 2
60
01
01
01
01
01
01
01
01
01
01
01
01
01
85
8
1
4
7
00
03
06
09
12
5
18
1
8
9
9
9
1
2
19
19
19
19
19
20
20
20
20
20
20
20
20
hydrosolutions1582
• Derivation of water level – area relationship.
1580
Lake level [m a.s.l.]
1578
1576
1574
50 100 150
hydrosolutions Surface area [km2]Lake Abijata, Ziway-Shala Lake System
• Signficant lake storage loss over observation period of -1’100 mcm
0
Elevation Data Source
ICESat 2 Laser Altimetry
SPOT 6 Stereo Satellite Imagery
300
Storage Change [mcm]
Elevation Data Source
ICESat 2 Laser Altimetry
600
→ Implications IWRM
SPOT 6 Stereo Satellite Imagery
01
01
01
01
01
01
01
01
01
01
01
91
94
97
00
03
06
09
12
15
18
21
19
19
20
20
20
20
20
20
20
20
900
01
01
01
01
01
01
01
01
01
01
01
01
01
1200
85
88
91
94
97
00
03
06
09
12
15
18
21
hydrosolutions
19
19
19
19
19
20
20
20
20
20
20
20
20Lac Wegnia, Ramsar Site in Mali
Water Accounting

                 • Place: Lac Wegnia, Mali
                 • Problem: Vanishing shallow lake
                   aquatic ecosystem posing a threat
                   to local livelihoods.
                 • Task: Attribution analysis to ensure
                   ecologically sustainable water
                   resources management and the
                   protection of the Ramsar site.
                 • Challenge: No observational
                   record.

hydrosolutions
Basin Climate Characteristics
• Data from Reanalysis for Annual P [GSMaP], PET [GLDAS] and Aridity Index
years 2000 - 2020 PET [mm] P [mm] Aridity Index [-] Linear (PET [mm]) Linear (P [mm]) Linear (Aridit y Index [-])
3'000.00 4.00
• Mean annual P: 1’009 mm y = 15.905x - 29334
3.50
• Mean annual PET: 2'500.00
3.00
2’627 mm 2'000.00
2.50
y = -0.0096x + 22.018
• Aridity Index: 2.6
[MM]
1'500.00 2.00
[-]
y = 9.9816x - 19049
• PET and P show an 1'000.00
1.50
important increasing 1.00
trend over the last 20 500.00
0.50
years! - -
2000 2005 2010 2015 2020
YEAR
hydrosolutionsDevelopment of Lake Levels
• Quarterly lake levels and Development of mean quarterly lake levels
their trends are shown Q1 Q2 Q3 Q4 Linear (Q1) Linear (Q2) Linear (Q3) Linear (Q4)
from 2000 – 2020. 330.75
330.55
• Despite the slightly 330.35
increasing precipitation 330.15
levels in the catchment, 329.95
y = -0.0097x + 349.51
[MASL]
decreasing lake level trend 329.75
detected in all quarters. 329.55 y = -0.0191x + 368.08
329.35
• Increasing likelihood of
y = -0.0193x + 368.23
329.15
lake drying completely out 328.95
y = -0.0247x + 378.8
towards the end of the 328.75
2000 2005 2010 2015 2020
dry season. YEAR
hydrosolutionsHigh-Resolution Digital Terrain Model Airbased remote sensing with a drone. Centimeter scale spatial resolution.
Lake Level and Inflow-Outflow Variations
                                                                                           H_m          Q_net_m3/s

                                                     330.6                                                                                0.3

• ΔV = (P-ET) + (Qin-Qout) + ε                       330.4                                                                                0.25

                                                     330.2
                                                                                                                                          0.2

 A-E-V     Re-      ⇒ Result                          330
         analysis

                                                                                                                                                  INFLOW - OUTFLOW [M3/S]
                                                                                                                                          0.15
                                                                 Outflow activation
                                                     329.8

                                      LEVEL [MASL]
                                                                                                                                          0.1

• Water balance closure using A-E-V                  329.6

  approach in combination with                       329.4
                                                                                                                                          0.05

  reanalysis data!                                                                                                        Qnet > 0
                                                                                                                                          0
                                                     329.2
                                                                                                                          Qnet < 0
• Conclusion: Increase lake water                                                                                                         -0.05
  depth at end of rainy season to                     329

  store more water                                   328.8                                                                                -0.1
  in order to prevent the lake from
  entirely drying out.                               328.6                                                                                -0.15
                                                             0              10        20                    30       40              50
                                                                                                 WEEK

                                                                                                                                          hydrosolutions
Understanding
Sedimentation from
Remote Sensing
• Increasing trend of
suspended particle matter in
the lake
• Increasing erosion processes
in the catchment?
• => Estimating sedimentation
rates in Lac Wegnia is
possible!
Increasing trend in sediment concentration observed in Lac Wegnia.
Source: hydrosolutions ltd., Google EarthEngineFergana Valley, Central Asia
Crop Map, 2018

  Mapping Field Level & Crop
  Specific Water Balances
• Unsupervised machine learning
  approach for classification of crops on
  irrigated land.
• Water balance assessments can be
  carried out at different levels of
  aggregation for areas of interest, i.e.
  agricultural fields, canal command
  areas, for specific crops and district-
  level aggregates, etc.

                                                      Orchard   Cotton
                                               Winter wheat
                                                                    Vegetables
                                                  & corn
                                            Winter
                                            wheat
Evapotranspiration Map, 2018
Mapping Field Level & Crop
Specific Water Balances
• Unsupervised machine learning
approach for classification of crops on
irrigated land.
• Water balance assessments can be
carried out at different levels of
aggregation for areas of interest, i.e.
agricultural fields, canal command
areas, for specific crops and district-
level aggregates, etc.
Orchard Cotton
Winter wheat
Vegetables
& corn
Winter
wheat
hydrosolutionsFavorable Comparison with Offical Statistics
COMPARISON OF CLASSIFIED CROP AREA FROM REMOTE SENSING
AND OFFICAL WCA STATISTICS FOR 2018
1400
Sentinel-2 Unsupervised Classification WCA Statistics
1200
1000
800
Area [ha]
600
400
200
0
Wheat Cotton Orchards TOTAL
hydrosolutionsGeneralization hydrosolutions
Sourou Basin,
transboundary
wetland shared
between Mali &
Burkina Faso
Sample Monthly Hydro-Agrometeorological Bulletin

Bulletin hydro-météorologique: Version préliminaire                                                                    Bulletin hydro-météorologique: Version préliminaire                                                                Bulletin hydro-météorologique: Version préliminaire

Résumé de la pluviométrie: mai 2020                                                                                    Analyse hydrologique par télédétection                                                                             L’analyse des surface des terres marécageuses se base sur une classification non supervisée (algorithme
                                                                                                                                                                                                                                          d’apprentissage automatique sans étiquetage manuel des données). La classification ne fait pas de dif-
Les prochaines figures montrent la précipitation mensuelle de la région du Sourou. Le produit satellitaire             La télédétection permet la surveillance du bassin Sourou à haute résolution temporelle. Les satellites de          férence entre les surfaces naturellement inondées et les terres d’agriculture de décrue. La surface des terres
opérationnel GSMaP (source: Jaxa Earth Observation Research Centre) permet des observations presque en                 la mission européenne Sentinel-2 surpassent la région tous les cinq jours. Cette étude utilise des images          marécageuses en mai 2020 était environ 14.5 km2 .
temps réel et les données sont disponibles à partir de l’année 2000. La zone d’intérêt est le site Ramsar de la        composites mensuelles à la base du critère maximisation du NDVI (indice de végétation normalisé). Les
Plaine Inondable du Sourou. Comme source historique les données des stations pluviométriques à Bankass et              données satellitaires permettent à détecter la surface des terres marécageuses en utilisant des indices d’eau et
Koro ont été utilisés qui sont disponibles à partir de 1940 jusqu’à 2019 (bien que beaucoup des données sont           de végétation.
manquantes après 2000). Par conséquent, il existe une différence d’échelle spatiale et temporelle entre les
données des stations et les données du produit satellitaire opérationnel.

(a) Précipitation du produit GSMaP: Pour la moyenne 2000-2019   (b) Données historiques des stations pluviométriques
l’écart type est indiqué sur la courbe.

Figure 1: Précipitation mensuelle de la région du Sourou. Le produit opérationnel montre la précipitation
pour la Plaine Inondable du Sourou, les données historiques sont disponibles pour les stations de Bankass et
Koro.

                                                                                                                                                                                                                                             (a) Résultat de la classification non supervisé: mai 2020.   (b) Comparaison de la surface du marais de cette année avec la
                                                                                                                                                                                                                                                                                                          surface des années précédentes.
                                                                                                                                    (a) 2020-03                         (b) 2020-04                          (c) 2020-05
                                                                                                                                                                                                                                          Figure 7: Variations saisonnières de la surface des terres marécageuses de la Plaine Inondable du Sourou.
                                                                                                                       Figure 6: Images composites mensuelles en mode couleur (RVB). Les images de la mission satellitaire
                                                                                                                                                                                                                                          L’étendue maximale est atteinte habituellement en novembre, mais des variations interannuelles sont possibles.
                                                                                                                       Sentinel-2 permettent d’observer le bassin de Sourou à partir de l’espace.
                                                                                                                                                                                                                                          La courbe 2016-2019 dans (b) représente la surface moyenne mensuelle du marais et l’écart type.
                                                                                                                       La surface des terres marécageuses de la Plaine Inondable du Sourou montre des variations saisonnières
                                                                                                                       considerables. Pendant les dérnières années, la surface du marais a fluctué entre 8 et 210 kilomètres carrées.
                                                                                                                       L’étendue maximale est normalement atteinte en novembre et le minimum entre mai et juillet (voir Figure 6).

               (a) Précipitation mensuelle: Mai                    (b) Anomalie de précipitation mensuelle: Mai

Figure 2: Précipitation et anomalie de précipitation mensuelle obtenue par le produit opérationnel satellitaire
GSMaP. L’anomalie de précipitation est la différence entre la précipitation de cette année et la moyenne de
2000-2019.

                                                           2                                                                                                                  6                                                                                                                           7
Opportuntities for
Operationalization
• Digital data chain
• Cloud computation does not require
expensive local infrastructure (only
access to internet)
• Reliance of open-access data
• Where present, straight forward
integration into digital Water
Information System
• Example from iMoMo Project:
Implementation of digital operational
hydrology tool in Central Asia
Hydrometeorological Agencies
hydrosolutionsOpportunities
for Local
Private Sector
Developments
• Monitoring innovations
offer opportunities for
service deliveries through
local private sector
agents.
• Incubation of local startup
scene has to potential to
attract real talent.
• Fostering of public-private
partnerships to ensure
viable business models.
hydrosolutions• Remote sensing
• No final deployment. Support for
maintenance and upgrade needs to be
ensured even after product co-design
Challenges and implementation.
• Relevance of adding new data from new
sensors.
& Risks • Cloud computing and Storage and online
deployment
• Often considered to be the source of all
evil. However, benefits largely outview
perceived drawbacks and risks to
securities.Conclusions
• Complementary monitoring revolutionizes the field of hydrological
observations and faciliates key improvements in objective, facts-based
decision-making for management and planning.
• Cloud-based computational resources using open-source data
increasingly provide a most powerful source of essential information,
knowledge and intelligence for the water professionals.
• Integration into modern water information systems of digital data from
monitoring through local involvement and from remote sensing is
straight forward.
• Opportunties for local private sector development and public-private
partnerships.
hydrosolutionsYou can also read