The impact of dama wallaby (Macropus eugenii) and red deer (Cervus elaphus) on forest understorey in the Lake Okataina Scenic Reserve 2017 ...
←
→
Page content transcription
If your browser does not render page correctly, please read the page content below
The impact of dama wallaby (Macropus eugenii)
and red deer (Cervus elaphus) on forest
understorey in the Lake Okataina Scenic
Reserve – 2017 update

Sarah Wright, Biodiversity Monitoring Ranger
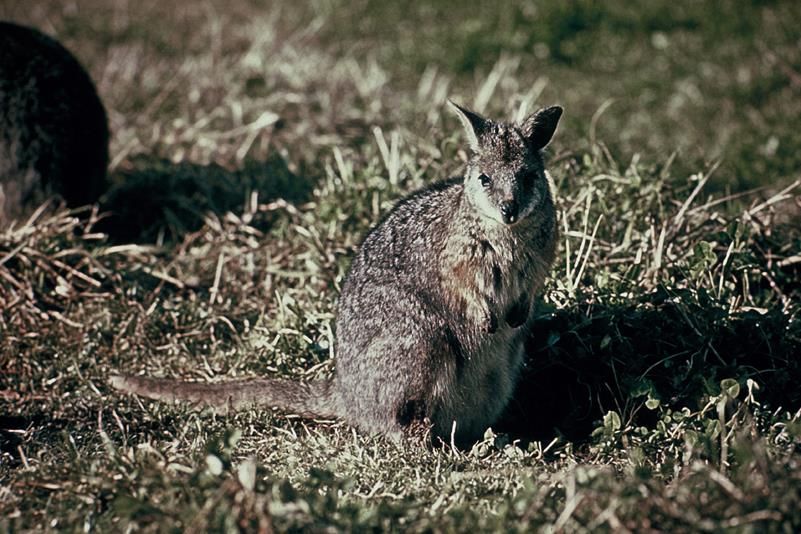
Cover image: Dama wallaby (Macropus eugenii), 1977, Department of Conservation

© Copyright: December 2017, New Zealand Department of Conservation

All information and data within this document remain the property of the Department of Conservation.
Use of this information in other outputs (e.g. maps, reports, publications) or its distribution by other
means must acknowledge this report by stating the following details:

Wright, S. 2017. The impact of dama wallaby (Macropus eugenii) and red deer (Cervus elaphus) on forest
understorey in the Lake Okataina Scenic Reserve – 2017 update. Unpublished report, Department of
Conservation, New Zealand, DOC-3223478.

Unless otherwise stated, all images contained within this report remain the property of the owners
and must not be reproduced in other material without their permission.

The Department gives no warranty that the information or data in this report are free from error. The
Department will not accept liability for any losses, damages or expenses suffered from the use, or
lack of use, directly or indirectly, of the information or data provided in this report.

This report was
 Reviewed by                                           Approved for release by
 Dean Clarke, Supervisor Biodiversity Monitoring       Ingrid Gruner, Ranger Biodiversity Monitoring
                                                       16 January 2018

Department of Conservation, Biodiversity Monitoring Team 2017

In the interest of forest conservation, we support paperless, electronic publishing.
Contents
Summary .............................................................................................................................................................. 1
Introduction .......................................................................................................................................................... 1
Methods ................................................................................................................................................................ 2
Analysis ....................................................................................................................................................... 2
Results .................................................................................................................................................................. 3
Tall seedling and sapling density and height......................................................................................... 3
Species diversity ........................................................................................................................................ 4
Density of tall seedlings and saplings by palatability ........................................................................... 6
Discussion ............................................................................................................................................................ 8
Recommendations .............................................................................................................................................. 9
References ........................................................................................................................................................... 9Summary This report provides an update on the results of an exclosure study in Lake Okataina Scenic Reserve, Bay of Plenty. In 1984, three 20 x 20 m plots were established, two of which were fenced to exclude: a) dama wallaby (Macropus eugenii) only, and b) dama wallaby and red deer (Cervus elaphus). The third plot remained unfenced. The objective was to assess the respective impacts of dama wallaby and red deer on the forest understorey. The results show that dama wallaby mainly impacted on the seedling layer, drastically reducing seedling density and diversity, and causing the disappearance of preferred food species. Red deer did not prevent seedling establishment to the same extent, but prevented seedlings from maturing into saplings. Thus, both species had a profound effect on the composition and structure of the forest understorey, and together effected a severely depleted forest understorey. Effective control of dama wallaby alone is likely to have some benefit for the forest ecosystem, but control of both species, wallaby and red deer, would be required to achieve full recovery of regenerative processes. Palatable species would likely return. After five measurements over 33 years, the study now provides a good understanding of the short to medium-term effects of wallaby and red deer on the forest understorey at Lake Okataina Scenic Reserve. An understanding of long-term effects, e.g. effects on composition and structure of the forest canopy, would require ongoing monitoring. However, sufficient information may already be available in the published literature or through the Department’s National Biodiversity Monitoring and Reporting System. Introduction Three permanent 20 x 20 m plots were set up in Lake Okataina Scenic Reserve, Bay of Plenty, in 1984. Two of the plots were exclosure plots, one excluding both red deer (Cervus elaphus) and dama wallaby (Macropus eugenii) (dual exclosure plot), the other excluding only dama wallaby (wallaby exclosure plot). The third plot had no exclosure, i.e. it was left open to both, dama wallaby and red deer (control plot). The plots were established to investigate the effects of dama wallaby and red deer on the forest understorey at Okataina Scenic Reserve. An area within the Reserve called Dogger Bank was chosen as the site for the three plots, as it was known to have a large wallaby population (Wallace & Wallace 1995). Dama wallabies were released in the Bay of Plenty area around 1912 (Wodzicki & Flux 1967). Since then, they have naturalised in the indigenous and exotic forests around Lake Okataina. They are now thought to occur in higher numbers than other introduced mammals such as red deer, possums (Trichosurus vulpecula) and pigs (Sus scrofa; Knowlton & Panapa 1982; Benes 2001), although their density has never actually been assessed (Benes 2001). Numbers of wallaby are thought to be ‘moderate’, while deer numbers are considered ‘low-moderate’ (Paul Cashmore pers. comm. 2017). Generally, wallaby prefer grazing on pasture species. Where they have access to pasture, upwards of 70% of their diet consists of pasture species (Williamson 1986). Where they have naturalised in forest, they have adapted to a diet of forest species, with a preference for species such as mahoe (Melicytus ramiflorus), kamahi (Weinmannia racemosa), hangehange (Geniostoma ligustrifolium) and porokaiwhiri (Hedycarya arborea) (Williamson 1986; Wallace & Wallace 1995). Williams (1997) provides a detailed account of the history of aerial 1080 operations in the Okataina area. 1080 was used to control wallaby numbers, as re-measurements of the 20 x 20 m plots suggested that in particular wallaby were having a deleterious effect on the understorey development in kanuka forests (Llewellyn & Panapa 1985). However, Benes (2001) and Natural Environments (2007), again analysing DOC-3223478 Impact of dama wallaby and red deer at Lake Okataina Scenic Reserve 1
the data from the three experimental plots, found that deer were having a more drastic effect on
understorey regeneration and species composition than wallabies.
This report provides a further update on the findings from the three 20 x 20 m plots. They have now been
measured five times, namely in 1984, 1992, 1998, 2007 and 2017. The objective was to assess the
relative impact of dama wallaby and red deer on the composition and structure of the forest understorey at
Lake Okataina Scenic Reserve. We focused especially on changes in trends since the last measurement.

Methods
The three 20 x 20 m plots were assessed using the New Zealand standard method for monitoring
permanent plots in forest, including a reconnaissance description (RECCE). For references and changes
in the methods over time see Natural Environments (2007).
The most recent re-measurement occurred in April 2017 by a field team consisting of Tim O’Neill, Oskar
Guy, Tony Lawson, Jen Waterhouse, Jesse Friedlander and Ruby Collier. Methods followed those
described in Hurst and Allen (2007).

Analysis
Data were graphed to visualise changes over time and differences between the three plots. In particular,
we graphed
    •   Density of tall seedlings and saplings
    •   Proportion of tall seedlings by height class
    •   Diversity of small seedlings, tall seedlings and saplings
    •   Density of tall seedlings and saplings by palatability
Small seedlings were woody plants 135 cm tall with a stem diameter at breast height
Results
Tall seedling and sapling density and height
In the first measure in 1984, tall seedling and sapling densities were low (Figure 1, Figure 2). The dual and
wallaby exclosure plots had slightly more tall seedlings than the control plot, but all plots had
< 20 saplings. In the second measure, in 1992, tall seedling density had increased about 14-fold in both
the dual and the wallaby exclosure plot. In contrast, no tall seedlings at all were recorded in the control
plot. Sapling density had increased even more, about 70-fold, in the dual exclosure plot, but only showed
a 6-fold increase in the wallaby exclosure and doubled in the control plot.
3000
2500
2000
Number/plot
1500
1000
500
0
1984 1992 1998 2007 2017
Duel 110 1552 41 28 24
Wallaby 176 2531 100 54 35
Control 88 0 3 4 4
Figure 1. Density of tall seedlings (number/plot) in the three plots over time.
After 1992, tall seedling density returned to low levels. The data also suggest a decreasing trend over time
in the two exclosure plots. In 2017, the density of tall seedlings in the two exclosure plots was at its lowest
since monitoring began. Numbers in the wallaby exclosure were still slightly higher than in the dual
exclosure.
Sapling density in the dual exclosure plot also declined over time, but was still markedly higher than in the
other two plots in 2017. Sapling density was relatively stable in the wallaby exclosure. The control plot
consistently showed the lowest densities of tall seedlings and saplings.
The 16-45 cm height class made up the largest proportion of tall seedlings in in all three plots (Figure 3).
The control plot had only tall seedlings in this height class in 2017 (only 4 seedlings total). In the two
exclosure plots this height class made up about 50% of tall seedlings, which was slightly less than in
2007. Instead, the proportion of seedlings in the taller height classes increased in both exclosures. The
106-135 height class increased especially in the dual exclosure plot.
DOC-3223478 Impact of dama wallaby and red deer at Lake Okataina Scenic Reserve 31000
900
800
700
Number/plot
600
500
400
300
200
100
0
1984 1992 1998 2007 2017
Duel 13 891 614 460 292
Wallaby 17 102 56 142 120
Control 18 35 36 8 5
Figure 2. Density of saplings (number/plot) in the three plots over time.
100%
Cumulative percentage by height class
90%
80%
70%
60%
106-135
50%
76-105
40%
46-75
30%
16-45
20%
10%
0%
1992 1998 2007 2017 1992 1998 2007 2017 1992 1998 2007 2017
Duel Wallaby Control
Figure 3. Proportion of tall seedlings in each of four height classes in the three plots.
Species diversity
In 1984, species diversity of small seedlings was highest in the control plot and lowest in the wallaby
exclosure (Figure 4). Subsequently, diversity remained relatively constant in the control plot, while it
showed a marked increase in the two exclosure plots, especially in the wallaby exclosure. In 2017, small
seedling diversity had decreased again. In the dual exclosure it was back to the 1984 level, while it was
still raised in the wallaby exclosure.
DOC-3223478 Impact of dama wallaby and red deer at Lake Okataina Scenic Reserve 416
14
12
Number of Species
10
8
6
4
2
0
1984 1992 1998 2007 2017
Duel 5 7 10 10 5
Wallaby 3 11 11 14 8
Control 8 7 4 9 6
Figure 4. Species diversity of small seedlings (16
14
12
Species diversiity
10
8
6
4
2
0
1984 1992 1998 2007 2017
Duel 4 10 12 9 10
Wallaby 4 6 6 11 15
Control 3 4 4 2 2
Figure 6. Species diversity of saplings in the three plots over time.
Density of tall seedlings and saplings by palatability
In 1984, no palatable tall seedlings were recorded in any of the plots (Figure 7). By 1992, the density of
palatable tall seedlings had substantially increased in both exclosure plots. The increase was greater in
the wallaby exclosure (1977 palatable tall seedlings) than in the dual exclosure plot (1308 palatable tall
seedlings). The number of unpalatable tall seedlings also showed an increase, with 554 tall seedlings in
the wallaby exclosure and 243 tall seedlings in the dual exclosure. No such increase in tall seedlings was
observed in the control plot. Only the number of unpalatable saplings had increased in this plot in 1992.
Saplings also increased in the dual exclosure plot, much more markedly than in the control plot, and here
they were mainly palatable species.
In 1998, the density of palatable and unpalatable tall seedlings had declined again in both exclosure plots
and remained low in subsequent measurements. The density of palatable saplings in the dual exclosure
declined more slowly over time, but this plot had consistently the greatest number of palatable saplings. In
2017, all plots showed low densities of tall seedlings, but some palatable species were present in the
exclosure plots. Sapling density was also low in the wallaby exclosure, but included some palatable
species. The number of palatable saplings in the dual exclosure was still markedly higher than in the other
plots. Palatable species were consistently absent from the control plot except in 1998, when one tall
seedling of Myrsine australis was recorded (Natural Environments Ltd 2007).
DOC-3223478 Impact of dama wallaby and red deer at Lake Okataina Scenic Reserve 61400
1200
1000
800
600
400
200
0
1984 1992 1998 2007 2017
Duel
SEED PAL SEED UNPAL SAP PAL SAP UNPAL
2500
2000
1500
1000
500
0
1984 1992 1998 2007 2017
Wallaby
SEED PAL SEED UNPAL SAP PAL SAP UNPAL
100
90
80
70
60
50
40
30
20
10
0
1984 1992 1998 2007 2017
Control
SEED PAL SEED UNPAL SAP PAL SAP UNPAL
Figure 7. Density of palatable tall seedlings (SEED PAL), unpalatable tall seedlings (SEED UNPAL), palatable
saplings (SAP PAL) and unpalatable saplings (SAP UNPAL) in the three plots over time. Top – dual exclosure,
middle – wallaby exclosure, bottom – control plot.
DOC-3223478 Impact of dama wallaby and red deer at Lake Okataina Scenic Reserve 7Discussion The 2017 measurement of the three 20 x 20 m plots in Lake Okataina Scenic Reserve largely supported the findings of 2007 (Natural Environments 2007), but also raised some new aspects. 1) Browse by deer does not appear to inhibit the establishment of seedlings. This was supported by the observation that the wallaby exclosure contained more tall seedlings than the dual exclosure in all measurements. However, deer browse prevents seedlings from growing tall and reaching sapling stage. The dual exclosure plot showed higher sapling densities than the wallaby exclosure in all measurements. This is in agreement with other studies that found ungulates affecting sapling recruitment more than seedling recruitment (e.g. Kuijper et al. 2010, Rooney et al. 2002, Wright et al. 2012). 2) Wallabies seem to suppress the establishment of seedlings. This was suggested by the observation that the wallaby exclosure had distinctly higher seedling densities than the control plot. 3) The observed decline in sapling numbers in the dual exclosure over time was likely caused by saplings growing into trees, and new recruitment of saplings slowing down after the first ‘flush’. The raw plot data for 2017 indicated that species like Melicytus ramiflorus, Myrsine australis and Litsea calicaris were increasingly appearing in taller height tiers. This was not further analysed for this report. 4) Food preferences of deer and wallaby lead to changes in the species composition of the seedling and sapling layers, with flow-on effects into the forest canopy likely. Palatable species were virtually absent from the control plot, while they appeared in the exclosures in all measurements after fencing occurred. Similar effects have previously been observed in other forest ecosystems (e.g., Rooney & Waller 2003, Husheer et al. 2003, Smale et al. 1995). 5) The presence of palatable species in the exclosure plots also suggested that, if effective control of wallaby and deer were implemented in the Lake Okataina Scenic Reserve, the likely result would be the re-establishment of palatable species enhancing the ecological integrity of the forest. 6) The increase in seedling and sapling diversity triggered by deer browse, as suggested by Natural Environments (2007) may only be a temporary effect. In 2017, diversity of small seedlings had markedly declined in both exclosures. Diversity of tall seedlings and saplings was still high, but may decrease over time as new recruits from the small seedling layer show less diversity. It is important to note that species diversity is simply the number of different species present. It does not express which species are involved, i.e. while species diversity might decline again in the longer-term, a change in composition may still occur. 7) Adding the 2017 data to the data set showed more clearly that the exclusion of wallabies led to some improvements in seedling establishment, recruitment of tall seedlings and saplings, and return of palatable species. However, these changes were much less pronounced than in the dual exclosure. 8) The overall conclusion that a combination of wallaby and deer browse in the forest will supress regeneration and lead to a severely depleted forest understorey still holds. The control plot contained extremely small numbers of seedlings and saplings, showed little diversity and palatable species were virtually absent. DOC-3223478 Impact of dama wallaby and red deer at Lake Okataina Scenic Reserve 8
Recommendations
If the management aim at Lake Okataina Scenic Reserve is to restore the forest to a state where the full
complement of native woody plants is present and natural processes are fully intact, then both, deer and
wallaby, need to be effectively controlled. Control of wallaby alone would have some beneficial effect, e.g.
in maintaining the presence of some palatable species, but full recruitment would not be achieved. We
cannot assess what control of deer alone would achieve, as the experimental set up does not include a
deer-only exclosure, although this was recommended by Natural Environments (2007).
The objective of the study was to better understand the relative impacts of deer and wallaby on the forest
at Lake Okataina Scenic Reserve. The study has achieved this objective with the data to date as far as
short to medium-term impacts and consequences are concerned (33 years). Continuing the study would
provide a long-term picture of effects. Measurements at 10-yearly intervals should be sufficient for this.
Data analysis after the next measurement should include the tree data, as species turnover in the canopy
might start to become apparent.
A major limitation of the present study is that it has been set up without replication. Each treatment is
represented by only one plot. This means that the observed changes cannot be reliably attributed to a
treatment, as they could also be caused by natural variation between the plots. The results need to be
considered with this in mind.
Before deciding to undertake another measurement of the three plots, advice should be sought whether
sufficient and more reliable information on the long-term effects of wallaby and deer is available either
from published studies in the literature or from data in the Department’s National Biodiversity Monitoring
and Reporting System.

References
Hurst, J. M., Allen, R. (2007). A permanent plot method for monitoring indigenous forests: field protocols.
Landcare Research New Zealand.
Benes, M. (2001). The effects of dama wallaby (Macropus eugenii) and red deer (Cervus elaphus) on the
native vegetation of the Okataina Scenic Reserve. MSc thesis, University of Waikato.
Husheer, S. W., Coomes, D. A., .Robertson, A. W. (2003). Long-term influences of introduced deer on the
composition and structure of New Zealand Nothofagus forests. Forest Ecology and Management 181 (1-
2), 99-117.
Knowlton, J, Panapa, N. (1982). Dama wallaby survey at Okataina Scenic Reserve. Unpublished report,
New Zealand Forest Service, Rotorua.
Llewellyn, J. E., Panapa, A. N. (1985). The impact of browsing animals on kanuka dominant forest at Lake
Okataina, as shown by exclosures. Technical Report No. 8, Department of Conservation, Rotorua.
Kuijper, D. P. J., Cromsigt, J. P. G. M., Jędrzejewska, B., Miścicki, S., Churski, M., Jędrzejewski, W. and
Kweczlich, I. (2010). Bottom-up versus top-down control of tree regeneration in the Białowieża Primeval
Forest, Poland. Journal of Ecology 98, 888–899.
Natural Environments (2007) The impact of dama wallaby (Macropus eugenii) and red deer (Cervus
elaphus) on the forest understorey in the Lake Okataina Scenic Reserve. Unpublished report,
Environment Bay of Plenty (DOCDM-570742).
Rooney, T. P., Waller, D. M. (2003). Direct and indirect effects of white-tailed deer in forest ecosystems.
Forest Ecology and Management 181 (1-2), 165-176.

  DOC-3223478 Impact of dama wallaby and red deer at Lake Okataina Scenic Reserve                             9
Rooney, T. P., Solheim, S. L., Waller, D. M. (2002). Factors affecting the regeneration of northern white
cedar in lowland forests of the Upper Great Lakes region, USA. Forest Ecology and Management 163 (1-
3), 119-130.
Smale, M. C., Hall, G. M. J., Gardner, R. O. (1995). Dynamics of kanuka (Kunzea ericoides) forest on
South Kaipara spit, New Zealand, and the impact of fallow deer (Dama dama). New Zealand Journal of
Ecology 19 (2), 131-141.
Wallace, S. W., Wallace, G. (1995). The impact of dama wallaby (Macropus eugenii) on forest
understoreys in the Lake Okataina Scenic Reserve. Unpublished report, Department of Conservation,
Rotorua.
Williams, D. S. (1997). Evaluation of bait stations and management options for control of dama wallabies
(Macropus eugenii) in the Bay of Plenty, New Zealand. PhD thesis, Otago University.
Williamson, G. M. (1986). The ecology of dama wallaby, Macropus eugenii (Desmarest), in forests at
Rotorua, with special reference to diet. MSc thesis, Massey University.
Wodzicky K., Flux, J. E. C. (1967). A guide to introduced wallabies in New Zealand. Tuatara 15 (2), 47-59.
Wright, D. M., Tanentzap, A. J., Flores, O., Husheer, S. W., Duncan, R. P., Wiser, S. K., Coomes, D. A.
(2012). Impacts of culling and exclusion of browsers on vegetation recovery across New Zealand forests.
Biological Conservation 153, 64-71.

 DOC-3223478 Impact of dama wallaby and red deer at Lake Okataina Scenic Reserve                       10
List of species in the understorey of forest in Lake Okataina Scenic Reserve classed as palatable (p) and
unpalatable (unp).
Species scientific name          Palatability
Aristotelia serrata                         p
Asplenium flaccidum                     unp
Beilschmiedia tawa                      unp
Blechnum novae-zealandiae               unp
Brachyglottis repanda                   unp
Carex spp.                              unp
Carpodetus serratus                     unp
Cirsium vulgare                         unp
Coprosma grandifolia                        p
Coprosma lucida                             p
Coprosma robusta                            p
Digitalis purpurea                      unp
Elaeocarpus dentatus                        p
Fuchsia excorticata                         p
Galium aparine                          unp
Geniostoma ligustrifolium                   p
Hedycarya arborea                       unp
Hymenophyllum spp.                      unp
Ixerba brexioides                       unp
Knightia excelsa                        unp
Kunzea robusta                          unp
Leptospermum scoparium                      p
Leucopogon fasciculatus                 unp
Litsea calicaris                        unp
Melicytus ramiflorus                        p
Microsorum pustulatum                   unp
Mycelis muralis                         unp
Myrsine australis                           p
Parsonsia spp.                              p
Piper excelsum                          unp
Pittosporum eugenioides                     p
Pittosporum tenuifolium                     p
Pseudopanax arboreus                        p
Pseudopanax crassifolius                unp
Pseudowintera colorata                  unp
Pyrrosia elaeagnifolia                  unp
Ripogonum scandens                      unp
Rubus cissoides                         unp
Schefflera digitata                         p
Senecio jacobaea                        unp
Solanum spp.                            unp
Uncinia spp.                            unp
Weinmannia racemosa                         p

 DOC-3223478 Impact of dama wallaby and red deer at Lake Okataina Scenic Reserve                        11
You can also read


