Cold Weather Operations Summary - January 28 - 31, 2019 - PJM
←
→
Page content transcription
If your browser does not render page correctly, please read the page content below
February 5, 2019
                                               Operating Committee

             Cold Weather Operations Summary
                    January 28 – 31, 2019

PJM © 2019                    www.pjm.com           1|P a g e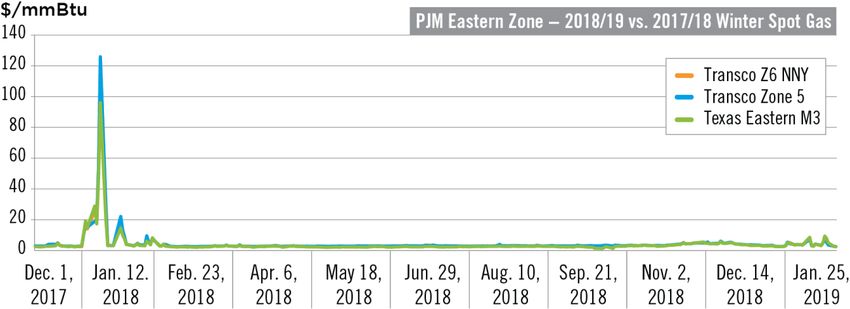
February 5, 2019
                                                                                               Operating Committee

Following is a summary of the operations that occurred during the week of January 28, 2019. The information should
be considered preliminary and may be subject to change based on further review. This initial summary is being
provided in advance of the Operating Committee meeting on February 5, 2019, with additional details added as an
appendix to the main body as information becomes available and analysis is completed.

During the week of January 28, the coldest air mass of the winter season so far, moved into the PJM footprint. The
cold temperatures began to move into the western part of the RTO as early as Tuesday and then spread east across
the RTO for the second part of the week. Daytime temperatures in the ComEd zone on Tuesday were right around
zero degrees. By Wednesday morning temperatures across most of the western part of the RTO were in the single
digits or colder. By Thursday morning temperatures in the Mid-Atlantic area of PJM were in the single digits while
most of PJM West was below zero. Morning low actual temperatures (not wind chill) on Thursday in the ComEd
transmission zone were negative 24 degrees. Temperatures moderated on Friday.

Figure 1:    NOAA Temperature Map

In anticipation of the cold weather PJM issued a Cold Weather Alert for the ComEd transmission zone for Tuesday, a
Cold Weather Alert for PJM West for Wednesday and a Cold Weather Alert for the entire RTO on Thursday and
Friday. In addition PJM hosted an SOS conference call on Tuesday to review expected system conditions with
generation owners and transmission owners.

    PJM © 2019                                          www.pjm.com                                  2|P a g e
February 5, 2019
                                                                                                Operating Committee

The load increased significantly as the frigid air mass moved into the RTO. The figure below shows the RTO load
over the period between Wednesday, Jan. 30 and Friday, Feb. 1. The overall RTO load continued to increase as the
cold weather moved from the western region and into the mid-Atlantic zone of the RTO. By Wednesday the cold air
was firmly entrenched in the west and temperatures were dropping through the day in the Mid-Atlantic zone as a cold
front moved off the coast. The Wednesday evening peak load was approximately 136,000 MW. The highest RTO
load for the period occurred on Thursday morning. The RTO peak load on Thursday morning approached
140,000 MW.

Figure 2:    RTO Load

Overall generation performance through the period was good. Forced outages were slightly greater than normal
which is typical for periods of extreme cold temperatures. PJM has compiled preliminary generation outage
information for the Wednesday evening peak period and the Thursday morning peak period. The figures below show
the total generation forced outages by fuel type for the two peak periods.

The forced outages for the Wednesday evening peak shown in the figure below on the left were just over 8.6 percent
of the total PJM capacity. The forced outages for the Thursday morning peak shown in the figure above on the right
were just over 10.6 percent of the total PJM capacity. At the peak hour on Jan. 31, 2019 HE 8, non-supply-related
outages on gas fired generation (7,825 MW) were similar in magnitude to outages reported in 2018 (8,096 MW). Gas
supply-related outages decreased from 5,913 MW in 2018 to 2,930 MW on Jan. 31, 2019. Outage rates for all
“Other” unit types were also consistent with rates seen in 2018.

    PJM © 2019                                           www.pjm.com                                 3|P a g e
February 5, 2019
Operating Committee
Figure 3: Forced Outages: Jan. 30-31
By way of comparison, generation forced outages by fuel type for the 2018 winter peak are shown below to the right.
Generation forced outages by fuel type for the 2014 polar vortex outbreak are shown on below to the left. The forced
outage rates experienced between Jan. 30 and Jan. 31, 2019 lower than the forced outage rates that occurred during
the winter peak of 2018 which were 12.1 percent and significantly lower than the forced outage rates experienced
during the polar vortex event of 2014 which were 22 percent. Appendix I and Appendix II (February 15, 2019)
contain additional generator performance analysis.
Figure 4: Forced Outages: 2014 Polar Vortex and 2018 Winter Peak
PJM © 2019 www.pjm.com 4|P a g eFebruary 5, 2019
Operating Committee
Market Operations
Locational Marginal Prices (LMPs) were moderate throughout the two days, averaging $54/MWh and $58/MWh on
January 30 and January 31, respectively. Reserve market clearing prices (MCP) remained close to $0/MWh for the
majority of the two days. However, LMPs and reserve market clearing prices were elevated during the Wednesday
evening and Thursday morning peaks. Below is a summary of the five-minute LMPs and MCPs observed during
these peaks.
Wednesday January 30 Thursday January 31
Evening Peak Morning Peak
(Hours: 17, 18, 19, 20) (Hours: 7, 8, 9, 10)
Average Maximum Minimum Average Maximum Minimum
RTO LMP ($/MWh) $ 117 $ 747 $ 53 $ 73 $ 144 $ 31
MAD Synchronized Reserve $ 32 $ 600 $0 $ 12 $ 102 $0
MCP ($/MWh)
RTO Synchronized Reserve $ 26 $ 300 $0 $ 12 $ 102 $0
MCP ($/MWh)
RTO & MAD $ 12 $ 260 $0 $0 $0 $0
Non-Synchronized Reserve
MCP ($/MWh)
There were two periods of shortage pricing in the synchronized reserve market, both of which occurred following the
loss of generation. On Wednesday, January 30 as PJM approached the evening peak following the forced outage of
a generator in the western part of the RTO, MAD and RTO synchronized reserve prices were $600/MWh and
$300/MWh, respectively, and the energy price approached $750/MWh. The second period of shortage pricing
occurred in the early morning hours on Thursday, January 31. The system energy price was just over $1,000
following the loss of a generator in the eastern part of the RTO, and MAD and RTO synchronized reserve prices
reached just over $900/MWh and $600/MWh, respectively.
Reserve Pricing
Figure 5: shows hourly integrated Synchronized and Non-Synchronized Reserve prices for the period of Jan. 30 –
Feb. 1, 2019. Reserve clearing prices were at or near $0 for the majority of the hours during this period of relatively
stressed system conditions, even during the peak hours.
PJM © 2019 www.pjm.com 5|P a g eFebruary 5, 2019
Operating Committee
Figure 5: Hourly Integrated Synchronized and Non-Synchronized Reserve Prices
PJM © 2019 www.pjm.com 6|P a g eFebruary 5, 2019
Operating Committee
Appendix I
There is 14,312 MW of generation that has announced their retirement whose performance was reviewed as part of
this analysis. Based on the data in Figure 6: and Figure 7: most retiring units were offered as must run in the Day-
Ahead Market (must run indicates that the generating unit is self-scheduling), and the data in the figures includes
nuclear, oil, gas, coal, etc. resources. Approximately 5 percent of retiring unit ICAP was picked up economically in
the Day-Ahead Market, and approximately 6 percent of retiring unit ICAP was available in reserve shutdown1 but not
scheduled due to economics. Forced outage rates for retiring units ranged from 18 percent to 23 percent, this is
approximately double the PJM RTO forced rates during the same peaks which ranged from 7.0 percent to 10.6
percent.
Figure 6: Announced Retirement Generator Performance (Capacity)
Figure 7: Announced Retirement Generator Performance (Percent)
1 https://www.pjm.com/~/media/documents/manuals/m22.ashx Section 2, Definitions, Page 13
PJM © 2019 www.pjm.com 7|P a g eFebruary 5, 2019
Operating Committee
The 14,312 MW of generation that has announced retirement, and not cleared as Capacity Resources as part of the
RPM, produced between 8,900 MW – 9,500 MW of energy over the peak hours from Jan. 30 to Feb. 1, 2019.
Figure 8: contains data for scheduled MW in Day-Ahead Market from units not committed in RPM or units committed
partially in RPM. The blue portion of the bar contains scheduled MW in Day-Ahead Market from units that are not
committed in RPM. The green portion of bar contains scheduled MW from partially committed units in RPM. These
MW are scheduled in Day-Ahead Market above their cleared ICAP MW.
Figure 8: Day-Ahead Scheduled MW from Uncommitted Capacity in RPM
Figure 9: contains scheduled and unscheduled capacity in Day-Ahead Market from committed RPM units, which
totaled approximately 160,000 MW. The blue portion of the bar contains unscheduled MW but available to be
scheduled in Day-Ahead Market from units committed in RPM. The green portion of bar contains scheduled MW in
Day-Ahead Market from units committed in RPM.
Figure 9: Day-Ahead Scheduled and Unscheduled MW from Committed by RPM units
PJM © 2019 www.pjm.com 8|P a g eFebruary 5, 2019
Operating Committee
Appendix II (February 15, 2019)
GADS vs. eDART Data
The PJM eDART system is an online portal that is The eDART outage data, by design, is based on a
used in real-time operations to track generating unit snapshot in time, and not integrated over an hour. The
capabilities on a minute-by-minute basis. PJM Generation GADS data, on the other hand, will be integrated over the
Owners (GO) submit unit forced/unplanned outages and hour. For example, if a unit had a full outage in the first half
reductions through this portal during the current operating of an hour but became fully available in the second half of
period so that, at any given time, PJM dispatch can assess the hour, depending on the timing of the eDART data
unit availability and maintain adequate reserves to ensure snapshot, it may appear as a 0 percent reduction or a 100
system reliability. percent reduction, but not 50 percent — as would be
recorded in GADS.
When a GO submits an unplanned reduction or outage,
the actual cause of a reduction, trip or start failure may not For these reasons, it is important to emphasize that the
be known until much later and indeed may be different generation outage data provided and any associated
from the cause reported on the eDART ticket. This is partly analysis is subject to reconciliation with GADS data and is
due to the plant needing to focus on real-time operations not final. PJM recommends that any decision-making or
at the initial trip with the expectation of a more detailed trip final conclusions based on the winter data wait until the
analysis when time permits. This is reconciled at the final GADS data is released.
earliest by the 20th of the month following the month in
which the outage occurred, using the Generator Availability
Data System (GADS).
Figure 10: shows the online fuel mix at the winter peak loads on for both Jan. 5, 2018 and Jan. 31, 2019 at 8:00 a.m.
The most significant difference from Jan. 5, 2018 online fuel mix is seen in gas generation at 32 percent as compared
with 22 percent in 2018. Only a small portion of the fuel mix was supplied from oil (3 percent) as compared to 10
percent in 2018. Coal and nuclear generation were down slightly from 2018 winter peak as well with approximately
3,300 MW of coal ICAP retiring between Jan1, 2018 and Feb.1, 2019. Hydro contribution increased from 2 percent
to 4 percent. The fuel mix change between 2018 and 2019 can be attributed to lower gas prices in 2019, which
resulted in the economic commitment of more gas generation as opposed to generators making an economic choice
to run on back-up fuel.
Figure 10: 2018 vs. 2019 Online Fuel Mix (Peak)
PJM © 2019 www.pjm.com 9|P a g eFebruary 5, 2019
Operating Committee
Figure 11: shows that fuel mix remained fairly consistent through the period of Jan. 30, 2019 to Feb. 1, 2019. Coal
utilization peaked on Jan. 31, an increase of approximately 3,700 MW from the previous day.
Figure 11: Online Generation (Peak Hours)
Figure 12: illustrates the online fuel mix during the five peak hours that occurred from the morning of Jan. 30 through
the morning of Feb. 1 and compares them to the fuel mix seen for the rest of the winter, from Dec. 1, 2018 through
Feb. 1 2019. The colored bands show the range of the generation mix during the morning and evening peaks from
Jan. 30, 2018 to Feb. 1, 2019. The boxes in the plots show the most typical distribution throughout the 2018/19
winter period from Dec 1, 2018 to Feb 1, 2019 and the lines extending from the boxes capture the full range of the
fuel mix distribution over that same period. For the cold period, coal units generated at levels above the typical
2018/19 winter distribution and nuclear units generated below the 2018/19 winter norm. Gas and “Other” units
produced slightly above the 2018/19 winter distribution.
Figure 12: Online Generation Distribution
PJM © 2019 www.pjm.com 10 | P a g eFebruary 5, 2019
Operating Committee
Figure 13: shows eDART Installed Capacity (ICAP) broken down by primary fuel type as indicated in eDART. The
eDART ICAP includes Capacity Performance (CP) and Non-CP units, as well as energy-only resources and new
units. The eDART ICAP also reflects the full nameplate MW value for wind and solar resources.
Figure 13: eDART ICAP by Primary Fuel
Figure 14: illustrates the Forced Outages by Fuel Type over the peak hours from Jan. 30, 2019 to Feb.1, 2019.
Natural Gas Plant Outages ranged from 3,725 MW on Jan. 30 to a peak of 7,825 MW on Jan. 31. Coal unit outages
trended upward throughout the period, peaking at 10,336 MW on Feb. 1. Outages on “Other” units showed an
increase from Jan. 30-31, primarily driven by the shutdown of a large nuclear unit.
Figure 14: Forced Outages by Fuel Type, Jan 31-Feb 1, 2019, Peaks
PJM © 2019 www.pjm.com 11 | P a g eFebruary 5, 2019
Operating Committee
Figure 15: shows that fuel supply-related outages (all fuels) were lower overall, peaking at just over 3,100 MW, as
compared to over 6,400 MW in HE 9 Jan. 7, 2018. Coal and “Other” Supply issues were primarily reported as fuel
quality or wet coal.
Figure 15: Forced Outages Due to Fuel Supply Issues, by Fuel Type
PJM © 2019 www.pjm.com 12 | P a g eFebruary 5, 2019
Operating Committee
The chart in Figure 16: indicates that the majority of the interstate pipelines were utilizing a combination of weather
alert warnings, Operational Flow Orders (OFO) and ratable take requirements in order to maintain firm customer
commitments and natural gas system integrity. The weather alerts and OFO's are intended to ensure that customers
are scheduling supply on a timely basis to match their anticipated gas burn volumes to maintain adequate system
supply balance and limit pressure drop. The ratable take notice requires generators to burn gas within their firm
contractual hourly rights to maintain consistent line pressures.
Figure 16: Active Interstate Pipeline Notices
LEGEND
Color Code for Pipeline Notices
No Restrictions
Scheduling Operational Flow Order
Non-Firm Restriction
Rateable Take
Force Majeure
Capacity Constraint Notice
Weather Alert
There was a Force Majeure issued on the Texas Eastern pipeline on Jan. 21, 2019, as a result of a pipeline rupture
in Ohio. Texas Eastern was able to quickly isolate the damaged segment and gas flow to nearby PJM generation
was not interrupted by the event. As of Feb. 15, 2019, the Force Majeure remains in effect with no impacts to PJM.
Figure 17: uses eDART data to show a more detailed breakdown of the forced outages throughout the period. The
eDART data indicates that Electrical and Emissions / Environmental were the predominant forced outage causes.
PJM © 2019 www.pjm.com 13 | P a g eFebruary 5, 2019
Operating Committee
The Electrical category includes generator-related, instrumentation and transmission-system outages. The
Emissions / Environmental category includes all outages attributed to cold weather, and those related to emissions
control equipment. The issues reported included river intake icing, wind turbine blade freezing, emissions control
(water injection) and units simply not able to operate below certain temps (by OEM specs). The “Other” category
includes any outage cause type where the outage did not fall cleanly into another group or where detailed information
was not available.
Figure 17: Forced Outage Causes
Weather-related outages that may have been caused by extreme cold temperatures are summarized in Figure 18:
Freeze-related issues include freezing of fuel-handling systems, instrumentation and other auxiliary systems. Some
examples include issues due to frozen intake water, frozen transmitter equipment or icing on wind turbine equipment.
The eDART data did not indicate any frozen coal piles. Throughout the cold weather period, freezing-related outages
represented between 18 percent and 24 percent of total outages reported. Freezing-related outages peaked on Jan.
31at HE8 at approximately 5,300 MW.
PJM © 2019 www.pjm.com 14 | P a g eFebruary 5, 2019
Operating Committee
Figure 18: Freezing-Related Issues
The data in Figure 19: shows wind resource forced outage rates over the peak hours from Jan. 30 – Feb. 1, 2019.
Figure 19: Wind Resource Performance
Jan. 30, 2019 Jan. 30, 2019 Jan. 31, 2019 Jan. 31, 2019 Feb. 1, 2019
Wind Forced Outages HE08 HE20 HE08 HE20 HE08
Freezing 1,097 677 775 613 536
Non-Freezing 8,25 741 744 667 491
Total 1,922 1,418 1,519 1,280 1,027
Forced Outage Rate 21.8% 16.1% 17.2% 14.5% 11.7%
PJM © 2019 www.pjm.com 15 | P a g eFebruary 5, 2019
Operating Committee
The data in Figure 20: shows Wind and Grid Connected Solar Unit Output over the peak hours from Jan. 30 – Feb. 1,
2019.
Figure 20: Wind and Grid Connected Solar Unit Output
PJM © 2019 www.pjm.com 16 | P a g eFebruary 5, 2019
Operating Committee
Performance of CP vs. Non-CP Units
In order to obtain an assessment of Capacity Performance (CP) units and non-Capacity Performance units, PJM
reviewed eDART forced outage data for all generation resources, based on commitment type and ICAP within each
commitment type across the cold weather period. For purposes of this analysis, if a unit had a partial CP
commitment, the unit is classified as a CP resource which may result in higher forced outage rate for resources that
have partial CP commitment. Outage rates are expressed as percentages to account for the fact that there are a
larger number of CP units (by MW ICAP) than non-CP units. This data is summarized in Figure 21:
Figure 21: Forced Outages by Commitment Type
PJM © 2019 www.pjm.com 17 | P a g eFebruary 5, 2019
Operating Committee
Figure 22: depicts that when comparing CP to non-CP units; gas, oil, and “Other” CP resources had lower forced
outage rates overall than those that are non-CP. Coal CP units had a slightly higher forced outage rate than non-CP
coal units. Gas and oil CP units had lower forced outage rates in 2019 as compared to the Cold Snap in 2018, while
coal and “Other” CP units forced outage rates increased.
Figure 22: Fuel Type Assessment of Forced Outages by Commitment Type
Average
Jan. Average
Jan. 31, Feb. 1, Jan 30 –
7, Jan 3 – Jan. 30, Jan. 30, Jan. 31,
2014 Jan 7, 2019 2019 2019 2019 2019 Feb 1,
HE 8 2018 HE08 HE20 HE08 HE20 HE08 2019
Capacity
Performance 11.6% 11.1% 12.8% 12.1% 16.3% 20.4% 14.5%
Coal 18.6% Non-
Capacity 8.6% 12.0% 17.2% 16.1% 11.4% 11.5% 13.6%
Performance
Capacity
Performance 11.0% 3.3% 7.5% 10.9% 8.5% 8.2% 7.7%
Gas 32.7% Non-
Capacity 16.4% 22.1% 18.6% 24.0% 20.8% 21.3% 21.4%
Performance
Capacity
Performance 17.0% 0.6% 0.6% 0.8% 0.6% 0.6% 0.7%
Oil 27.3% Non-
Capacity 13.3% 10.3% 10.6% 15.9% 17.5% 17.2% 14.3%
Performance
Capacity
Performance 1.1% 1.9% 1.5% 4.6% 4.2% 3.7% 3.2%
Other 15.2% Non-
Capacity 4.4% 10.2% 8.0% 8.9% 6.4% 5.7% 7.8%
Performance
PJM © 2019 www.pjm.com 18 | P a g eFebruary 5, 2019
Operating Committee
The table in Figure 23: shows a comparison of CP and Non-CP forced outage rates between the “Polar Vortex” in
January of 2014, the “Cold Snap” in January of 2018, and cold weather encountered from Jan. 30 to Feb. 1, 2019.
Figure 23: Year Over Year Comparison of CP and Non-CP Unit Performance
2014 2018 2019
Average Average
Capacity Performance N/A 11.6% 14.5%
Coal
Non-Capacity Performance 18.6% 8.6% 13.6%
Capacity Performance N/A 11% 7.7%
Gas
Non-Capacity Performance 32.7% 16.4% 21.4%
Capacity Performance N/A 17% 0.7%
Oil
Non-Capacity Performance 27.3% 13.3% 14.3%
Capacity Performance N/A 1.91% 3.2%
Other
Non-Capacity Performance 15.2% 4.4% 7.8%
Natural Gas Pricing Trends
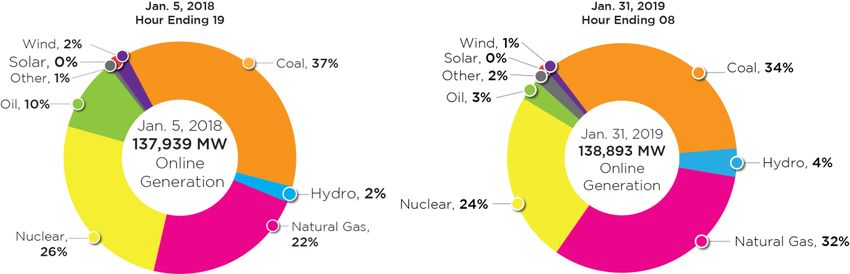
As illustrated in Figure 24:, natural gas spot prices during the cold periods in the 2018/19 winter have exhibited much
less volatility compared to the prior winter at each of the major gas trading hubs across PJM, particularly the eastern
zones. Very similar daily price levels were experienced at three key eastern region gas hubs (Transco Zones 5 and
6 as well as Texas Eastern M3 hub)
Figure 24: Daily Natural Gas Spot Prices - Eastern Zone
PJM © 2019 www.pjm.com 19 | P a g eFebruary 5, 2019
Operating Committee
Gas prices in western PJM (Chicago), as shown in Figure 25:, typically do not exhibit the same level of volatility as
zones in the more pipeline constrained eastern hubs and although the Chicago region experienced near record cold
temperatures, prices still did not reach the levels experienced during last year's cold period
Figure 25: Daily Natural Gas Spot Prices Western Zone
In general, the key difference between last year and this year in the natural gas markets is the duration of the cold
temperatures has been much shorter this year with only one to three day cold snaps sandwiched between much
warmer weather thus creating less stress on transportation and supply of natural gas with the lower gas prices
resulting in less switching to fuel oil.
PJM © 2019 www.pjm.com 20 | P a g eYou can also read