Social Differences in Changes of Quality of Life, Activities of Daily Living, and Social Participation after Diagnosis of a Chronic Condition
←
→
Page content transcription
If your browser does not render page correctly, please read the page content below

Social Differences in Changes of Quality of Life, Activities of
Daily Living, and Social Participation after Diagnosis of a
Chronic Condition
Marc Höglinger*
Together with Brigitte Wirth*, Jürgen Maurer**, Simon Seiler***
* ZHAW – Zurich University of Applied Sciences, Winterthur Institute of Health Economics
** FORS Lausanne & University of Lausanne
*** Interfaculty Centre for Educational Research (ICER), University of Bern

                                                                                           April 6, 2021
FOPH-Report: Health state of the elderly in Switzerland
Höglinger, Seiler, Ehrler & Maurer (2019)

                                                               BAG-Bericht zu Gesundheitszustand der
                                                               Schweizer Bevölkerung ab 55 Jahren basierend
                                                               auf SHARE-Daten
                                                               Mit besonderem Fokus auf…
                                                                − Chronische Erkrankungen (Non-Communicable
                                                                  Diseases, NCDs)
                                                                − Lebensqualität
                                                                − Alltagsautonomie
                                                                − Gesundheitsverhalten und Ernährung
                                                                − gesundheitliche Ungleichheiten hinsichtlich der sozio-
                                                                  demografischen Faktoren Einkommen, Bildungs-
                                                                  niveau, Migrationsgeschichte und Haushaltssituation

Höglinger                   Trajectories after NCD-Diagnosis                                2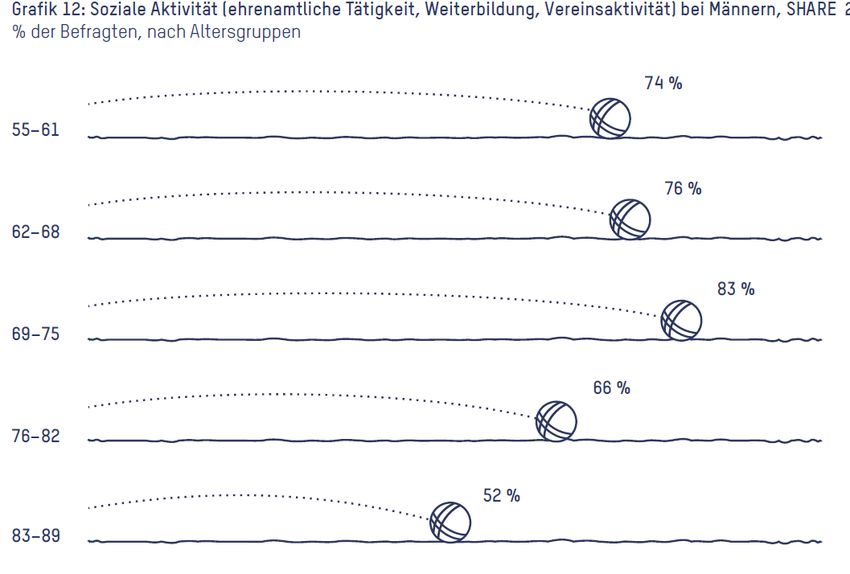
3

   FOPH-Report: Central outcome quality of Life
            Lebensqualität (CASP 12) nach Alter und Geschlecht

                                                                                                                                 − Lebensqualität als «übergreifendes»
                                                                                                                                   Konzept variiert insgesamt wenig über die
                                                                                                                                   Altersgruppen.
                                                                                                                                 − Leichte Zunahme mit Pensionierung
                                                                                                                                 − langsame Abnahme mit zunehmendem Alter,
                                                                                                                                   etwas stärker bei Frauen

Punktschätzer mit 95%-Konfidenzintervall für Altersgruppen. Gestrichelte Linien sind gleitende Mittelwerte für die einzelnen
Jahrgänge. Dass die Punktschätzer nahe bei den jeweiligen gleitenden Mittelwerten liegen, zeigt, dass die gewählte Gruppierung
von Altersjahren ein korrektes Bild wiedergibt. SA: Standardabweichung, beträgt in der untersuchten Population 4.8 Punkte.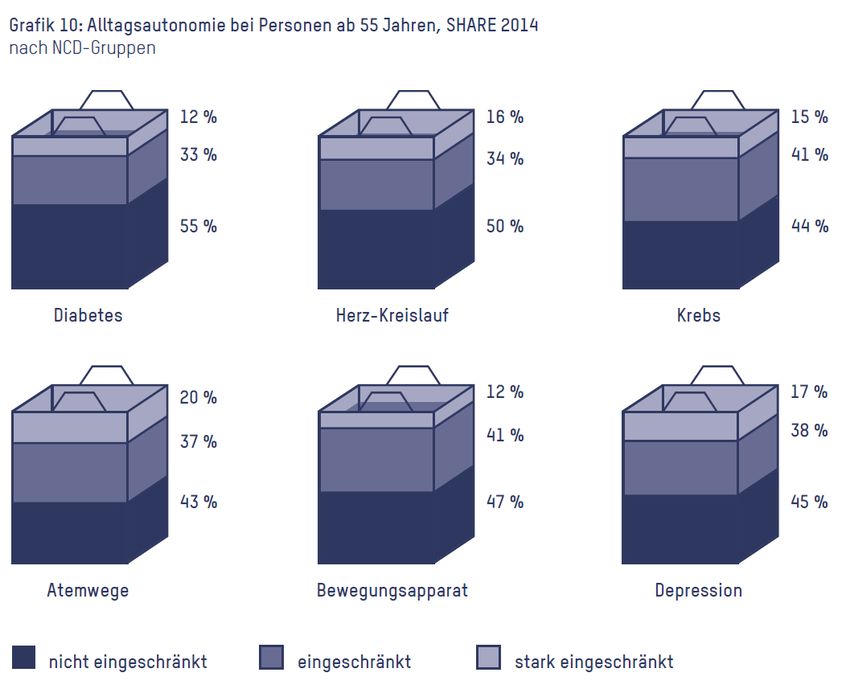
4

FOPH-Report: Autonomy in everyday life with NCD

 Auswertung Höglinger et al. 2019, Visualisierung BAG
5

FOPH-Report: Social activities

  Auswertung Höglinger et al. 2019, Visualisierung BAG
6

FOPH-Report: Quality of life by social groups

       Anteilsschätzer mit 95%-Konfidenzintervall, adjustiert auf Geschlecht und Alter. SA: Standardabweichung, beträgt in der untersuchten Population 4.8 Punkte.
       * Wert weicht statistisch signifikant auf dem 5%-Niveau vom Mittelwert aller Befragten ab.
7
FOPH-Report: Autonomy in everyday life after NCD-diagnosis
Veränderung der Alltagsautonomie nach NCD Diagnose. Panel-fixed-effects Schätzer, adjustiert
für Alter und andere NCDs.
Fixed-Effects-Schätzer mit 95%-Konfidenz¬intervall. Sämtliche zeit-invarianten Individualmerkmale sind kontrolliert, zusätzlich adjustiert für Alter und andere NCDs. SA:
Standardabweichung, beträgt in der untersuchten Population 4.8 Punkte.8 «Social factors» and the consequences of suffering from a chronic condition on patients − Socio-economic background, education, and social integration of the patient, so-called “social determinants of health”, have been shown to influence the risk of suffering from a chronic condition such as diabetes out of various reasons: − unhealthy lifestyle − poor working and living conditions − limited access to health care etc. (e.g. Cockerham et al. 2017) − But social factors not only affect the risk of developing a chronic condition; they also influence how patients cope with their affliction, and how much formal and informal support they receive (e.g. Höfelmann et al. 2017). − Consequences of chronic conditions on persons’ lives, on their perceived quality of life and autonomy are, hence, moderated by their material resources, cultural capital and social integration. − Previous research indicates that quality of life impairment caused by chronic conditions differs between socioeconomic groups (Galenkamp 2019)
9

Consequences on patients’ health state and everyday life

− Poor disease management increases the prevalence of comorbidities and disabilities in
  mobility, ADL and IADL (Bourdel-Marchasson et al. 1997)
− This may impair patient’s autonomy and their health-related quality of life (Brown et al. 2000 &
  Ose et al. 2011 & Redekop et al. 2002)
− Those living alone may suffer disproportionately from disease-related complications such as
  isolation due to treatment (Bourdel-Marchasson et al. 2007).
− Diabetes patients in a high socioeconomic bracket may able to manage their disease better
  than those with a low-income, poor educational background (Larsson, 1999)
− Good disease management can be obtained with structured treatment programmes and by tar
  geting vulnerable subgroups such as those with lower level educational background and
  with unbalanced diabetes (Ose et al. 2011 & Wayne et al. 2015)
10

Research questions

− How much are effects of chronic conditions on patients health state and on their daily lives
  moderated by social factors such as income, education and social integration?

− Our strategy to answer this is by comparing changes in relevant patient outcomes after the
  diagnosis of a chronic condition between different socio-economic groups.
11
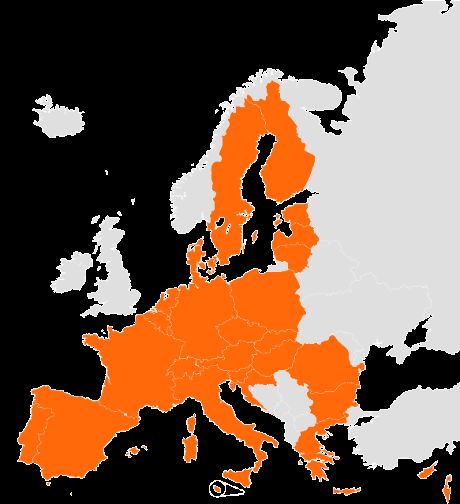
Data: Survey of Health, Ageing, and Retirement in Europe
Interdisciplinary study NCDs Sample
− Thematically broad survey of − Deceases are self-reported All countries participating in the first 6
the older population (here: 55+) using the following question: SHARE waves: Austria, Belgium,
Denmark, France, Germany, Italy, the
− Contextualization of health “Has a doctor told you that you Netherlands, Spain, Sweden and
suffer from …[long list of Switzerland
− Various patient-centered NCDs]” Limitations
outcomes such as quality of life
or autonomy − Very limited information on
Panel / Longitudinal Design deceased person (e.g., no
− Bi-annual waves since 2004 analyses of heterogeneous
Socio-economic resources mortality).
− Health trajectories over a
period of up to 10 years − Individuals with very bad health
not able/willing to participate (⇒
− E.g., analyses of quality of life bias toward good health).
before, at the onset and during
the course of a disease
Social
situation Health12
Outcomes: subjective health, grip strength, strong pains
Good perceived health (SF-36, Ware and Severe pains – Item from the Brief Pain
Gandek 1998) Inventory (Cleeland & Ryan, 1991; 1994).
− Good, very good, or excellent health vs. fair
or poor health
Grip strength (Andersen-Ranberg et al. 2009)
Predictor of disability, morbidity, frailty and
mortality. Measured with a handheld
dynamometer. We use the maximum value of
the grip strength measurements of both hands.13
Outcomes: Severe limitations (GALI), quality of life (CASP), social
participation
Quality of life (CASP, Hyde et al. 2003) Severe limitations in activities of daily living
− index consisting of four subscales: control, (GALI, Robine & Jagger 2003)
autonomy, self-realization and pleasure
Social Participation – Took part in at least
one of the following activities last year:
- voluntary or charity work
- attended an educational or training course
- gone to a sport, social or other kind of club14 Trajectories in «Severe pains» after NCD-diagnosis Fixed-Effects-Estimates with 95%-CI. All time-invariant individual characteristics are controlled for. Adjusted for age and survey-year. Considered time-windows: 10 years before to 11 years after diagnosis.
15

Trajectories in «Grip strength» after NCD-diagnosis

  Fixed-Effects-Estimates with 95%-CI. All time-invariant individual characteristics are controlled for. Adjusted for age and survey-year.
  Considered time-windows: 10 years before to 11 years after diagnosis.
16

Trajectories in «Severe limitations (GALI)» after NCD-diagnosis

  Fixed-Effects-Estimates with 95%-CI. All time-invariant individual characteristics are controlled for. Adjusted for age and survey-year.
  Considered time-windows: 10 years before to 11 years after diagnosis.
17

Trajectories in «Quality of life» after NCD-diagnosis

  Fixed-Effects-Estimates with 95%-CI. All time-invariant individual characteristics are controlled for. Adjusted for age and survey-year.
  Considered time-windows: 10 years before to 11 years after diagnosis.
18

Trajectories in «Social participation» after NCD-diagnosis

  Fixed-Effects-Estimates with 95%-CI. All time-invariant individual characteristics are controlled for. Adjusted for age and survey-year.
  Considered time-windows: 10 years before to 11 years after diagnosis.
19

Trajectories in «Good perceived health» after NCD-diagnosis

  Fixed-Effects-Estimates with 95%-CI. All time-invariant individual characteristics are controlled for. Adjusted for age and survey-year.
  Considered time-windows: 10 years before to 11 years after diagnosis.
20

Changes in outcomes after NCD-diagnosis

  Fixed-Effects-Estimates with 95%-CI. All time-invariant individual characteristics are controlled for. Adjusted for age and survey-year.
  Considered time-windows: 1 to 10 years before diagnosis vs. 0 to 11 years after diagnosis.
21

Baseline differences prior to NCD-diagnosis

  Random-Effects-Estimates with 95%-CI. Adjusted for age, gender, and survey-year.
22

Baseline differences prior to NCD-diagnosis

  Random-Effects-Estimates with 95%-CI. Adjusted for age, gender, and survey-year.
23

Baseline differences prior to NCD-diagnosis

  Random-Effects-Estimates with 95%-CI. Adjusted for age, gender, and survey-year.
24

Baseline differences prior to NCD-diagnosis

  Random-Effects-Estimates with 95%-CI. Adjusted for age, gender, and survey-year.
25

Baseline differences prior to NCD-diagnosis

  Random-Effects-Estimates with 95%-CI. Adjusted for age, gender, and survey-year.
26

Change in outcomes after NCD-diagnosis by social groups

  Fixed-Effects-Estimates with 95%-CI. All time-invariant individual characteristics are controlled for. Adjusted for age and survey-year.
  Considered time-windows: 1 to 10 years before diagnosis vs. 0 to 11 years after diagnosis.
27

Change in outcomes after NCD-diagnosis by social groups

  Fixed-Effects-Estimates with 95%-CI. All time-invariant individual characteristics are controlled for. Adjusted for age and survey-year.
  Considered time-windows: 1 to 10 years before diagnosis vs. 0 to 11 years after diagnosis.
28

Change in outcomes after NCD-diagnosis by social groups

  Fixed-Effects-Estimates with 95%-CI. All time-invariant individual characteristics are controlled for. Adjusted for age and survey-year.
  Considered time-windows: 1 to 10 years before diagnosis vs. 0 to 11 years after diagnosis.
29

Change in outcomes after NCD-diagnosis by social groups

  Fixed-Effects-Estimates with 95%-CI. All time-invariant individual characteristics are controlled for. Adjusted for age and survey-year.
  Considered time-windows: 1 to 10 years before diagnosis vs. 0 to 11 years after diagnosis.
30

Change in outcomes after NCD-diagnosis by social groups

  Fixed-Effects-Estimates with 95%-CI. All time-invariant individual characteristics are controlled for. Adjusted for age and survey-year.
  Considered time-windows: 1 to 10 years before diagnosis vs. 0 to 11 years after diagnosis.
31

Change in outcomes after NCD-diagnosis by social groups

  Fixed-Effects-Estimates with 95%-CI. All time-invariant individual characteristics are controlled for. Adjusted for age and survey-year.
  Considered time-windows: 1 to 10 years before diagnosis vs. 0 to 11 years after diagnosis.
32

Conclusions

− Various cues, but no very consistent pattern for worse outcomes after NCD diagnosis for
  patients with a disadvantaged socio-economic background.
− Education matters: patients with lower educational level show the most consistent pattern of
  worse outcomes regarding various dimensions.
− However, differences seem to be small in size (to be discussed…).

− Question to discuss/explore further:
  − What outcome measures are the most relevant? Other relevant outcomes?
  − Methodological issues: (self-reported) diagnosis vs. onset of a disease. Impact on our results?
  − Sample selection: severely ill patients have high drop-out probability
  − Modelling issues: model comparing mean value 1-10 years before to 0-11 years after diagnosis suitable?
    Limitations?
  − Selection of countries?
References Bourdel-Marchasson I, Dubroca B, Manciet G, Decamps A, Emeriau JP, Dartigues JF. Prevalence of diabetes and effect on quality of life in older French living in the community: the PAQUID Epidemiological Survey. J Am Geriatr Soc 1997;45:295-301. Bourdel-Marchasson, I., Helmer, C., Fagot-Campagna, A., Dehail, P., & Joseph, P. A. (2007). Disability and quality of life in elderly people with diabetes. Diabetes & metabolism, 33, S66-S74. Brown, G. C., Brown, M. M., Sharma, S., Brown, H., Gozum, M., & Denton, P. (2000). Quality of life associated with diabetes mellitus in an adult population. Journal of Diabetes and its Complications, 14(1), 18-24. Cockerham, W. C., Hamby, B. W., & Oates, G. R. (2017). The Social Determinants of Chronic Disease. American Journal of Preventive Medicine, 52(1, Supplement 1), S5-S12. doi:https://doi.org/10.1016/j.amepre.2016.09.010 Höfelmann, D. A., Gonzalez-Chica, D. A., Peres, K. G., Boing, A. F., & Peres, M. A. (2017). Chronic diseases and socioeconomic inequalities in quality of life among Brazilian adults: findings from a population-based study in Southern Brazil. European Journal of Public Health, 28(4), 603-610. doi:10.1093/eurpub/ckx224 Höglinger, M., Seiler, S., Ehrler, F., & Maurer, J. (2019). Gesundheit der älteren Bevölkerung in der Schweiz. Eine Studie basierend auf Daten des Survey of Health, Ageing and Retirement (SHARE) im Auftrag des Bundesamts für Gesundheit. Winterthur und Lausanne: https://digitalcollection.zhaw.ch/handle/11475/17131 Hyde, M., Wiggins, R. D., Higgs, P., & Blane, D. B. (2003). A measure of quality of life in early old age: the theory, development and properties of a needs satisfaction model (CASP-19). Aging & mental health, 7(3), 186-194. Kaiser, A., Vollenweider, P., Waeber, G., & Marques‐Vidal, P. (2012). Prevalence, awareness and treatment of type 2 diabetes mellitus in Switzerland: the CoLaus study. Diabetic medicine, 29(2), 190-197 Larsson, D., Lager, I., & Nilsson, P. M. (1999). Socio-economic characteristics and quality of life in diabetes mellitus-relation to metabolic control. Scandinavian Journal of Public Health, 27(2), 101-105. Leopold, L., & Engelhartdt, H. (2013). Education and physical health trajectories in old age. Evidence from the Survey of Health, Ageing and Retirement in Europe (SHARE). International Journal of Public Health, 58(1), 23-31. doi:10.1007/s00038-012-0399-0 Martin, M., Jäncke, L., Röcke, C., Schelling, H. R., von Wartburg, L., Duetz, M., . . . Fluri, K. (2016). Gesund altern in der Schweiz. Retrieved from Moreau-Gruet, F. (2013). La multimorbidité chez les personnes de 50 ans et plus. Résultats basés sur l’enquête SHARE (Survey of Health, Ageing and Retirement in Europe Retrieved from OBSAN. (2020) Swiss Health Observatorium. Diabetes (Alter: 15 +). Retrived from https://www.obsan.admin.ch/de/indikatoren/MonAM/diabetes-alter-15 Ose, D., Miksch, A., Urban, E., Natanzon, I., Szecsenyi, J., Kunz, C. U., & Freund, T. (2011). Health related quality of life and comorbidity. A descriptive analysis comparing EQ-5D dimensions of patients in the German disease management program for type 2 diabetes and patients in routine care. BMC Health Services Research, 11(1), 179. Redekop, W. K., Koopmanschap, M. A., Stolk, R. P., Rutten, G. E., Wolffenbuttel, B. H., & Niessen, L. W. (2002). Health-related quality of life and treatment satisfaction in Dutch patients with type 2 diabetes. Diabetes care, 25(3), 458-463. Robine, J. M., & Jagger, C. (2003). Creating a coherent set of indicators to monitor health across Europe. The European Journal of Public Health, 13(1), 6-14. Stolz, E., Mayerl, H., Waxenegger, A., Rásky, É., & Freidl, W. (2017). Impact of socioeconomic position on frailty trajectories in 10 European countries: evidence from the Survey of Health, Ageing and Retirement in Europe (2004–2013). Journal of Epidemiology and Community Health, 71(1), 73-80. doi:10.1136/jech-2016-207712 Walkden, G. J., Anderson, E. L., Vink, M. P., Tilling, K., Howe, L. D., & Ben-Shlomo, Y. (2018). Frailty in older-age European migrants: Cross-sectional and longitudinal analyses of the Survey of Health, Aging and Retirement in Europe (SHARE). Social Science & Medicine, 213, 1-11. doi:https://doi.org/10.1016/j.socscimed.2018.07.033 Höglinger Trajectories after NCD-Diagnosis 33
You can also read