STATE OF THE CLIMATE IN 2019 - REGIONAL CLIMATES P. Bissolli, C. Ganter, T. Li, A. Mekonnen, and A. Sánchez-Lugo, Eds - American ...
←
→
Page content transcription
If your browser does not render page correctly, please read the page content below
STATE OF THE CLIMATE IN 2019
              REGIONAL CLIMATES
              P. Bissolli, C. Ganter, T. Li, A. Mekonnen, and A. Sánchez-Lugo, Eds.

                                                                                                                                                                   Downloaded from http://journals.ametsoc.org/bams/article-pdf/101/8/S321/4988913/2020bamsstateoftheclimate_chapter7.pdf by guest on 20 August 2020

Special Online Supplement to the Bulletin of the American Meteorological Society, Vol.101, No. 8, August, 2020

https://doi.org/10.1175/2020BAMSStateoftheClimate_Chapter7.1
Corresponding authors:
North America: Ahira Sánchez-Lugo / Ahira.Sanchez-Lugo@noaa.gov.
Central America and the Caribbean: Ahira Sánchez-Lugo / Ahira.Sanchez-Lugo@noaa.gov
South America: Ahira Sánchez-Lugo / Ahira.Sanchez-Lugo@noaa.gov
Africa: Ademe Mekonnen / amekonne@ncat.edu
Europe: Peter Bissolli / Peter.Bissolli@dwd.de
Asia: Tim Li / timli@hawaii.edu
Oceania: Catherine Ganter / Catherine.Ganter@bom.gov.au
©2020 American Meteorological Society
For information regarding reuse of this content and general copyright information, consult the AMS Copyright Policy.

                 AU G U S T 2 0 2 0 | S t a t e o f t h e C l i m a t e i n 2 0 1 9                                    7 . R E G I O N A L C L I M AT E S   S321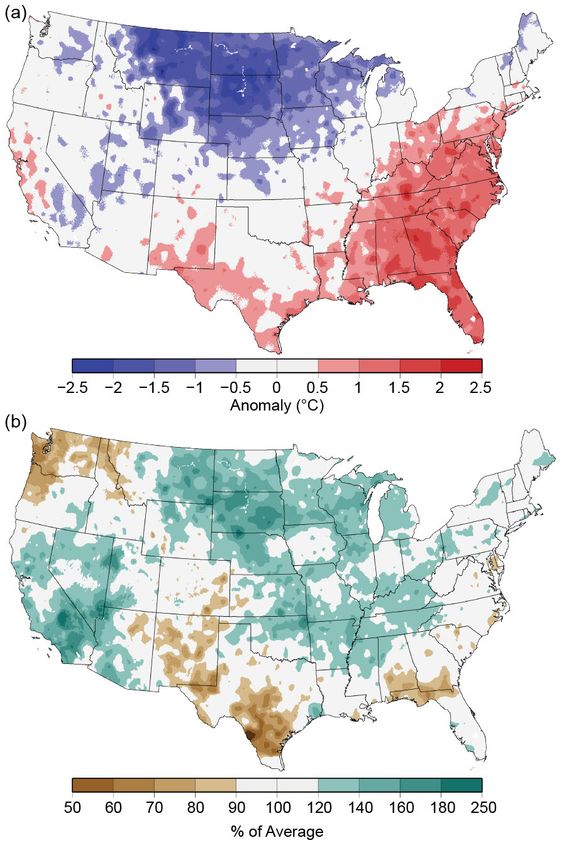
STATE OF THE CLIMATE IN 2019
                                                    Regional Climates
                                                                        Editors

                                                                     Jessica Blunden
                                                                      Derek S. Arndt

                                                                                                                                   Downloaded from http://journals.ametsoc.org/bams/article-pdf/101/8/S321/4988913/2020bamsstateoftheclimate_chapter7.pdf by guest on 20 August 2020
                                                                 Chapter Editors

                                                                Peter Bissolli
                                                            Howard J. Diamond
                                                        Matthew L. Druckenmiller
                                                             Robert J. H. Dunn
                                                             Catherine Ganter
                                                              Nadine Gobron
                                                               Rick Lumpkin
                                                       Jacqueline A. Richter-Menge
                                                                   Tim Li
                                                            Ademe Mekonnen
                                                           Ahira Sánchez-Lugo
                                                              Ted A. Scambos
                                                             Carl J. Schreck III
                                                           Sharon Stammerjohn
                                                            Diane M. Stanitski
                                                              Kate M. Willett

                                                                 Technical Editor

                                                                 Andrea Andersen

                                                 BAMS Special Editor for Climate

                                                                     Richard Rosen

                                                American Meteorological Society

AU G U S T 2 0 2 0 | S t a t e o f t h e C l i m a t e i n 2 0 1 9                     7 . R E G I O N A L C L I M AT E S   S322
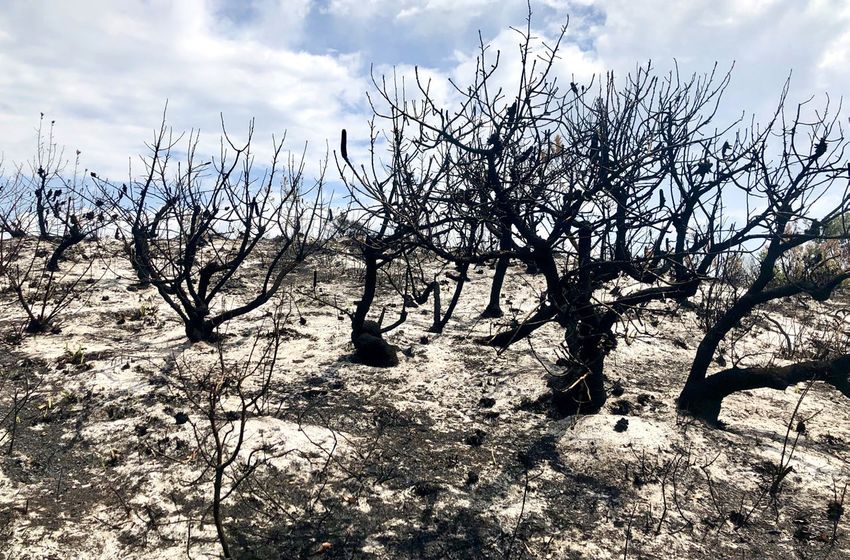
Cover credit:
Front: © Lynnebeclu/Royalty-free/iStock / Getty Images Plus
Horizontal landscape of burnt, scorched and blackened coastal forest trees and ash-scattered
sandy ground after bushfires ravaged the coastal landscape near Yamba, New South Wales
Australia in 2019.

                                                                                                                              Downloaded from http://journals.ametsoc.org/bams/article-pdf/101/8/S321/4988913/2020bamsstateoftheclimate_chapter7.pdf by guest on 20 August 2020
Regional Climates is one chapter from the State of the Climate in 2019 annual report. Compiled
by NOAA’s National Centers for Environmental Information, State of the Climate in 2019 is
based on contributions from scientists from around the world. It provides a detailed update on
global climate indicators, notable weather events, and other data collected by environmental
monitoring stations and instruments located on land, water, ice, and in space. The full report is
available from https://doi.org/10.1175/2020BAMSStateoftheClimate.1.

How to cite this document:

Citing the complete report:
Blunden, J. and D. S. Arndt, Eds., 2020: State of the Climate in 2019. Bull. Amer. Meteor. Soc.,
101 (8), Si–S429, https://doi.org/10.1175/2020BAMSStateoftheClimate.1.

Citing this chapter:
Bissolli, P., C. Ganter, T. Li, A. Mekonnen, and A. Sánchez-Lugo, Eds., 2020: Regional Climates
[in “State of the Climate in 2019"]. Bull. Amer. Meteor. Soc., 101 (8), S321–S420,
https://doi.org/10.1175/2020BAMSStateoftheClimate_Chapter7.1.

Citing a section (example):
Amador, J. A., H. G. Hidalgo, E. J. Alfaro, B. Calderón, and N. Mora, 2020: Central America [in
“State of the Climate in 2019"]. Bull. Amer. Meteor. Soc., 101 (8), S338–S339,
https://doi.org/10.1175/2020BAMSStateoftheClimate_Chapter7.1.

  AU G U S T 2 0 2 0 | S t a t e o f t h e C l i m a t e i n 2 0 1 9              7 . R E G I O N A L C L I M AT E S   S323
Editor and Author Affiliations (alphabetical by name)
Abida, Abdallah, Agence Nationale de l’Aviation Civile et de la Météorologie          Fenimore, Chris, NOAA/NESDIS National Centers for Environmental
    de l’Union des Comores, Moroni, Comoros                                                Information, Asheville, North Carolina
Aldeco, Laura S., Servicio Meteorológico Nacional, Buenos Aires, Argentina            Francis, S. D., National Weather Forecasting and Climate Research Centre,
Alfaro, Eric J., Center for Geophysical Research and School of Physics,                    Nigerian Meteorological Agency, Abuja, Nigeria
    University of Costa Rica, San José, Costa Rica                                    Ganter, Catherine, Bureau of Meteorology, Melbourne, Victoria, Australia
Alves, Lincoln M., Centro de Ciencia do Sistema Terrestre/Instituto Nacional de       Gleason, Karin, NOAA/NESDIS National Centers for Environmental Information,
    Pesquisas Espaciais, São Paulo, Brazil                                                 Asheville, North Carolina
Amador, Jorge A., Center for Geophysical Research and School of Physics,              Guard, Charles “Chip” P., Tropical Weather Sciences, Sinajana, Guam
    University of Costa Rica, San José, Costa Rica                                    Gustari, Indra, Climate Variability Analysis Division, Center for Climate Change
Andrade, B., Seychelles Meteorological Authority, Mahe, Seychelles                         Information, BMKG, Indonesia
Baez, Julian, Universidad Católica Nuestra Senora de la Asunción, Asunción,           Hagos, S., Atmospheric Sciences and Global Change Division, Pacific Northwest
    Paraguay                                                                               National Laboratory, Richland, Washington
Bardin, M. Yu., Yu. A. Izrael Institute of Global Climate and Ecology,                Heim, Jr., Richard R., NOAA/NESDIS National Centers for Environmental

                                                                                                                                                                            Downloaded from http://journals.ametsoc.org/bams/article-pdf/101/8/S321/4988913/2020bamsstateoftheclimate_chapter7.pdf by guest on 20 August 2020
    and Institute of Geography, Russian Academy of Sciences, Moscow,                       Information, Asheville, North Carolina
    Russia                                                                            Hernández, Rafael, Instituto Nacional de Meteorología e Hidrología de
Bekele, Endalkachew, NOAA/NWS Climate Prediction Center, College Park,                     Venezuela (INAMEH), Caracas, Venezuela
    Maryland                                                                          Hidalgo, Hugo G., Center for Geophysical Research and School of Physics,
Bissolli, Peter, Deutscher Wetterdienst, WMO RA VI Regional Climate Centre                 University of Costa Rica, San José, Costa Rica
    Network, Offenbach, Germany                                                       Ijampy, J. A., Nigerian Meteorological Agency, Abuja, Nigeria
Broedel, Eric, Centro Nacional de Monitoramento e Alertas de Desastres                Joseph, Annie C., Dominica Meteorological Service, Canefield Airport,
    Naturais CEMADEN, São Paulo, Brazil                                                    Canefield, Dominica
Bukunt, Brandon, NOAA/NWS Weather Forecast Office, Guam                               Jumaux, Guillaume, Météo France, Direction Interrégionale pour l’Océan
Calderón, Blanca, Center for Geophysical Research, University of Costa Rica,               Indien, Réunion
    San José, Costa Rica                                                              Kabidi, Khadija, Direction de la Météorologie Nationale Maroc, Rabat, Morocco
Campbell, Jayaka D., Department of Physics, The University of the West Indies,        Kaiser, Johannes W., Deutscher Wetterdienst, Satellite-Based Climate
    Jamaica                                                                                Monitoring Division, Offenbach, Germany
Campos Diaz, Diego A., Dirección Meteorológica de Chile, Santiago de Chile,           Kamsu-Tamo, Pierre-Honore, NOAA/NWS Climate Prediction Center, College
    Chile                                                                                  Park, Maryland
Carvajal, Gilma, Instituto Nacional de Meteorología e Hidrología de Ecuador           Kennedy, John, Met Office Hadley Centre, Exeter, United Kingdom
    (INAMHI), Quito, Ecuador                                                          Khan, Valentina, Hydrometcenter of Russia, WMO North EurAsia Climate
Chandler, Elise, Bureau of Meteorology, Melbourne, Victoria, Australia                     Center, Moscow, Russia
Cheng, Vincent. Y. S., Environment and Climate Change Canada, Toronto,                Khiem, Mai Van, Viet Nam National Center of Hydro-Meteorology Forecasting,
    Ontario, Canada                                                                        Viet Nam Meteorology Hydrology Administration, Ha Noi, Viet Nam
Choi, Chulwoon, Climate Prediction Division, Korea Meteorological                     Kokosadze, Khatuna, National Environmental Agency, Tbilisi, Georgia
    Administration, South Korea                                                       Korshunova, Natalia N., All-Russian Research Institute of Hydrometeorological
Clarke, Leonardo A., Department of Physics, The University of the West Indies,             Information - World Data Center, Obninsk, Russia
    Jamaica                                                                           Kruger Andries C., South African Weather Service, Pretoria, South Africa
Correa, Kris, Servicio Nacional de Meteorología e Hidrología del Perú, Lima,          Kutaladze, Nato, National Environmental Agency, Tbilisi, Georgia
    Perú                                                                              Labbé, L., Météo France, Direction Interrégionale pour l’Océan Indien, Réunion
Costa, Felipe, Centro Internacional para la Investigación del Fenómeno El Niño        Lakatos, Mónika, Climatology Unit, Hungarian Meteorological Service,
    (CIIFEN), Guayaquil, Ecuador                                                           Budapest, Hungary
Cunha, A. P., Centro Nacional de Monitoramento e Alertas de Desastres                 Lam, Hoang Phuc, Viet Nam National Center of Hydro-Meteorology
    Naturais CEMADEN, São Paulo, Brazil                                                    Forecasting, Viet Nam Meteorology Hydrology Administration, Ha Noi, Viet
Demircan, Mesut, Turkish State Meteorological Service, Ankara, Turkey                      Nam
Dhurmea, R., Mauritius Meteorological Service, Vacoas, Mauritius                      Lander, Mark A., University of Guam, Mangilao, Guam
Díaz, Eliecer A., Instituto de Hidrología de Meteorología y Estudios                  Lavado-Casimiro, Waldo, Servicio Nacional de Meteorología e Hidrología del
    Ambientales de Colombia (IDEAM), Bogotá, Colombia                                      Perú, Lima, Perú
ElKharrim, M., Direction de la Météorologie Nationale Maroc, Rabat, Morocco           Lee, T. C., Hong Kong Observatory, Hong Kong, China
Enyew, Bantwale D., Department of Physics, North Carolina A & T State                 Leung, Kinson H. Y., Environment and Climate Change Canada, Toronto,
    University, Greensboro, North Carolina                                                 Ontario, Canada
Espinoza, Jhan C., Instituto Geofisico del Perú, Lima, Perú, and Université           Li, Tim, Department of Atmospheric Sciences, University of Hawai’i, Honolulu,
    Grenoble Alpes, Grenoble, France                                                       Hawai’i, USA
Fazl-Kazem, Amin, National Center for Drought Monitoring and Crisis                   Magee, Andrew D., Centre for Water, Climate and Land, School of
    Management, Islamic Republic of Iranian Meteorological Organization,                   Environmental and Life Sciences, University of Newcastle, Callaghan, NSW,
    Tehran, Iran                                                                           Australia
Fedaeff, Nava, National Institute of Water and Atmospheric Research, Ltd.             Mamen, Jostein, Climate Division, Norwegian Meteorological Institute, Oslo,
    (NIWA), Auckland, New Zealand                                                          Norway
Feng, Z., Atmospheric Sciences and Global Change Division, Pacific Northwest          Marengo, José A., Centro Nacional de Monitoramento e Alertas aos Desastres
    National Laboratory, Richland, Washington                                              Naturais, Cachoeira Paulista, São Paulo, Brazil
                                                                                      Marín, Dora, Servicio Nacional de Meteorología e Hidrología (SENAMHI), Lima,
                                                                                           Perú

                 AU G U S T 2 0 2 0 | S t a t e o f t h e C l i m a t e i n 2 0 1 9                                             7 . R E G I O N A L C L I M AT E S   S324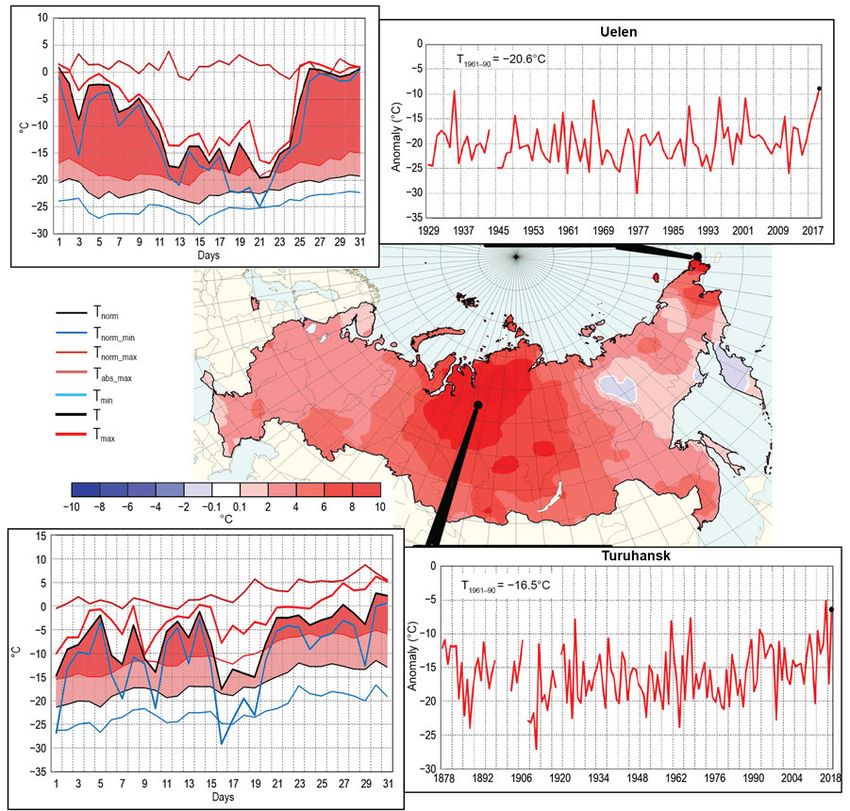
McBride, Charlotte, South African Weather Service, Pretoria, South Africa             Sayouri, Amal, Direction de la Météorologie Nationale Maroc, Rabat, Morocco
Megrelidze, Lia, National Environmental Agency, Tbilisi, Georgia                      Schreck III, Carl J., North Carolina State University, Cooperative Institute for
Mekonnen, Ademe, Department of Physics, North Carolina A & T State                        Climate and Satellites – North Carolina (CICS-NC), Asheville, North Carolina
    University, Greensboro, North Carolina                                            Sensoy, Serhat, Turkish State Meteorological Service, Ankara, Turkey
Misevicius, Noelia, Instituto Uruguayo de Meteorología, Montevideo, Uruguay           Shimpo, A., Tokyo Climate Center, Japan Meteorological Agency, Tokyo, Japan
Mochizuki, Y., Tokyo Climate Center, Japan Meteorological Agency, Japan               Sima, Fatou, Division of Meteorology, Department of Water Resources, Banjul,
Moise, Aurel, Centre for Climate Research Singapore, Meteorological Service,              The Gambia
    Singapore                                                                         Smith, Adam, NOAA/NESDIS National Centers for Environmental Information,
Molina-Carpio, Jorge, Universidad Mayor de San Andrés, La Paz, Bolivia                    Asheville, North Carolina
Mora, Natali, Center for Geophysical Research and School of Physics, University       Spence, Jacqueline, Meteorological Service, Kingston, Jamaica
    of Costa Rica, San José, Costa Rica                                               Spillane, Sandra, Met Éireann, Irish Meteorological Service, Dublin, Ireland
Mostafa, Awatif E., Department of Seasonal Forecast and Climate Research,             Spitzer, Arne, Deutscher Wetterdienst, Satellite-Based Climate Monitoring
    Cairo Numerical Weather Prediction, Egyptian Meteorological Authority,                Division, Offenbach, Germany

                                                                                                                                                                            Downloaded from http://journals.ametsoc.org/bams/article-pdf/101/8/S321/4988913/2020bamsstateoftheclimate_chapter7.pdf by guest on 20 August 2020
    Cairo, Egypt                                                                      Srivastava, A. K., India Meteorological Department, Pune, India
Nieto, Juan José, Centro Internacional para la Investigación del Fenómeno El          Stella, José L., Servicio Meteorológico Nacional, Buenos Aires, Argentina
    Niño (CIIFEN), Guayaquil, Ecuador                                                 Stephenson, Kimberly A., Department of Life Sciences, The University of the
Oyunjargal, Lamjav, National Agency for Meteorology, Hydrology and                        West Indies, Jamaica
    Environmental Monitoring, Ulaanbaatar, Mongolia                                   Stephenson, Tannecia S., Department of Physics, The University of the West
Pascual Ramírez, Reynaldo, National Meteorological Service of Mexico,                     Indies, Jamaica
    Mexico                                                                            Taylor, Michael A., Department of Physics, The University of the West Indies,
Pastor Saavedra, Maria Asuncion, Agencia Estatal de Meteorología, Madrid,                 Jamaica
    Spain                                                                             Thiaw, Wassila, NOAA/NWS Climate Prediction Center, College Park, Maryland
Pfeifroth, Uwe, Deutscher Wetterdienst, Satellite-Based Climate Monitoring            Tobin, Skie, Bureau of Meteorology, Melbourne, Victoria, Australia
    Division, Offenbach, Germany                                                      Todey, Dennis, Agricultural Research Service, USDA Midwest Climate Hub,
Phillips, David, Environment and Climate Change Canada, Toronto, Ontario,                 Ames, Iowa
    Canada                                                                            Trachte, Katja, Brandenburg University of Technology (BTU), Cottbus, Germany
Rajeevan, Madhavan, Earth System Science Organization, Ministry of Earth              Trotman, Adrian R., Caribbean Institute for Meteorology and Hydrology,
    Sciences, New Delhi, India                                                            Bridgetown, Barbados
Ramos, Andrea M., Instituto Nacional de Meteorologia, Brasilia, Brazil                van der Schrier, Gerard, Royal Netherlands Meteorological Institute (KNMI),
Revadekar, Jayashree V., Indian Institute of Tropical Meteorology, Pune, India            De Bilt, Netherlands
Robjhon, Miliaritiana, NOAA/NWS Climate Prediction Center, College Park,              Van Meerbeeck, Cedric J., Caribbean Institute for Meteorology and Hydrology,
    Maryland                                                                              Bridgetown, Barbados
Rodriguez Camino, Ernesto, Agencia Estatal de Meteorología, Madrid, Spain             Vazifeh, Ahad, National Center for Drought Monitoring and Crisis Management,
Rodriguez Guisado, Esteban, Agencia Estatal de Meteorología, Madrid, Spain                Islamic Republic of Iranian Meteorological Organization, Tehran, Iran
Ronchail, Josyane, Université Paris Diderot/Laboratoire LOCEAN-IPSL, Paris,           Vicencio Veloso, José, Dirección Meteorológica de Chile, Santiago de Chile,
    France                                                                                Chile
Rösner, Benjamin, Laboratory for Climatology and Remote Sensing, Faculty of           Wang, Wei, Minhang Meteorological Bureau, Shanghai, China
    Geography, University of Marburg, Marburg, Germany                                Xin, Fei, Shanghai Climate Center, Shanghai, China
Salinas, Roberto, Dirección de Meteorología e Hidrología/Dirección Nacional de        Zhang, Peiqun, Beijing Climate Center, Beijing, China
    Aeronáutica Civil, Asunción, Paraguay                                             Zhu, Zhiwei, Nanjing University of Information Science and Technology, China
Sánchez-Lugo, Ahira, NOAA/NESDIS National Centers for Environmental                   Zucule, Jonas, Mozambique National Institute of Meteorology, Maputo,
    Information, Asheville, North Carolina                                                Mozambique

Editorial and Production Team
Andersen, Andrea, Technical Editor, Innovative Consulting Management                  Misch, Deborah J., Graphics Support, Innovative Consulting Management
    Services, LLC, NOAA/NESDIS National Centers for Environmental                         Services, LLC, NOAA/NESDIS National Centers for Environmental
    Information, Asheville, North Carolina                                                Information, Asheville, North Carolina
Griffin, Jessicca, Graphics Support, Cooperative Institute for Satellite Earth        Riddle, Deborah B., Graphics Support, NOAA/NESDIS National Centers for
    System Studies, North Carolina State University, Asheville, North Carolina            Environmental Information, Asheville, North Carolina
Hammer, Gregory, Content Team Lead, Communications and Outreach, NOAA/                Veasey, Sara W., Visual Communications Team Lead, Communications and
    NESDIS National Centers for Environmental Information, Asheville, North               Outreach, NOAA/NESDIS National Centers for Environmental Information,
    Carolina                                                                              Asheville, North Carolina
Love-Brotak, S. Elizabeth, Lead Graphics Production, NOAA/NESDIS National
    Centers for Environmental Information, Asheville, North Carolina

                 AU G U S T 2 0 2 0 | S t a t e o f t h e C l i m a t e i n 2 0 1 9                                             7 . R E G I O N A L C L I M AT E S   S325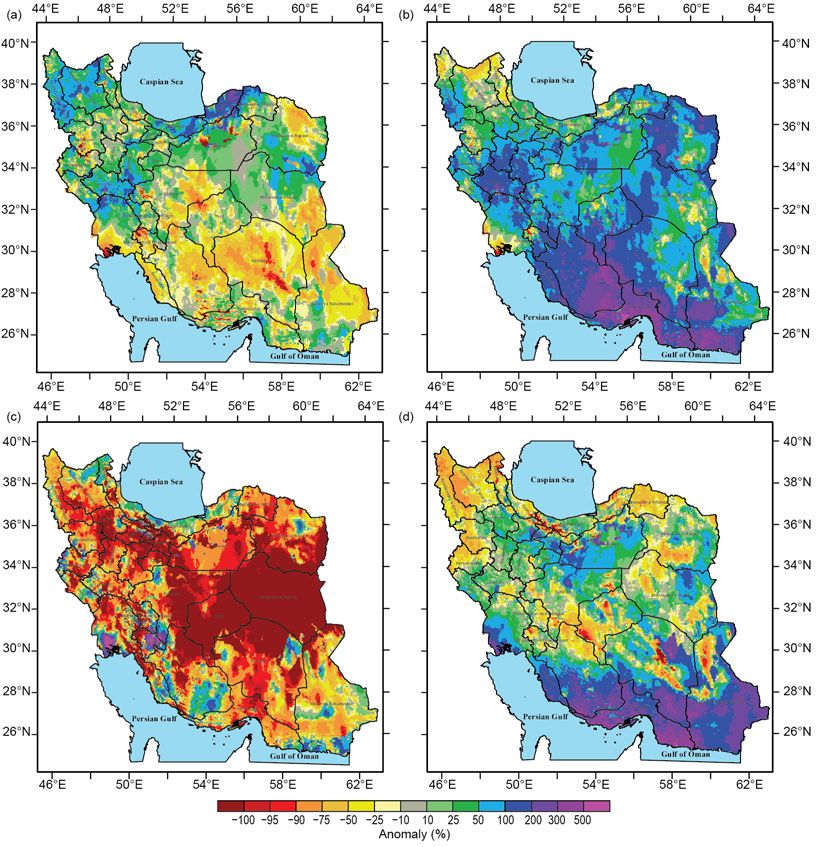
7. Table of Contents

List of authors and affiliations...................................................................................................S324
a. Overview ..................................................................................................................................S328
b. North America ........................................................................................................................S328
		 1. Canada ........................................................................................................................S328
		 2. United States...............................................................................................................S331
     Sidebar 7.1: Record wetness and the impact on U.S. Midwest/Plains
     agriculture growing season 2019........................................................................................S334

                                                                                                                                                                          Downloaded from http://journals.ametsoc.org/bams/article-pdf/101/8/S321/4988913/2020bamsstateoftheclimate_chapter7.pdf by guest on 20 August 2020
		 3. Mexico..........................................................................................................................S336
c. Central America and the Caribbean.......................................................................................S337
		 1. Central America..........................................................................................................S338
		 2. Caribbean................................................................................................................... S340
d. South America.........................................................................................................................S342
		 1. Northern South America............................................................................................S342
		 2. Central South America............................................................................................... S344
		 3. Southern South America............................................................................................ S346
     Sidebar 7.2: Fires in southern Amazonia in the dry season of 2019................................. S348
e. Africa........................................................................................................................................S350
		 1. North Africa.................................................................................................................S351
		 2. West Africa..................................................................................................................S353
		 3. East Africa....................................................................................................................S355
		 4. Southern Africa...........................................................................................................S357
		 5. Western Indian Ocean Island countries.....................................................................S358
     Sidebar 7.3: Record-breaking tropical cyclone landfalls
     in southeastern Africa..........................................................................................................S361
f. Europe and the Middle East....................................................................................................S363
		 1. Overview......................................................................................................................S363
		 2. Western Europe...........................................................................................................S366
		 3. Central Europe............................................................................................................S367
     Sidebar 7.4: Record June and July heat waves across western
     and central Europe...............................................................................................................S370
		 4. The Nordic and Baltic countries.................................................................................S373
		 5. Iberian Peninsula.........................................................................................................S375
		 6. Central Mediterranean region and Turkey................................................................S376
		 7. Eastern Europe............................................................................................................S378
		 8. Middle East................................................................................................................. S380
		 9. South Caucasus............................................................................................................S381
g. Asia...........................................................................................................................................S382
		 1. Overview......................................................................................................................S383
		 2. Russia...........................................................................................................................S386
		 3. East and Southeast Asia.............................................................................................S389
     Sidebar 7.5: An unusually cool summer in East Asia and a positive
     Indian Ocean dipole event...................................................................................................S391
		 4. South Asia....................................................................................................................S394
		 5. Southwest Asia............................................................................................................S397

   AU G U S T 2 0 2 0 | S t a t e o f t h e C l i m a t e i n 2 0 1 9                                                         7 . R E G I O N A L C L I M AT E S   S326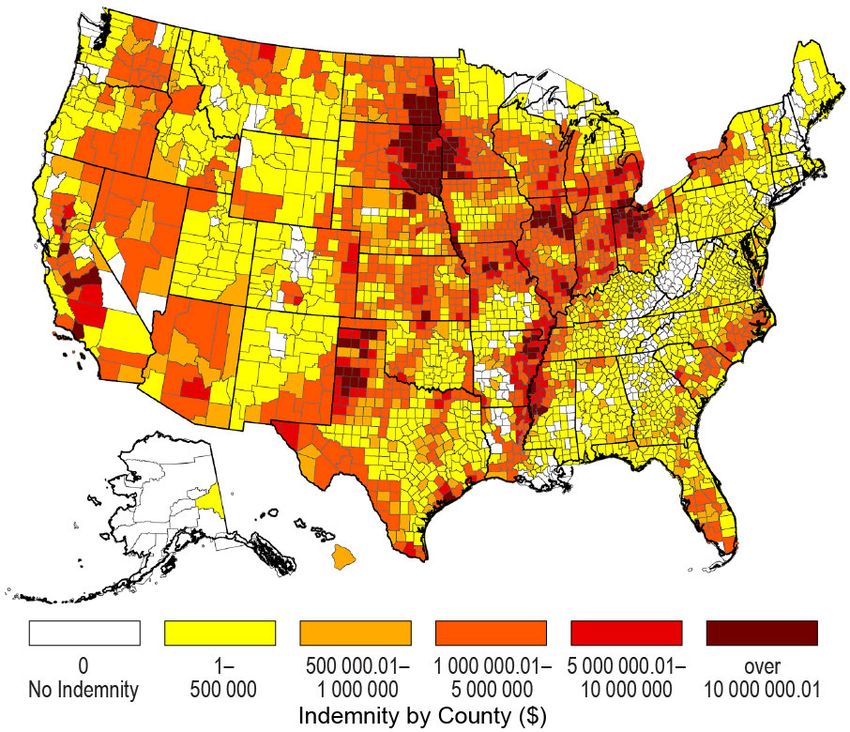
h. Oceania.....................................................................................................................................S399
		 1. Overview......................................................................................................................S399
		 2. Northwest Pacific and Micronesia............................................................................ S400
		 3. Southwest Pacific....................................................................................................... S402
		 4. Australia...................................................................................................................... S405
    Sidebar 7.6: An early start to an extreme bushfire season in Australia........................... S408
		 5. New Zealand................................................................................................................S410
Acknowledgments....................................................................................................................... S412
Appendix 1: Acronym List........................................................................................................... S413
Appendix 2: Supplemental Materials........................................................................................S414
References....................................................................................................................................S419

                                                                                                                                                                        Downloaded from http://journals.ametsoc.org/bams/article-pdf/101/8/S321/4988913/2020bamsstateoftheclimate_chapter7.pdf by guest on 20 August 2020
*Please refer to Chapter 8 (Relevant datasets and sources) for a list of all climate variables and
datasets used in this chapter for analyses, along with their websites for more information and
access to the data.

    AU G U S T 2 0 2 0 | S t a t e o f t h e C l i m a t e i n 2 0 1 9                                                      7 . R E G I O N A L C L I M AT E S   S327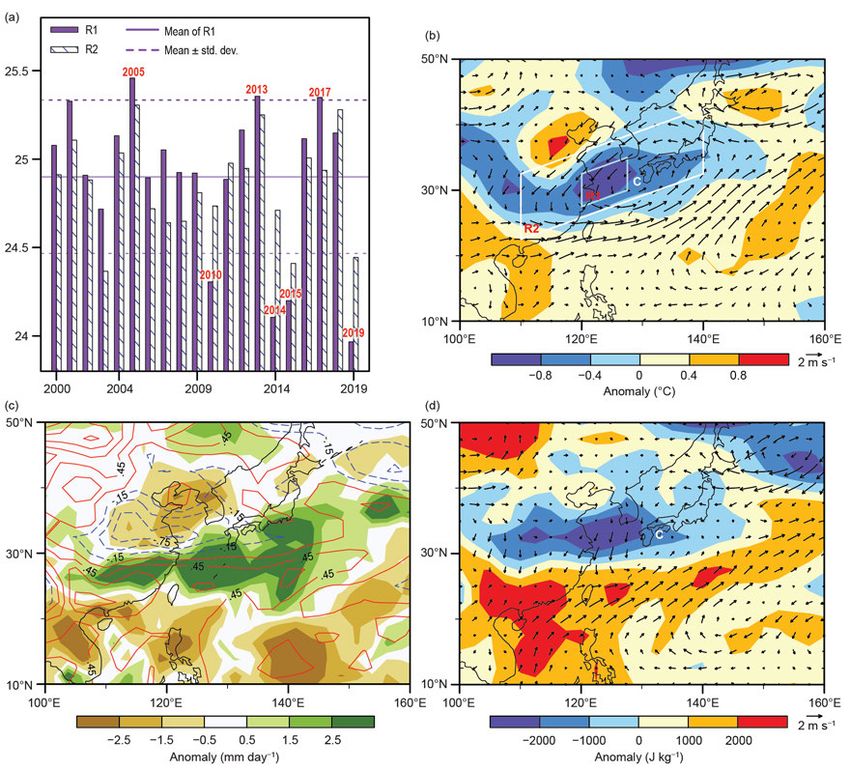
7. REGIONAL CLIMATES
P. Bissolli, C. Ganter, T. Li, A. Mekonnen, and A. Sánchez-Lugo, Eds.

a. Overview
   This chapter provides summaries of the 2019 temperature and precipitation conditions across
seven broad regions: North America, Central America and the Caribbean, South America, Africa,
Europe, Asia, and Oceania. In most cases, summaries of notable weather events are also included.

                                                                                                                               Downloaded from http://journals.ametsoc.org/bams/article-pdf/101/8/S321/4988913/2020bamsstateoftheclimate_chapter7.pdf by guest on 20 August 2020
Local scientists provided the annual summary for their respective regions and, unless otherwise
noted, the source of the data used is typically the agency affiliated with the authors. The primary
base period used for these analyses is 1981–2010. However, please note that on occasion different
nations, even within the same section, may use unique periods to define their normals. Section
introductions typically define the prevailing practices for that section, and exceptions will be
noted within the text. In a similar way, many contributing authors use languages other than
English as their primary professional language. To minimize additional loss of fidelity through
re-interpretation after translation, editors have been conservative and careful to preserve the voice
of the author. In some cases, this may result in abrupt transitions in style from section to section.

b. North America— A. Sánchez-Lugo, Ed.
   This section is divided into three subsections: Canada, the United States, and Mexico. Unless
otherwise noted, the reference period is 1981–2010. The meteorological seasons follow Northern
Hemisphere (NH) midlatitude conventions, such as December–February for winter, March–May
for spring.
   Above-average temperatures were present across much of northern Canada, the southeastern
and mid-Atlantic United States, and Mexico during 2019, while much of central North America
had near- to below-average temperatures. Canada observed its 15th warmest year, the United
States its 34th warmest, and Mexico its second warmest for their respective historical records.
The United States observed its second-wettest year on record, while Mexico experienced its 19th
driest. Notable events across the region include spring floods across parts of Canada and the
contiguous United States, Hurricane Dorian impacts on parts of the United States and Canada,
and the lack of tropical storms affecting southern Mexico.

1) Canada— K. H. Y. Leung, V. Y. S. Cheng, and D. Phillips
   In 2019, mean annual temperatures were above the 1981–2010 average across most of northern
Canada (north of 60°N) and below average over most of southern Canada (south of 60°N). The
mean temperatures were much higher than average in northwestern Canada during winter and
spring, and in northeastern Canada (closer to 80°N) during summer and autumn. The Canadian
Prairies consistently experienced below-average temperatures during all four seasons; portions
of northwestern Canada experienced below-average temperatures during summer as well.

   (I) TEMPERATURE
   The 2019 annual average temperature for Canada was 0.2°C above the 1981–2010 national
average and the 15th warmest year since nationwide records began in 1948 (Fig. 7.1). Four of the
10 warmest years have occurred during the last decade, with 2010 experiencing all-time record
warmth (+2.2°C). The national annual average temperature has increased 1.7°C over the past 72
years (updated from Vincent et al. 2015). Spatially, annual temperature departures above +1.5°C

   AU G U S T 2 0 2 0 | S t a t e o f t h e C l i m a t e i n 2 0 1 9              7 . R E G I O N A L C L I M AT E S   S328
were recorded in the north and
           northwest, whereas annual depar-
           tures below −1°C were experienced
           across Canada’s southern border
           from British Columbia’s interior
           eastward through to New Bruns-
           wick (Fig. 7.2). Three provinces/
           territories experienced an average
           annual temperature that ranked
           among their 10 highest since 1948:
           Yukon (third highest), Nunavut
           (fifth highest), and Northwest Ter-

                                                                                                                                       Downloaded from http://journals.ametsoc.org/bams/article-pdf/101/8/S321/4988913/2020bamsstateoftheclimate_chapter7.pdf by guest on 20 August 2020
           ritories (seventh highest).
              Winter 2018/19 was 0.1°C be-
           low average and the 44th coolest
           on record since nationwide re-
           cords began in 1948. The national     Fig. 7.1. Annual average temperature anomalies (°C; 1981–2010 base
           winter average temperature has        period) in Canada for 1948–2019. Red line is the 12-year running mean.
                                                 (Source: Environment and Climate Change Canada.)
           increased by 3.3°C over the past
           72 years. Winter anomalies more
           than +3.5°C above average were recorded in northwestern Canada, with the Northwest Territories
           having its 10th warmest winter on record. The remainder of the provinces experienced winter
           temperature anomalies more than −0.5°C below average.
              During spring, below-average temperatures were recorded from southeastern British Columbia
           eastward to the Atlantic provinces. Above-average temperatures were observed over northern
           Canada, with northwestern parts of Canada notably above average by more than 3.5°C. The na-
           tional average temperature for spring 2019 was 0.3°C above the 1981–2010 average and the 13th
                                                                               highest in the 72-year record.
                                                                               The national average spring
                                                                               temperature has increased
                                                                               by 1.7°C over the past 72
                                                                               years. Four provinces/terri-
                                                                               tories experienced an aver-
                                                                               age spring temperature that
                                                                               ranked among the 10 highest
                                                                               since 1948: Yukon (second
                                                                               highest), Northwest Territo-
                                                                               ries (third highest), Nunavut
                                                                               (fourth highest), and British
                                                                               Columbia (10th highest).
                                                                                  The national average tem-
                                                                               perature for summer 2019
                                                                               was 0.1°C above average and
                                                                               the 25th highest since 1948.
                                                                               Parts of Yukon and north-
Fig. 7.2. Annual average temperature anomalies (°C; 1981–2010 base pe- eastern Canada experienced
riod) in Canada for 2019. YK=Yukon; NT=Northwest Territories; NU=Nunavut;
                                                                               summer anomalies above
QC=Quebec; NL=Newfoundland and Labrador; PE=Prince Edward Island; NS=Nova
Scotia; NB=New Brunswick; ON=Ontario; MB=Manitoba; SK=Saskatchewan;
                                                                               +1°C, with Nunavut and Que-
AB=Alberta; and BC=British Columbia. (Source: Environment and Climate bec having their sixth- and
Change Canada.)                                                                10th-warmest summers on

            AU G U S T 2 0 2 0 | S t a t e o f t h e C l i m a t e i n 2 0 1 9             7 . R E G I O N A L C L I M AT E S   S329
record, respectively. In contrast, below-average summer temperatures were experienced in the
Northwest Territories, Alberta, Saskatchewan, and Labrador, with the Northwest Territories and
Alberta having their 8th- and 10th-coolest summer on record, respectively. The national average
summer temperature has increased by 1.4°C over the past 72 years.
   The national average temperature for autumn 2019 was 0.9°C above average and the 13th highest
since 1948. Above-average temperatures were experienced across northern Canada, with three
provinces/territories having autumn average temperatures among their 10 highest: Northwest
Territories (third highest), Nunavut (third highest), and Yukon (fifth highest). Conversely, autumn
anomalies of −1°C or lower were experienced along the southern border from southeastern Brit-
ish Columbia to Atlantic Canada. The national autumn temperature has increased by 1.7°C over
the past 72 years.

                                                                                                                              Downloaded from http://journals.ametsoc.org/bams/article-pdf/101/8/S321/4988913/2020bamsstateoftheclimate_chapter7.pdf by guest on 20 August 2020
   (II) PRECIPITATION
   Over the past decade, precipitation-monitoring technology has evolved, and Environment and
Climate Change Canada (ECCC) and its partners implemented a transition from manual observa-
tions to the use of automatic precipitation gauges. Extensive data integration is required to link
the current precipitation observations to the long-term historical manual observations. The update
and reporting of historical adjusted precipitation trends and variations will be on temporary hiatus
pending the extensive data reconciliation, and resumed thereafter. ECCC remains committed to
providing credible climate data to inform adaptation decision making, while ensuring the neces-
sary data reconciliation occurs as monitoring technology evolves.

   (III) NOTABLE EVENTS AND IMPACTS
   The year 2019 will be remembered as the year of the big flood in eastern Canada. The country
experienced a catastrophic spring flood along the Ottawa and St. Lawrence Rivers, with record-
breaking discharge. This was even larger than the 2017 event, which was considered at the time to
be the flood of the century. A number of factors contributed to the flood. The region experienced
seven straight months of below-normal temperatures from October 2018 through April 2019. These
temperatures ensured that the ground froze deeply and thawed late, preventing the infiltration
of rain and snowmelt runoff. In addition, snowfall accumulation was 50% greater than normal
in upstream catchments of the Ottawa River and, with little melting by mid-spring, the deep and
icy snowpack remained for longer than normal. Multiple rounds of heavy spring rains fell over a
five-week period between mid-April and mid-May, adding 150 mm of additional rainwater to the
already heavily saturated region. All of these ingredients coincided, causing this catastrophic
event that claimed at least two lives and flooded about 6000 dwellings and other infrastructure.
   A similar situation also occurred in the spring of 2019 in the Fredericton-Saint John Region of
New Brunswick. During April, precipitation in the region was nearly double the monthly average
with six more wet days than normal and twice the number of heavy rain days (days with >10 mm)
recorded. Up to 130 mm of rain fell along the Saint John River region within 10 days in late April.
Mild temperatures and significant rains combined to rapidly melt the snowpack in New Brunswick.
The Saint John River at the Maine–New Brunswick border had its largest peak streamflow in 67
years. Farther downstream, the peak river level in Fredericton was over 8.3 m, the second-highest
level on record (behind 1973). As a result, more than 5500 dwellings were flooded or at risk, and
over 4000 hectares of land were flooded.
   Canada was hit directly by Category 2 Hurricane Dorian during the active 2019 Atlantic hur-
ricane season. By the time Dorian entered Canadian waters near Nova Scotia, the hurricane had
weakened from its peak wind speed of 300 km h−1 to about 160 km h−1. Dorian made landfall in
Halifax on 7 September as a post-tropical cyclone and brought sustained winds of 155 km h−1,
torrential rains, storm surges, and over 20-m waves for more than a 24-hour period. High winds
toppled trees and power lines, and storm surges caused widespread flooding. More than 500 000

  AU G U S T 2 0 2 0 | S t a t e o f t h e C l i m a t e i n 2 0 1 9              7 . R E G I O N A L C L I M AT E S   S330
homes and businesses were without electricity at the peak of the storm, and over 100 mm of rain
fell across the Atlantic region during the storm.
In contrast to the record-breaking wildfire seasons experienced in British Columbia in the last
two years, statistics from the Canadian Interagency Forest Fire Centre revealed a relatively quiet
fire season in 2019. The area consumed by wildfires in British Columbia was about 0.02% of the
area burned in each of the past two summers. A notable exception to the quiet wildfire season
was in Alberta. The number of fires there was on par with 2018, but the area that fire consumed
was nearly 14 times greater. In May, the “spring dip,” when trees and grasses have low moisture
content, was underway, and hot, very dry, strong gusty winds came early. Around mid-May, the
Chuckegg Creek fire erupted near the town of High Level in far northwestern Alberta. It burned
over 350 000 hectares and lasted over 100 days, making it one of the longest wildfires on record.
Over 10 000 Albertans were displaced from their homes as a result of this fire. Overall, wildfires
Downloaded from http://journals.ametsoc.org/bams/article-pdf/101/8/S321/4988913/2020bamsstateoftheclimate_chapter7.pdf by guest on 20 August 2020
in Alberta burned 883 000 hectares in 2019, making it the second-greatest area burned in 60
years and four times greater than the 25-year average.
2) United States— K. Gleason, C. Fenimore, R. R. Heim Jr., and A. Smith
During 2019, above-normal temperatures were observed across much of the Southeast and
parts of the Mid-Atlantic, while below-
normal temperatures were present
across the northern and central Plains
and part of the Great Lakes (Fig. 7.3a).
Overall, the 2019 annual average
temperature for the contiguous United
States (CONUS) was 11.5°C, which is
0.1°C below the 1981–2010 average
(Fig. 7.4). The annual CONUS tempera-
ture trend over the 125-year period of
record is increasing at an average rate
of 0.08°C decade −1, 0.26°C decade −1
since 1970. Above-normal precipita-
tion was observed across much of
the nation, with a large portion of the
central United States and parts of the
West receiving above- to much-above-
normal precipitation. Below-normal
annual precipitation was observed
across parts of the Northwest and the
South (Fig. 7.3b). Average precipitation
totaled 883 mm, which is 112% of the
1981–2010 average and the second-
largest value in the 125-year record,
behind 1973. The annual precipitation
total is increasing at an average rate of
5 mm decade−1 since 1970. Alaska had
its warmest year (+2.8°C departure;
0.2°C warmer than previous warmest
year of 2016) since statewide records
Fig. 7.3. Annual (a) average temperature anomalies (°C) and (b) total began in 1925. Precipitation across
precipitation (% of average) in the CONUS for 2019 (1981–2010 base Alaska was near normal at 104% of
period). (Source: NOAA /NCEI.) average.
AU G U S T 2 0 2 0 | S t a t e o f t h e C l i m a t e i n 2 0 1 9 7 . R E G I O N A L C L I M AT E S S331(I) TEMPERATURE
Across the CONUS, 2019 was
the coolest year since 2014
and the first year since then
in which some states ranked
in the lowest third of their his-
torical record for annual tem-
peratures. Nevertheless, 2019
ranked in the warmest third of
the 125-year historical distribu-
tion for the CONUS as a whole.
South Dakota recorded its 12th
Downloaded from http://journals.ametsoc.org/bams/article-pdf/101/8/S321/4988913/2020bamsstateoftheclimate_chapter7.pdf by guest on 20 August 2020
coldest year on record, one of
six states across the northern
Plains that ended the year in
the coldest third of their his-
torical distribution. In contrast, Fig. 7.4. Annual mean temperature anomalies (°C; 1981–2010 base period)
it was a warm year from the for the CONUS for 1895–2019. Red line is the lagged 10-year running mean.
(Source: NOAA /NCEI; for precipitation time series, see www.ncdc.noaa
Gulf Coast to the mid-Atlantic
.gov/cag/national/time-series.)
region. Georgia and North Caro-
lina each ranked warmest on
record, with Florida, South Carolina, and Virginia ranking second warmest.
The winter 2018/19 CONUS temperature was 0.1°C below the base period average, but still
ranking in the warmest third of its record. Above-average warmth was confined to portions of the
Southeast, while average- to below-average temperatures were evident from the Great Lakes and
central Plains to the West Coast. The CONUS spring temperature was 0.6°C below average, ranking
in the middle third of the record. Above-average temperatures were observed across the Pacific
Northwest and the Southeast. Florida had its warmest spring season on record with Georgia,
South Carolina, and North Carolina all having their second-warmest spring season on record.
Below-average spring temperatures were present from the West Coast to the Great Lakes and into
parts of New England. Summer CONUS temperatures were 0.3°C above average, ranking in the
warmest third of the 125-year record. Florida and Delaware ranked fifth warmest while much of
the central United States had near-average temperatures. The autumn CONUS temperature was
0.1°C below average, ranking in the middle third of the record. Below-average temperatures were
present across the northern tier, while above-average temperatures were observed from California
to the Southeast and into the mid-Atlantic states. Florida ranked sixth warmest for the season.
(II) PRECIPITATION
At the start of 2019, nearly 22% of the CONUS was in drought, according to the U.S. Drought
Monitor, mostly concentrated across the West and Southwest. Abundant precipitation during the
first few months of the year, especially over the western drought areas, helped improve conditions,
bringing the drought to its minimum extent of approximately 2% in April. Winter precipitation
across the CONUS was a record 134% of average. Much of the Ohio and Tennessee Valleys, as well
as the central Plains and Great Lakes received above-average precipitation during this period.
Both Wisconsin and Tennessee had a record wet winter. Below-average precipitation was confined
to parts of the Northwest, central Rockies, and Texas.
Spring 2019 precipitation was 122% of average and ranked fifth wettest on record. Above-
average precipitation occurred from parts of the West to the Great Lakes. Kansas observed its
wettest spring season on record. Precipitation was below average from the state of Washington
to northern Minnesota as well as across much of the Southeast. Record flooding along the
AU G U S T 2 0 2 0 | S t a t e o f t h e C l i m a t e i n 2 0 1 9 7 . R E G I O N A L C L I M AT E S S332Missouri, Mississippi, Platte, and Arkansas Rivers during the spring and summer months was
the result of rapid snowmelt in the spring as well as heavy and frequent precipitation throughout
the first six months of 2019.
Summer precipitation was 104% of average across the CONUS, with the wettest conditions oc-
curring across much of the Plains, as well as the Mississippi and Ohio Valleys. Conditions were
dry across much of the western United States and portions of the Midwest. By August, the weather
pattern turned dry and hot across parts of the country, increasing the drought footprint to 9% of
the CONUS, and continued to expand across the Southwest into October.
The autumn CONUS precipitation total was 101% of average and ranked in the wettest third of
the historical record. North Dakota, Minnesota, and Wisconsin were record wet for this period,
with dry conditions observed across the West, the central Rockies and Plains, as well as parts of
Texas and Florida. Five states had their wettest annual period on record, namely North Dakota,
Downloaded from http://journals.ametsoc.org/bams/article-pdf/101/8/S321/4988913/2020bamsstateoftheclimate_chapter7.pdf by guest on 20 August 2020
South Dakota, Minnesota, Wisconsin, and Michigan (Fig. 7.3b). For the year, the CONUS ranked
second wettest behind 1973. Dry conditions were not as extensive or as frequent as the wet condi-
tions, except during the late summer to early autumn. By the end of the year, drought was mainly
confined to the Pacific Northwest, the Southwest, and parts of the southern Plains, accounting
for 11% of the country.
(III) NOTABLE EVENTS AND IMPACTS
There were 14 weather and climate events during 2019 with losses exceeding $1 billion (U.S.
dollars) each across the United States and yielding 44 fatalities (www.ncdc.noaa.gov/billions):
three inland flooding events, eight severe storm events, two tropical cyclone events (Dorian
and Imelda), and one wildfire event (Fig. 7.5). The year’s loss total of $45.0 billion (U.S. dollars)
was above average, as the 40-year (1980–2019) annual cost average, adjusted for inflation, is
$43.9 billion (U.S. dollars). The combined cost of $20.0 billion (U.S. dollars) associated with the
Missouri, Arkansas, and Mississippi River flooding was nearly half of the U.S. cost total during
2019. The total cost of U.S. billion-dollar disasters over the last five years (2015–19) exceeds $525
Fig. 7.5. Map depicting date, approximate location, and type of the 14 weather and climate disasters in the United States
in 2019 with losses for each exceeding $1 billion (U.S. dollars). (Source: NOAA /NCEI.)
AU G U S T 2 0 2 0 | S t a t e o f t h e C l i m a t e i n 2 0 1 9 7 . R E G I O N A L C L I M AT E S S333billion (U.S. dollars), with a five-year annual cost average of $106.3 billion (CPI-adjusted U.S. dollars), both of which
are records. The damage costs from 2010 to 2019 for the United States were also historically large—exceeding $800
billion (U.S. dollars) from 119 separate billion-dollar events (Smith 2020).
During 2019, there were 1520 tornado reports, including preliminary numbers for September–December. This was
well above the 1991–2010 U.S. annual average of 1251 tornadoes. Once preliminary numbers are finalized, it is likely
that 2019 will rank among the top five years for tornado counts since 1950.
Nearly 50 000 wildfires were recorded across the CONUS in 2019. Since 2000, only 2013 had few-
e r w i ld f i re s t h a n wh at w a s ob s e r ve d du r i ng 2 01 9. T he 2 01 9 f i re s con s u me d approx i m ate ly
1.9 million hectares, which was the sixth-smallest area in the last 20 years.
Downloaded from http://journals.ametsoc.org/bams/article-pdf/101/8/S321/4988913/2020bamsstateoftheclimate_chapter7.pdf by guest on 20 August 2020
SIDEBAR 7.1: Record wetness and the impact on U.S. Midwest/Plains agriculture
growing season 2019—D. TODEY
The U.S. flooding issues of 2019 were well-reported nation-
2020) and season-long flooding along many rivers throughout
ally, capturing a great deal of attention because of their wide-
the Corn Belt and Northern Plains. However, the wider-spread
spread impacts on the Missouri and Mississippi River systems. agricultural impacts were due more to overall soil wetness than
There were direct flooding impacts to agriculture (including live-
direct flooding (Todey et al. 2020).
stock, soil damage, and loss of grain in flooded bins) due to theBecause autumn 2018 and spring 2019 were very wet across
flooding associated with the March Bomb Cyclone (Bosart et al.the Midwest and Plains, extremely wet soils were present in
the region early in the year. This resulted
in delayed planting, because excessively
wet soils limit field access to plant crops
as soils can be damaged by compaction
from large equipment traversing fields.
Excessively wet fields can also limit crop
development and increase disease risk.
Due to the preseason precipitation and
a wet, cool spring, planting moved at
a record slow pace for corn, soybeans,
small grains, and other crops. Typically,
corn is nearly half emerged by mid-May.
Figure SB7.1 depicts how far behind corn
emergence was in mid-May 2019.
Many hectares went unplanted be-
cause of the excess wetness. Federal
crop insurance plans cover, among other
losses, “prevented planting,” where
conditions are too wet to plant during
the crop planting time frame. The Upper
Midwest set a record number of prevented
planting hectares with nearly eight million
Fig. SB7.1. State corn emergence numbers as of 19 May 2019 and a comparison hectares unplanted. Large areas of corn
to the 5-year average. Corn is usually nearly half emerged by mid-May. (Image
courtesy Brad Rippey [USDA-OCE].)
AU G U S T 2 0 2 0 | S t a t e o f t h e C l i m a t e i n 2 0 1 9 7 . R E G I O N A L C L I M AT E S S334were planted well into June, much later than is usually recom- and poor grain quality. In addition, wetness leads to additional
mended. A sampling of crop records are: disease issues.
• Least amount of corn planted by 2 June (67% planted). Despite the delays, most row crops (i.e., corn/soybeans) did
• Least amount of corn emerged by 2 June (46% emerged), reach maturity but had not dried down in the field as much as
which broke established records between 70% and 80%. producers would like. This resulted in a large amount of time
• Least amount of soybeans emerged by 2 June (19% emerged). and management to dry the grain after harvesting it, which in
The most affected areas included (Fig. SB7.2, highest indem- turn slowed the harvest progress. The additional drying costs
nity): northwest Ohio, northern Illinois, the Missouri River valley, (propane/electricity) further reduced profit during a time of very
and the eastern Dakotas/western Minnesota. Some counties in limited profit margins on most crops. Above-average precipita-
these areas planted less than half of their agricultural hectares. tion occurred during harvest, further slowing crop harvest.
Because of the widespread late planting, crops had a shorter Relatively early snow in the Dakotas limited harvest, leaving
Downloaded from http://journals.ametsoc.org/bams/article-pdf/101/8/S321/4988913/2020bamsstateoftheclimate_chapter7.pdf by guest on 20 August 2020
season to complete development. For crops such as soybeans, some sunflowers and nearly half the corn in North Dakota still in
a shortened season is a minor issue. Corn, however, requires a the field at the end of the year, according to the USDA National
certain amount of heat (measured by Growing Degree Days) to Agricultural Statistics Service. The crops with the largest yield
complete phenological development. The late start and moder- losses were corn (3% below trend) and soybeans (4% below
ate temperatures, which would be good for crop development trend). Winter wheat, grown more extensively in the Plains,
in an on-time planting year, slowed crop progress through was able to utilize the additional moisture and cooler spring
the season. Wet years do not limit grain production (yield) as conditions in 2019, leading to larger yields (7% above trend).
much as drought years. The issues during wet seasons tend to The additional grain-handling issues also produced associ-
be limited development time, excessively wet crops at harvest, ated impacts. The heavy drying requirement, along with an early
cold event, caused shortages of pro-
pane needed for drying. Handling
wet grain can lead to packed grain,
which is dangerous to dislodge from
within grain bins. Several deaths
were reported because of people
accidentally becoming entrapped
in grain bins. The additional stress
of a difficult growing season, along
with low grain prices, led to many
Midwestern states setting up state
efforts to deal with rural/farm stress
and mental health issues.
Additional stress occurred in
the spring of 2019 when several
blizzards covered the Plains dur-
ing calving periods. Most cattle on
rangeland are not housed inside.
Consequently, blizzards during calv-
ing are very dangerous. Beef cattle
losses during the spring in Nebraska
and South Dakota were significant.
Reports on losses are still being de-
veloped at the time of this writing.
Fig. SB7.2. USDA Risk Management Agency Crop county-level indemnities (insurance
payments for unplanted crops) paid. The darker the color, the higher the indemnity—
mostly crop insurance payments for spring prevented planting across the Midwest
and Plains.
AU G U S T 2 0 2 0 | S t a t e o f t h e C l i m a t e i n 2 0 1 9 7 . R E G I O N A L C L I M AT E S S3353) Mexico— R. Pascual Ramírez
The 2019 precipitation total for
Mexico was near average at 96.8%
of normal, making it the 19th-driest
year since records began in 1941.
Regionally, the entire coastal zone
of the Gulf of Mexico, the southeast,
the Yucatan Peninsula, as well as
several regions of the Pacific, had the
greatest rainfall deficits for the year.
Above-average precipitation fell in
the northwest and parts of the central
Downloaded from http://journals.ametsoc.org/bams/article-pdf/101/8/S321/4988913/2020bamsstateoftheclimate_chapter7.pdf by guest on 20 August 2020
and northern regions of the country.
Temperatures were higher than aver-
age during all months of the year, ty-
Fig. 7.6. Annual mean temperature anomalies (°C, black line; 1981–
ing with 2016 as the second-warmest
2010 period) for Mexico for 1953–2019. Red line depicts the lagged
year on record. 10-year running mean. (Source: National Meteorological Service of
Mexico.)
(I) TEMPERATURE
The 2019 national mean tempera-
ture of 22.4°C was 1.5°C above the
1981–2010 average and tied with 2016
as the second-warmest year since re-
cords began in 1953 (Fig. 7.6). The year
2017 is the warmest year on record. The
year 2019 also marked the 15th con-
secutive year with temperatures above
average. All months of the year were
warmer than average, with August be-
ing exceptionally warm. The national
August 2019 average temperature was
27.0°C, or 3.3°C above average—the
warmest August on record and the
warmest month for any month since
1953.
The 2019 mean temperature was
above average across much of the
cou nt r y, w it h a few except ions
across the northwest and the Baja
California Peninsula, as well as
southern parts bordering the Pacific
(Fig. 7.7a). Twelve states across central
to southern Mexico had their warmest
year on record. Meanwhile, no state
had a top-10 cold year on record.
Fig. 7.7. 2019 annual (a) mean temperature anomalies (°C) and
(b) precipitation anomalies (% of normal; 1981–2010 base period)
over Mexico. (Source: National Meteorological Service of Mexico.)
AU G U S T 2 0 2 0 | S t a t e o f t h e C l i m a t e i n 2 0 1 9 7 . R E G I O N A L C L I M AT E S S336(II) PRECIPITATION
Rainfall distribution varied regionally (Fig. 7.7b), with above-normal precipitation across the
northwest, especially parts of Chihuahua and Sonora. Other regions with above-average rainfall
include the northeast, specifically southern Nuevo León and northern San Luis Potosí, along with
small regions in the central Pacific and a small area in central Oaxaca. The rest of the country
had below-average precipitation, with the three eastern states of San Luis Potosí, Veracruz, and
Hidalgo having their driest, second-driest, and third-driest year on record, respectively.
The first three months of the year produced two dry months and a wet one, resulting in the
28th-driest January–March period. However, dry conditions persisted across much of the rest of
the year. The three-month period of April–June is the transition from the dry season to the rainy
season; it ranked ninth-driest such period on record. The July–September period was the eighth-
driest such period on record. Beneficial rains returned during the last three months of the year,
Downloaded from http://journals.ametsoc.org/bams/article-pdf/101/8/S321/4988913/2020bamsstateoftheclimate_chapter7.pdf by guest on 20 August 2020
giving way to the fourth-wettest October–December period on record. The dry conditions across
eastern Mexico were mostly attributed to the lack of tropical cyclones affecting the region.
Climatologically, September is the nation’s rainiest month of the year, contributing about
18.4% of the annual rainfall. September was indeed the nation’s rainiest month of 2019, and it
contributed 20.1% of the annual rainfall. Much of September’s rainfall was associated with three
tropical cyclones: Hurricane Lorena and Tropical Storm Narda, both on the Pacific side, and
Tropical Storm Fernand along the Gulf of Mexico. Tropical Storm Fernand was the only storm
to affect the country’s Gulf of Mexico coast, with copious rain in early September. The storm’s
rainfall benefited only northeastern Mexico, farther north from drought-stricken areas in the
east. On the Pacific side, Hurricane Lorena made landfall along the nation’s coasts three times,
but its greatest rainfall occurred across the central-western part of Mexico.
Climatologically, March is the driest month of the year, contributing only 1.8% to the annual
rainfall. However, in 2019, April was the driest month of the year, contributing only 0.9% of the
total annual rainfall.
(III) NOTABLE EVENTS AND IMPACTS
Typically winds and rains from tropical cyclones (TCs) begin to significantly affect Mexico
when they come within 100 km of the coast. Five TCs affected Mexico during 2019. Four storms
approached within 100 km of, or made landfall on, the nation’s Pacific coast, while one TC made
landfall from the Gulf of Mexico, as noted above. Five storms affecting Mexico is near the long-term
average, but it is low when compared to the very active recent years. Considering only the decade
of 2010–19, 2019 tied with 2016 for the second-fewest (to 2015, with three) number of active TCs.
For a third consecutive year, drought conditions deteriorated in southern Mexico due to the
absence of TCs near this region. Hidalgo, San Luis Potosi, Veracruz, and Tabasco, some of Mexico’s
rainiest states, each reported a September among their eight driest, with Hidalgo having its third-
driest September on record. Drought impacts for the region included water shortages in southern
Veracruz and Tabasco, lack of pasture forage and water supplies, and reduced runoff in streams
(made worse by higher temperatures). In Chiapas, Sumidero Canyon was closed in February to
recreational navigation due to the very low water levels in the Grijalva River.
c. Central America and the Caribbean—A. Sánchez-Lugo, Ed.
During 2019, much of Central America and the Caribbean had near- to above-normal tem-
peratures and near- to below-normal precipitation. Several tropical systems impacted the region;
however, only two named storms formed in the Caribbean Sea.
Unless otherwise noted, all anomalies are with respect to the 1981–2010 base period.
AU G U S T 2 0 2 0 | S t a t e o f t h e C l i m a t e i n 2 0 1 9 7 . R E G I O N A L C L I M AT E S S337You can also read