RESULTS PRESENTATION H1-2021 - Milan, July 29th 2021 - Prada Group
←
→
Page content transcription
If your browser does not render page correctly, please read the page content below

H1-2021
RESULTS PRESENTATION

     Milan, July 29th 2021
               1             July 29th 2021
Agenda

Patrizio Bertelli – CEO
Business overview
Alessandra Cozzani – CFO
H1-2021 Financial Review
Lorenzo Bertelli – Marketing Director and Head of CSR
Marketing and ESG update
Patrizio Bertelli – CEO
Outlook
Q&A Session

                                 2                      July 29th 2021
Agenda

Patrizio Bertelli – CEO
Business overview
Alessandra Cozzani – CFO
H1-2021 Financial Review
Lorenzo Bertelli – Marketing Director and Head of CSR
Marketing and ESG update
Patrizio Bertelli – CEO
Outlook
Q&A Session

                                 3                      July 29th 2021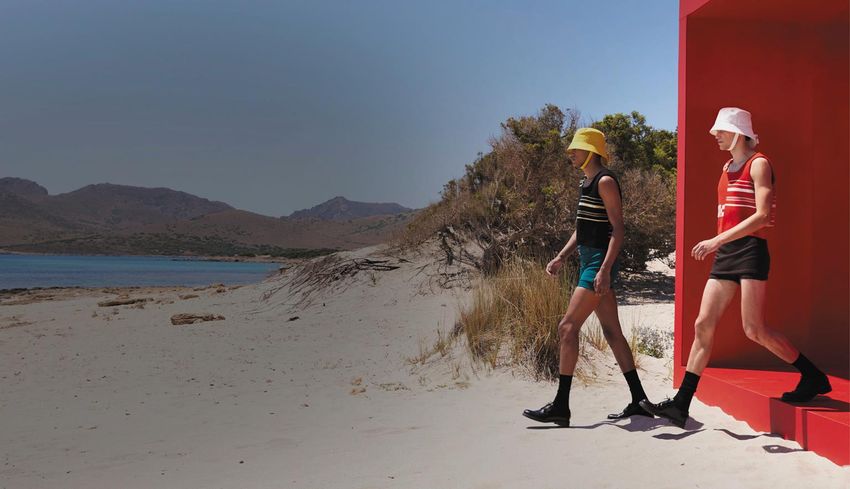
Strategy Update
                                                 Delivering results

Brand Elevation Strategy           Direct-to-Consumer            Responsible Growth
• Focus on full price sales        • Retail prioritisation       • Sustainable product innovation and
• Strict control of the            • Digital acceleration          circularity
  distribution channels            • Omni-channel                • 2021 diversity, equity & inclusion initiatives
• Elevation of the product offer     customer journey            • ESG roadmap announced in Autumn 2021

                                                             4                                                      July 29th 2021
Financial Update
                             Strategic execution delivers growth and profits

Fast Top Line Recovery
• Strong progression in retail revenues, well above the
  H1-2019 levels, despite continued restrictions

• Growth accelerating throughout the semester, with
  double digit retail organic growth in Q2-21 vs. Q2-19

• Remarkable performance in
  Asia, Americas, Middle East and Russia

Profitability Already
Above Pre-COVID Level
• Gross margin at record high driven by favourable channel
  mix, full price sales and successful product elevation

• Disciplined management of operating costs, prioritizing
  customer engagement and communication initiatives

• EBIT already above pre-COVID level

                                                          5                    July 29th 2021
Agenda

Patrizio Bertelli – CEO
Business overview
Alessandra Cozzani – CFO
H1-2021 Financial Review
Lorenzo Bertelli – Marketing Director and Head of CSR
Marketing and ESG update
Patrizio Bertelli – CEO
Outlook
Q&A Session

                                 6                      July 29th 2021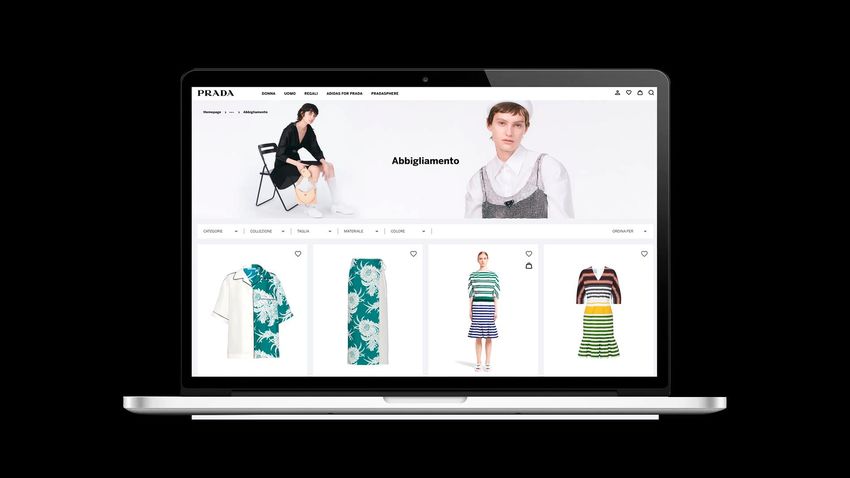
Key Financials Summary
                                             Outstanding growth and profitability
H1 Revenues:                                        H1 EBIT:                           H1 Operating Cash Flow:
€1,501m                                             €166m                              € 316m
Retail Revenues (€m) and growth (%) *               EBIT (€m) and margin (%)           Net Debt (€m)

         +8%                                              9.6%      NM         11.1%

                       +60%          1.281                                      166
       1.232                                              150
                                                                                                311
                       835

                                                                                                        102
                                                                    -196

       H1-19          H1-20          H1-21              H1-19      H1-20       H1-21           FY-20   H1-21
(*) at constant exchange rates (%)

                                                                       7                                       July 29th 2021
Net sales by Channel
                           Retail sales well above the pre-pandemic levels

€ mln / % change same FX      H1 21          H1 21 vs.         H1 21 vs.
                                                                                            Wholesale
                                              H1 20             H1 19                         11%
                                                                                     DFS
Retail                        1,281            +60%              +8%                 2%

Wholesale                      196            +119%              -37%

Total                         1,478            +66%              -1%

                                                                                                        Retail
                                                                                                        87%

Retail
• Sharp retail improvement on a 2-years stack vs. 2019
• 17% stores closed during the period
• Continued outstanding growth in online sales (triple-digit growth in H1-21 vs. H1-20 and H1-19)
• 633 DOS end of June 2021

Wholesale
• Persistent selective approach in traditional wholesale and e-tailers

                                                           8                                                July 29th 2021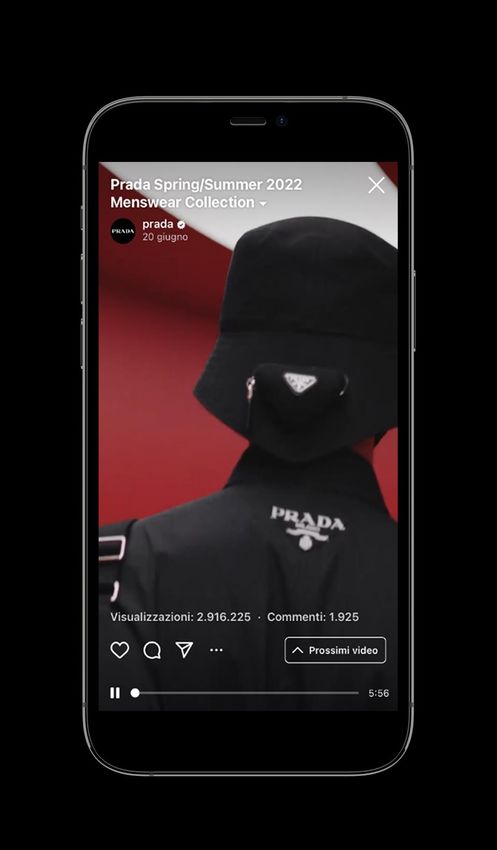
Retail sales trend
                     Strong sequential improvement vs. 2019

                            Retail sales organic growth vs. 2019
          15%

          10%

               5%

               0%
                    Q3-20            Q4-20             Q1-21       Q2-21

           -5%

          -10%
% average           4%                15%               22%        13%
store closed

                                              9                            July 29th 2021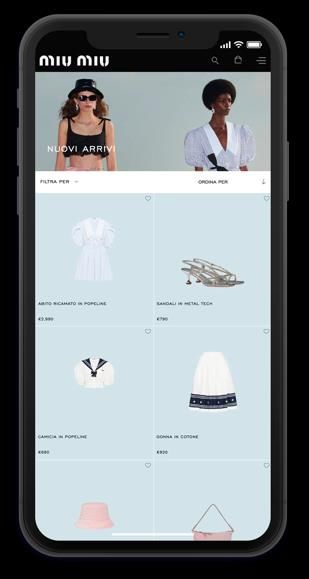
Retail sales by Geography
                               Exceeding pre-pandemic levels in most regions

 € mln / % change same                 H1 21           H1 21 vs.           H1 21 vs.                            Middle East
                                                                                                                    5%
 FX                                                     H1 20               H1 19
 Europe                                  263              +19%                -29%
                                         599                                                                Japan
 Asia Pacific                                             +65%               +35%                            10%              Americas
                                                                                                                                18%
 Americas                                232             +163%               +53%

 Japan                                   129              +25%                -24%

 Middle East                             59              +129%               +28%                                                 Europe
                                                                                                                                   20%
                                                                                                             APAC
 Total                                  1,281             +60%                +8%                             47%

Europe
• 36% of store network closed during the period / Improving trend
  since the reopenings
• Robust demand from local customers

Asia Pacific                                                             Japan
• Strong double digit growth in both Q1 and Q2 vs. 2019                  • Renewed lockdown of stores impacting revenues vs. 2019
• Sustained demand in key markets throughout the period vs. 2019:        • Guam and Saipan still closed
  China (+77%), Korea (+108%) Taiwan (+74%)

Americas                                                                 Middle East
• Strongest regional performance driven by locals                        • Further strength during the period driven by locals and some
• Sharp acceleration on a 2-years stack                                    resumption in tourism
• Progress across all countries

                                                                    10                                                         July 29th 2021
Retail sales by Product
All categories above 2019 levels – superior performance in RTW
€ mln / % change same FX Other
H1 21 H1 21 vs. H1 21 vs.
2%
H1 20 H1 19
Leather Goods 703 +51% +4%
Shoes
Ready to Wear 334 +71% +24% 17%
Footwear 224 +77% +5%
Other 21 +63% -23% Leather
RTW Goods
Total 1,281 +60% +8% 26% 55%
Leather Goods
• Well balanced growth across iconic and new lines
Ready to Wear
• Outstanding performance for Prada and Miu Miu collections
Footwear
• High demand for lifestyle and new collections
11 July 29th 2021Retail sales by Brand
Outstanding performance of the Prada brand
Church's Other
€ mln / % change same FX H1 21 H1 21 vs. H1 21 vs. 1% 0%
H1 20 H1 19
Prada 1,100 +64% +13% Miu Miu
13%
Miu Miu 166 +43% -8%
Church’s 11 -1% -52%
Other (*) 4 +59% -32%
Total 1,281 +60% +8% Prada
86%
(*) includes Marchesi and Car Shoe
Prada
• Very sharp growth on a 2 year basis
• Highly acclaimed fashion shows
• All categories drove the growth
Miu Miu
• Outstanding performance in RTW, double-digit vs. 2019 levels
• Upcycled by Miu Miu: successful project in collaboration with Levi’s
Church’s
• Still heavily impacted by the geographic exposure
12 July 29th 2021Gross margin development
Margins at record high
+2.9% -0.3%
74.3% 74.3%
+0.6%
+3.3%
71.7%
70.4%
[+260 bps vs. 19] [+390 bps vs. 20]
H1 2019 product FX H1 2021 H1 2020 product FX H1 2021
channel country
country scale
• Driven by successful product elevation, channel / country mix and scale
13 July 29th 2021Operating costs
Proactive cost management
975 -55 +25 -1 +5 949
+11 +10 949
+33
856 +40
H1 20 Selling A&P PD G&A H1-21 H1 19 Selling A&P PD G&A H1 21
• Total opex increased by +10% vs. 2020 (or +14% at contant rates)
• Decreased by -3% vs. 2019 or flat at constant rates
• Saving programme still implemented in H1-21
14 July 29th 2021Capex
Supporting know how and long term retail growth
75
€ mln
14
Corporate, IT & Industrial
49
Retail
28
61
21
H1 -2 0 H1 -2 1
• 76 renovations and relocations projects
• Securing key retail locations: acquisition of Prada store in Athens
15 July 29th 2021Net Operating Working Capital
Managing supply chain effectively
667
€ mln 622
290
270
Trade Payables
Trade Receivables
Inventory 666 628
-290 -276
FY-2 0 H1 -2 1
• Net working capital continued to improve
• Inventory down yoy
16 July 29th 2021Net Financial Position
Opening Net financial position surplus / (deficit) - 31/12/2020 (311)
Consolidated Net Result 97
Net Working Capital 71
Depreciation and Amortization / other non monetary items 147
Investments -77
Dividends -86
Other 57
Closing Net financial position surplus / (deficit) - 30/06/2021 (102)
17 July 29th 2021Condensed P&L
€m H1-2019 H1-2020 H1-2021
Net Revenues 1,570 100% 938 100% 1,501 100%
COGS -444 -28.3% -278 -29.6% -386 -25.7%
Gross Margin 1,126 71.7% 660 70.4% 1,115 74.3%
Selling -707 -45.0% -611 -65.1% -651 -43,4%
Advertising & Promotion -101 -6.5% -94 -10.0% -127 -8.5%
Design and Product Development -65 -4.1% -52 -5.7% -64 -4.2%
G&A -102 -6.5% -98 -10.3% -107 -7.1%
Operating expenses -975 -62.1% -856 -91.3% -949 -63.2%
EBIT 150 9.6% -196 -20.9% 166 11.1%
Total Financial expenses -30 -1.9% -40 -4.2% -28 -1.8%
EBT 120 7.7% -236 -25.1% 138 9.2%
Income Taxes 34 2.2% 52 5.5% -41 -2.8%
Minority Income 0 0.0% -3 -0.3% 0 0.0%
Group Net income / (Loss) 155 9.9% -180 -19.2% 97 6.4%
Total D&A -340 -21.7% -351 -37.4% -312 -20,8%
EBITDA 491 31.2% 155 16.5% 478 31.9%
18 July 29th 2021Condensed Balance Sheet
€m 31 Dec 2020 30 June 2021
Right of use 2,054 2,035
Non current assets (excl deferred tax assets) 2,507 2,464
Net operating working capital 667 622
Other current assets / (liabilities), net 25 -28
Other non current assets / (liabilities), net 42 20
Net invested capital 5,296 5,113
Consolidated shareholders’ equity 2,852 2,894
Net financial position (surplus) / deficit 311 102
Long term lease liability 1,730 1,708
Short term lease liability 404 409
Total 5,296 5,113
Operating cash flow 262 316
Net working Capital / Sales 28% 21%
Capex 122 75
Debt / Equity 11% 4%
19 July 29th 2021Agenda
Patrizio Bertelli – CEO
Business overview
Alessandra Cozzani – CFO
H1-2021 Financial Review
Lorenzo Bertelli – Marketing Director and Head of CSR
Marketing and ESG update
Patrizio Bertelli – CEO
Outlook
Q&A Session
20 July 29th 2021E-commerce
Digital development driving higher conversion rates
Continued outstanding growth in online sales
• Triple digit growth in H1-21 vs. H1-20 and H1-19
• Brands.com and market places penetration up to
7% on retail sales
Strengthening online presence
• Successful launch of Prada and Miu Miu flagships
on T-Mall
• Reinforcing dedicated local teams (i.e. China, Korea)
• New selected partnerships ongoing
Further enriching the online customer experience
• Leveraging advanced analytics
• Storytelling strategies to envisage clients on brands
and company’s values
• Client-centric journey experience redesigned
21 July 29th 2021Increasing brand visibility across social and online
Confirming Prada and Miu Miu brand heat
Instagram
engagement rate +2 pos
H1-21 vs. H1-20 (*)
Instagram
engagement rate
+1 pos
H1-21 vs. H1-20 (*)
Site traffic +107%
H1-21 vs. H1-20 (**)
Site traffic +39%
H1-21 vs. H1-20 (**)
Traffic to the
Chinese site
+259%
H1-21 vs. H1-20 (***)
Traffic to the
Chinese site
+85%
H1-21 vs. H1-20 (***)
(*) Sprinklr – comparing the growth rate of a panel made of 9 luxury peers (***) Adobe Analytics – Including only traffic from Search Engine or Direct
(**) Adobe analytics
22 July 29th 2021Excellent reception to Prada and Miu Miu digital shows
Continued online engagement growth
Men’s SS22
2.9 mln views
1st on IGTV Men’s
Fashion Weeks
+53%
vs. FW21
Reach and
Engagement Rate
Fashion Weeks
1st
Ranked
FW21
505k views
on Instagram
+170%
vs SS21
2,1 mln
video views
+950%
vs SS21
23 July 29th 2021Prada Brand share of voice accelerated by talent strategy and Prada Cup
Amplifying brand identity and vision
Talent Strategy
- Inclusive strategy engaging talent from diverse
backgrounds, including different cultural spheres
(e.g. music, sport, and art)
Prada Cup
- The Prada Cup generated the most audience
engagements of all the tournament phases
- Luna Rossa is a longstanding element of the
active-wear identity of the Prada brand
Google search share of voice trend
Prada brand
6,6%
5,9%
5,1%
4,7% 4,8%
H1 2019 H2 2019 H1 2020 H2 2020 H1 2021
Source: Google trend – Comparing the volume of searchs of a panel made of 9 luxury peers
24 July 29th 2021ESG
Progressing ESG journey
Prada Group to announce Sustainability
Roadmap in autumn 2021
Deepened commitment to Diversity, Equity &
Inclusion
Substantial investment in educational and talent
advancement programmes
Launched Sea Beyond second edition
New initiatives, marking project’s expantion to reach
more age groups and communities globally
Upcycled by Miu Miu
Continued success, giving new life to pre-loved denim
in collaboration with Levi’s®
25 July 29th 2021Agenda
Patrizio Bertelli – CEO
Business overview
Alessandra Cozzani – CFO
H1-2021 Financial Review
Lorenzo Bertelli – Marketing Director and Head of CSR
Marketing and ESG update
Patrizio Bertelli – CEO
Outlook
Q&A Session
26 July 29th 2021Outlook
• Strong momentum in H1-21 continuing in H2-21
• Committed to unlocking further potential in
Miu Miu brand
• Capitalize on Prada’s high brand engagement
and identity to capture further development
opportunities
• Further embedding ESG in the Group strategy
• Continuing to invest in direct control of
the supply chain
• Confident in our profitable growth potential
27 July 29th 2021You can also read