MONTHLY FOOD SECURITY BULLETIN OF SOUTH AFRICA: JUNE 2020 - Daff
←
→
Page content transcription
If your browser does not render page correctly, please read the page content below
MONTHLY FOOD SECURITY BULLETIN
OF SOUTH AFRICA:
JUNE 2020
Issued: 3 July 2020
Directorate: Statistics and Economic Analysis
Highlights:
The ENSO Outlook has been raised to La Niña WATCH. This means while the El
Niño-Southern Oscillation is currently neutral, the chance of a La Niña forming
during the southern hemisphere spring has increased to around 50% - twice the
normal likelihood.
The projected closing stocks of wheat for the current 2019/20 marketing year are
426 079 tons, which includes imports of 1,800 million tons. It is also 21,0% less
than the previous years’ ending stocks.
The expected commercial maize crop for 2020 is 15,514 million tons, which is
37,6% more than the 11,275 million tons of the previous season (2019).
Projected closing stocks of maize for the current 2020/21 marketing year are
1,922 million tons, which is 92,1% more than the previous years’ ending stocks.
The projected closing stocks of sorghum for the current 2020/21 marketing year
are 32 313 tons, which is 46,5% less than the previous years’ ending stocks.
The projected closing stocks of sunflower seed for current 2020/21 marketing
year are 130 685 tons, which is 3,4% less than the previous years’ ending stocks.
The projected closing stocks of soybeans for the current 2020/21 marketing year
are 169 655 tons, which is 22,5% more than the previous years’ ending stocks.
The annual percentage change in the CPI was lower at 3,0% in April 2020, which
is the lowest since June 2005 when the rate was 2,8%.
The annual percentage change in the PPI for final manufactured goods was lower
at 1,2% in April 2020.
May 2020 tractor sales of 432 units were significantly more (19%) than the 364
units sold in May 2019.
Enquiries: Marda Scheepers or Queen Makgoka
Directorate: Statistics and Economic Analysis
Tel: +27 12 319 8033/8164
Tel: +27 12 319 8031
Email:MardaS@dalrrd.gov.za or QueenS@dalrrd.gov.za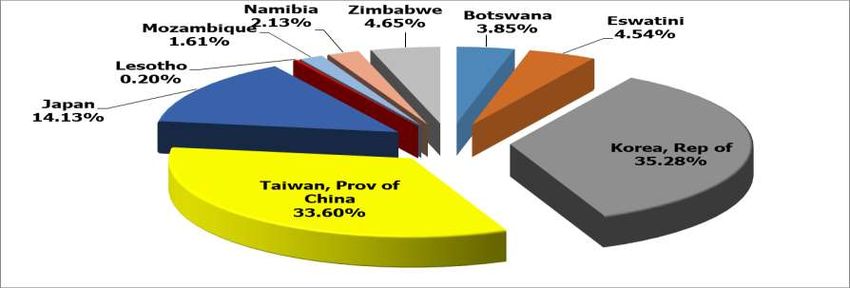
Contents
_________________________________________________________________________________

1. Weather conditions                                                    3

2. Grain production                                                      4
     2.1      Summer grain crops - 2020                                  4

     2.2      Winter cereal crops - 2019                                 5

     2.3      Non-commercial maize                                       5

3. Cereal balance sheets                                                 5

4. Market information                                                    7
     4.1      Consumer Price Index (CPI)                                 7

     4.2      Producer Price Index (PPI)                                 7

     4.3      Future contract prices                                     8

     4.4      Agricultural machinery sales                               8

5. Acknowledgements                                                      9

           RSA Food Security Bulletin – June 2020
                                                    2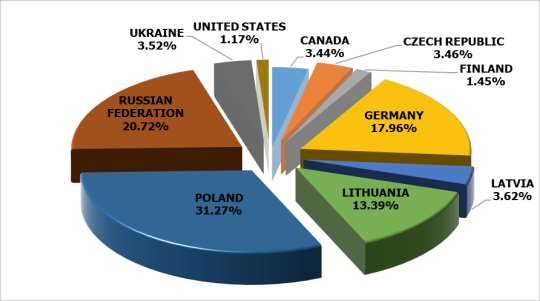
1.      Weather conditions

1.1     Weather outlook

                                                               The ENSO Outlook has been raised to La Niña WATCH. This means
                                                               while the El Niño-Southern Oscillation is currently neutral, the
                                                               chance of a La Niña forming during the southern hemisphere spring
                                                               has increased to around 50% - twice the normal likelihood.
                                                               The status change follows cooling in the tropical Pacific Ocean and
                                                               an increase in the number of climate models suggesting La Niña
                                                               thresholds may be reached in the coming months.
                                                               A La Niña WATCH is not a guarantee that a La Niña will occur; it is
                                                               an indication that some of the typical precursors of an event are in
                                                               place. Roughly half the surveyed climate models suggests that an
                                                               event is likely to develop during the southern hemisphere spring.
                                                               Bureau climatologists will continue to closely monitor developments
                                                               in the tropical Pacific Ocean. Source: Bureau of Meteorology, Australian
                                                               Government.

According to the latest Seasonal Climate Watch (June) of the SA Weather Service, the multi-model rainfall forecast for
mid- and late-winter (Jun-Jul-Aug, Jul-Aug-Sep) indicates increased chances of above-normal rainfall over the South-
Western and Southern parts of the country with drier than normal conditions throughout the rest of South Africa. In
general, most of the country is expected to experience above-normal temperatures during winter with the exception of
below-normal minimum temperatures for the north-eastern half of the country.

1.2     Level of dams
Available information on the level of South Africa’s dams on 22 June 2020 indicates that the country has approximately
69% of its full supply capacity (FSC) available, which is 2% less than the corresponding period in 2019. The dam levels
in the Northern Cape, Gauteng, North West, Western Cape, KwaZulu-Natal, Limpopo and Mpumalanga provinces, all
show improvements in the full supply capacity as compared to 2019. The remaining two provinces show decreases in the
full supply capacity for the mentioned period, with -6% indicated for the Eastern Cape and -4% for the Free State
Province. The provincial distribution of South Africa’s water supply including Lesotho and Swaziland is contained in Table
1 below.
Table 1: Level of dams, 22 June 2020

                              Net FSC million cubic             22/06/2020                                    % Increase/Decrease
         Province                                                                      Last Year (2019) (%)
                                    meters                         (%)                                           2020 vs. 2019
       Eastern Cape                    1 810                           53                          59                -6,0
         Free State                   15 653                           83                          87                -4,0
          Gauteng                       128                           100                          94                 6,0
      KwaZulu-Natal                    4 784                           61                          58                 3,0
         Lesotho*                      2 363                           26                          30                -4,0
          Limpopo                      1 522                           64                          62                 2,0
       Mpumalanga                      2 539                           73                          71                 2,0
        North West                      867                            70                          65                 5,0
      Northern Cape                     147                            95                          81                14,0
        Swaziland*                      334                            78                          95                -17,0
       Western Cape                    1 866                           41                          37                 4,0
           Total                     32 012                           69                           71                -2,0
                                                      Source: Department of Water and Sanitation
             RSA Food Security Bulletin – June 2020
                                                                       3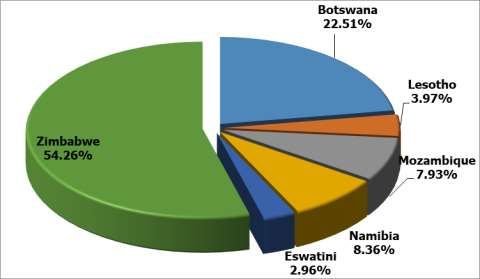
2. Grain production
2.1 Summer grain crops - 2020
The area planted and fifth production forecast of summer grains for the 2020 season was released by the Crop Estimates
Committee (CEC) on 25 June 2020, and is as follows:
Table 2: Commercial summer crops: Area planted and 5th production forecast - 2020 season
Area planted 5th Forecast Area planted Final crop Change
CROP
2020 2020 2019 2019 2020 vs 2019
Ha Tons Ha Tons %
(A) (B) (C) (D) (B) ÷ (D)
Commercial:
White maize 1 616 300 9 074 860 1 298 400 5 545 000 63,66
Yellow maize 994 500 6 438 950 1 002 100 5 730 000 12,37
Total Maize 2 610 800 15 513 810 2 300 500 11 275 000 37,59
Sunflower seed 500 300 765 960 515 350 678 000 12,97
Soybeans 705 000 1 261 250 730 500 1 170 345 7,77
Groundnuts 37 500 52 140 20 050 19 400 168,76
Sorghum 42 500 133 660 50 500 127 000 5,24
Dry beans 50 150 68 860 59 300 66 355 3,78
TOTAL 3 946 250 17 795 680 3 676 200 13 336 100 33,44
Note: Estimate is for calendar year, e.g. production season 2019/20 = 2020
Commercial maize: The area estimate for maize is 2 610 800 ha, which is 13,49% or 310 300 ha more than
the 2 300 500 ha planted for the previous season. The expected commercial maize crop is 15 513 810 tons,
which is 37,59% or 4 238 810 tons more than the 11 275 000 tons of the previous season (2019). The yield for
maize is 5,94 t/ha.
The area estimate for white maize is 1 616 300 ha, which represents an increase of 24,48% or 317 900 ha
compared to the 1 298 400 ha planted last season. The production forecast of white maize is 9 074 860 tons,
which is 63,66% or 3 529 860 tons more than the 5 545 000 tons of last season. The yield for white maize is
5,61 t/ha.
In the case of yellow maize, the area estimate is 994 500 ha, which is 0,76% or 7 600 ha less than the
1 002 100 ha planted last season. The yellow maize production forecast is 6 438 950 tons, which is 12,37% or
708 950 tons more than the 5 730 000 tons of last season. The yield for yellow maize is 6,47 t/ha.
Sunflower seed: The area estimate for sunflower seed is 500 300 ha, which is 2,92% or 15 050 ha less than
the 515 350 ha planted the previous season. The production forecast for sunflower seed is 765 960 tons, which
is 12,97% or 87 960 tons more than the 678 000 tons of the previous season. The expected yield is 1,53 t/ha.
It is estimated that 705 000 ha have been planted to soybeans, which represents a decrease of 3,49% or
25 500 ha compared to the 730 500 ha planted last season. The production forecast is 1 261 250 tons, which is
7,77% or 90 905 tons more than the 1 170 345 tons of the previous season. The expected yield is 1,79 t/ha.
For groundnuts, the area estimate is 37 500 ha, which is 87,03% or 17 450 ha more than the 20 050 ha
planted for the previous season. The expected crop is 52 140 tons – which is 168,76% or 32 740 tons more
than the 19 400 tons of last season. The expected yield is 1,39 t/ha.
The area estimate for sorghum decreased by 15,84% or 8 000 ha, from 50 500 ha to 42 500 ha against the
previous season. The production forecast for sorghum is 133 660 tons, which is 5,24% or 6 660 tons more than
the 127 000 tons of the previous season. The expected yield is 3,14 t/ha.
RSA Food Security Bulletin – June 2020
4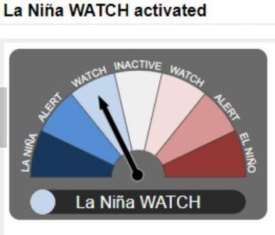
For dry beans, the area estimate is 50 150 ha, which is 15,43% or 9 150 ha less than the 59 300 ha planted for
the previous season. The production forecast is 68 860 tons, which is 3,78% or 2 505 tons more than the
66 355 tons of the previous season. The expected yield is 1,37 t/ha.
Please note that the fifth production forecast for summer field crops for 2020 will be released on 29 July 2020.
2.2 Winter cereal crops - 2019
Please note that the preliminary are planted to winter cereals for 2020 will also be released on 29 July 2020.
2.3 Non-commercial maize
The CEC also released the preliminary area planted and production estimate of the non-commercial maize sector on
27 May 2020:
Table 3: Non-commercial maize: Preliminary area planted and production estimate - 2020 season
CROP Area planted Production Area planted Final crop Change
2020 2020 2019 2019
Ha Tons Ha Tons %
(A) (B) (C) (D) (B) ÷ (D)
Non-commercial agriculture:
White maize 221 945 375 295 221 300 379 460 -1,10
Yellow maize 75 515 168 250 74 700 169 720 -0,87
Maize 297 460 543 545 296 000 549 180 -1,03
The preliminary area planted to maize in the non-commercial agricultural sector is estimated at 297 460 ha,
which represents a slight increase of 0,49%, compared to the 296 000 ha of the previous season. The expected
maize crop for this sector is 543 545 tons, which is 1,03% less than the 549 180 tons of last season. It is
important to note that about 40% of the maize produced in the non-commercial sector, is planted in the Eastern
Cape, followed by KwaZulu-Natal with 27%.
3. Cereal balance sheets
For the latest Cereal Balance Sheets (supply and demand tables) on maize, wheat, sorghum, sunflower seed and
soybeans please refer to the attachment called FSB JUNE20 Annexure A.
3.1 Imports and exports of wheat for the 2019/20 marketing year
Graph 1: Major countries of wheat imports to South Africa: 2019/20 marketing year
RSA Food Security Bulletin – June 2020
5 The progressive wheat imports (human consumption) for the 2019/20 marketing year (28 September 2019 to
26 June 2020) amount to 1 512 755 tons, with 31,27% or 472 993 tons from Poland, 20,72% or 313 450 tons
from the Russian Federation, 17,96% or 271 707 tons from Germany, 13,39% or 202 603 tons imported from
Lithuania, 3,62% or 54 803 tons from Latvia, 3,52% or 53 199 tons from Ukraine, 3,46% or 52 365 tons from
the Czech Republic, 3,44% or 52 025 tons from Canada, 1,45% or 21 878 tons from Finland and 1,17% or
17 732 tons from the United States. The exports of wheat (human consumption) for the above-mentioned
period amount to 66 450 tons, of which 52,43% or 34 843 tons to Zambia, 39,16% or 26 024 tons went to the
BLNS countries (Botswana, Lesotho, Namibia and Swaziland (Eswatini)) and 8,40% or 5 583 tons went to
Zimbabwe.
3.2 Exports of white and yellow maize
Graph 2: Exports of South African white and yellow maize for the 2010/11 to 2020/21 marketing year
*Projection
The exports of white maize for the 2020/21 marketing year are projected at 1,270 million tons, which
represents a decrease of 0,43% or 5 446 tons compared to the 1,275 million tons of the previous marketing
year. Yellow maize exports for the mentioned period are projected at 1,390 million tons, which represents an
increase of 160,24% or 855 873 tons compared to the 534 127 tons of the previous marketing year.
Graph 3: Major countries of white maize exports from South Africa: 2020/21 marketing year
From 25 April to 26 June 2020, progressive white maize exports for the 2020/21 marketing year amount to
162 299 tons, with the main destinations being Zimbabwe (54,26% or 88 065 tons), followed by Botswana
RSA Food Security Bulletin – June 2020
6(22,51% or 36 535 tons), Namibia (8,36% or 13 579 tons), Mozambique (7,93% or 12 872 tons), Lesotho
(3,97% or 6 445 tons) and Eswathini (Swaziland) (2,96% or 4 812 tons). The imports of white maize for the
mentioned period amount to zero.
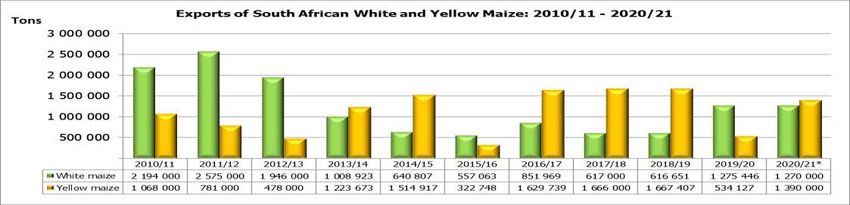
Graph 4: Major countries of yellow maize exports from South Africa: 2020/21 marketing year
From 25 April to 26 June 2020, progressive yellow maize exports for the 2020/21 marketing year amount to
316 778 tons, with the main destinations being Korea, Republic of (35,28% or 111 764 tons), followed by
Taiwan, Province of China (33,60% or 106 450 tons), Japan (14,13% or 44 775 tons), Zimbabwe (4,65% or
14 736 tons), Eswathini (Swaziland) (4,54% or 14 382 tons), Botswana (3,85% or 12 194 tons), Namibia
(2,13% or 6 733 tons), Mozambique (1,61% or 5 107 tons) and Lesotho (0,20% or 637 tons). The imports of
yellow maize for the mentioned period amount to zero.
4. Market information
4.1 Consumer Price Index (CPI)
Annual consumer price inflation was 3,0% in April 2020, down from 4,1% in March 2020, the lowest since June
2005 when the rate was 2,8%. The consumer price index decreased by 0,5% month-on-month in April 2020.
The main contributors to the 3,0% annual inflation rate were as follows:
Food and non-alcoholic beverages increased by 4,4% year-on-year, and contributed 0,7% to the total
CPI annual rate of 3,0%;
Housing and utilities increased by 4,6% year-on-year, and contributed 1,1%;
Transport decreased by 3,5% year-on-year, and contributed -0,5%; and
Miscellaneous goods and services increased by 6,4% year-on-year, and contributed 1,0%.
The annual inflation rates for goods and services were 1,7% and 4,1%, respectively.
Provincial annual inflation rates ranged from 2,4% in Eastern Cape to 3,6% in Western Cape.
4.2 Producer Price Index (PPI)
Annual producer price inflation (final manufacturing) was 1,2% in April 2020, down from 3,3% in March 2020.
The producer price index decreased by 0,7% month-on-month in April 2020.
The main contributors to the headline PPI annual inflation rate were as follows:
Food products, beverages and tobacco products increased by 3,0% year-on-year and contributed 1,0%
point; and
Transport equipment increased by 9,2% year-on-year and contributed 0,9%.
RSA Food Security Bulletin – June 2020
7 The main contributor to the headline PPI monthly decrease was coke, petroleum, chemical, rubber and plastic
products, which decreased by 3,9% month-on-month and contributed -0,8%.
The annual percentage change in the PPI for intermediate manufactured goods was 1,3% in April 2020
(compared with 0,0% in March 2020). The index increased by 2,3% month-on-month. The main contributors to
the headline PPI annual inflation rate were basic and fabricated metals (3,8%). The main contributors to the
monthly rate were basic and fabricated metals (1,5%), as well as chemicals, rubber and plastic products (0,7%).
The annual percentage change in the PPI for electricity and water was 15,5% in April 2020 (compared with
15,0% in March 2020). The index increased by 6,3% month-on-month. Electricity contributed 14,3% to the
annual rate, and water contributed 1,2%. Electricity contributed 6,0% to the monthly rate, and water
contributed 0,4%.
The annual percentage change in the PPI for mining was 43,9% in April 2020 (compared with 42,6% in March
2020). The index increased by 2,7% month-on-month. The main contributors to the annual rate were non-
ferrous metal ores (30,3%), as well as gold and other metal ores (10,9%). The main contributor to the monthly
rate was gold and other metal ores (3,3%).
The annual percentage change in the PPI for agriculture, forestry and fishing was 3,5% in April 2020 (compared
with 2,0% in March 2020). The index decreased by 0,3% month-on-month. The contributors to the annual rate
were agriculture (2,7%), fishing (0,6%), as well as forestry (0,2%). The main contributor to the monthly rate
was agriculture (-0,3%).
4.3 Future contract prices
Table 4: Closing prices on Thursday, 2 July 2020
2 July 2020 2 June 2020 % Change
RSA White Maize per ton (July 2020 contract) R2 608,00 R2 394,00 8,94
RSA Yellow Maize per ton (July 2020 contract) R2 723,00 R2 513,00 8,36
RSA Wheat per ton (July 2020 contract) R5 385,00 R5 287,00 1,85
RSA Sunflower seed per ton (July 2020 contract) R5 892,00 R5 635,00 4,56
RSA Soya-beans per ton (July 2020 contract) R6 900,00 R6 432,00 7,28
Exchange rate R/$ R16,92 R17,27 -2,03
Source: JSE/SAFEX
4.4 Agricultural machinery sales
May 2020 tractor sales of 432 units were significantly more (19%) than the 364 units sold in May 2019. On a
year-to-date basis tractor sales are now 9% down on the same period last year. May 2020 combine harvester
sales of 31 units were four units more than the 27 units sold in May 2019. On a year-to-date basis combine
harvester sales are now almost 10% up on the same period last year.
There are two main reasons for the better than expected May agricultural machinery sales. Firstly, farmers are
buying up existing stock at current price levels, ahead of the inevitable price increases which will prevail as a
result of the weaker rand. Secondly, the good crops which are currently being harvested. Overall sentiment in
the market continues to be positive. It is likely that sales will be good in the near future as lower-priced stock is
bought up. However, current industry sentiment is still that 2020 tractor sales will probably be up to 10% down
on 2019.
Table 5: Agricultural machinery sales
Year-on-year Percentage Year-to-date Percentage
May Change May Change
2020 2019 % 2020 2019 %
Equipment class
Tractors 432 364 18,68 2 099 2 310 -9,13
Combine harvesters 31 27 14,81 100 91 9,89
Source: SAAMA press release, June 2020
PLEASE NOTE: The Food Security Bulletin for July 2020 will be released on 5 August 2020.
RSA Food Security Bulletin – June 2020
85. Acknowledgements
The Directorate: Statistics and Economic Analysis makes use of information sourced from various institutions
and organisations within South Africa in order to compile the monthly report on South Africa’s Food Security
Situation. This report has been compiled with the aid of information and reports sourced from the following
institutions and organisations:
Agbiz
Agfacts
BVG Commodities (Pty) Limited
Department of Water and Sanitation
Directorate: Climate Change and Disaster Management at DAFF
Farmer’s Weekly
Grain South Africa (GrainSA)
IGC Grain Market Report
National Agricultural Marketing Council (NAMC)
South African Agricultural Machinery Association (SAAMA)
South African Futures Exchange (SAFEX)
South African Reserve Bank
Statistics South Africa (Stats SA)
The South African Supply and Demand Estimates Report (SASDE)
The South African Grain Information Service (SAGIS)
The South African Weather Service (WeatherSA)
USDA Foreign Service
RSA Food Security Bulletin – June 2020
9You can also read