In Search of a Timeline Software - For Teaching History A GUTS project
←
→
Page content transcription
If your browser does not render page correctly, please read the page content below
In Search of a Timeline Software
        For Teaching History

           A GUTS project

                               Adnan Adam Onart
                               aonart@gmail.com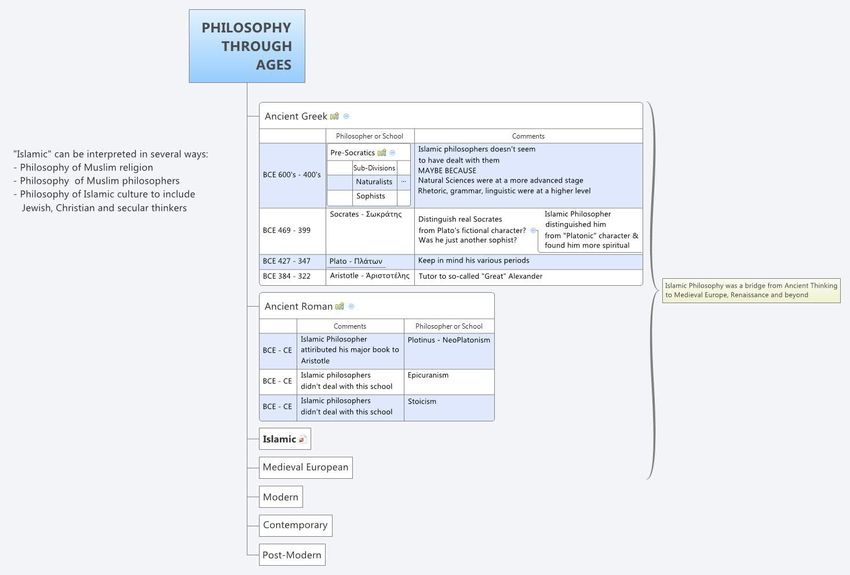
The Motivation for the Project
 The motivation for this project, or the need to search for a software to plot timelines stems from
 HI 480 Panorama of Islamic Ideas, a course offered by the history department of Metropolitan
 College every fall semester that covers the religions, cultures and civilizations of Middle-
 Eastern area with special attention to Islam.

 While teaching this course since 2009, I have been resorting to an exceptionally flexible, “mind
 map” software (XMind ) to represent diverse data structures and information organizations
 related to my topics:

 ●   Ideas networks
 ●   Tribe and clan formations
 ●   Family trees
 ●   Interpersonal relations and many others

 This capability was anchored in the many abstract structures supported by Xmind:

 ●   Map
 ●   Tree
 ●   Organization chart
 ●   Logical chart
 ●   Fish bones
 ●   Spreadsheet

 Unfortunately none of these structures are a good fit for representing “timelines” that are
 important to history teaching.
June 2012                                      Adnan A. Onart                                         2
XMind: Idea Networks
  An example for Idea Network plotted by using XMIND in the forms of questions as well
  as associations related to the inquiry “What is history?” Note that the numbers
  (“Markers” assigned to main topics suggest an order in the coverage of elements.

For this kind of data the best structure to use is the “MAP” with its possible free floating
topics and various formatting capabilities.

  June 2012                                 Adnan A. Onart                                     3
XMind: Tribes and Clans
 An example for a social formation depicting the Prophet, Muhammad's tribe, Quraysh
 and its clans. The names in bold highlights the most relevant people to the history of
 Islam.

 As intuitively expected the “Organizational Chart” is the best fit for depicting the social
 formations of different kind. Note that the tool supports different styles in the look of the
 graphs.
June 2012                                Adnan A. Onart                                          4
XMind: Family and its Extensions
                                                         An example for the representation of an
                                                         extended family – people closely associated
                                                         with the Prophet. Yellow color indicates the four
                                                         rightly guided caliphs. The shape of the figures
                                                         depicts different genders.

The arrows in this charts are not lines or
edges in the abstract graph-theoretical
sense, but “relations” which support
annotations, that are very handy to depict
the actual relations among the people in
the chart.

 June 2012                                   Adnan A. Onart                                                  5
XMind: Not a good fit for timelines
Despite its exceptional flexibility in representing diverse data structures or concepts,
Xmind falls short when it comes to the representation of the timelines which is
essential to the teaching of history.

One possible representation of the timeline within Xmind could be a combination of
“fishbone” graphs and “spreadsheets.” But the short comings of this approach should
be obvious:

● Difficulty of creating the graph
● No scrolling along the timeline

● No time-based zooming

● Unability to combine multiple timelines

June 2012                               Adnan A. Onart                                     6
XMind: Time-flow as a fishbone
The fishbone diagram below represents
the chronological flow of the discussion
about the methods to be used in history:
the “explanation versus understanding”
controversy. It is a combination of relative
positioning in time and logical grouping of
different philosophical stands.

                                                                The chart doesn't represent any
                                                                “date” explicitly, more importantly it
                                                                doesn't support any time base
                                                                interactivity such as scrolling or
                                                                zooming.
June 2012                                      Adnan A. Onart                                            7
XMind: Spreadsheets a better option for timelines
Spreadsheet charts of XMind are relatively good in representing
simple chronological data. It permits zooming in and zooming out
based on the logical organization, but time based zooming can be
emulated by using a hyperlink to another XMind workbook.
In the chart above, the node representing “Islamic”
philosophy hosts a hyperlink to another workbook that
contains a spreadsheet depicting the history of the
“Islamic” philosophy – to this extent, we have a primitive
form of time based zooming.
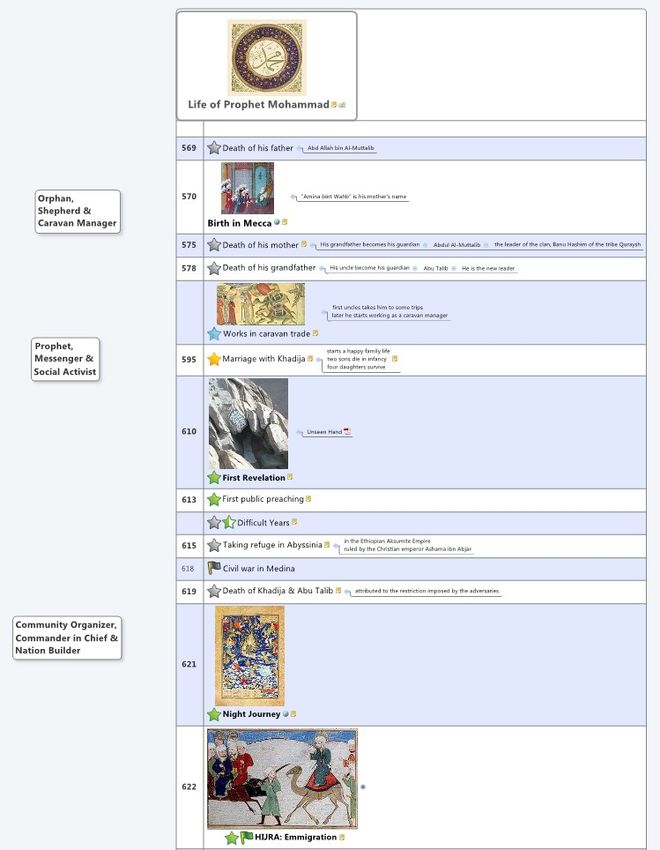
June 2012 Adnan A. Onart 8XMind: Spreadsheet – Take 2 The clip in this slide demonstrates another example of trying to use XMind spreadsheet as a basis for timelines. In this case, we have a combination of spreadsheet with the “map” structure in order to manage the details related to specific events or people. The embedded images hints to the ease in including pictures in Xmind with the capabilities to zoom in using the hyperlink feature. June 2012 Adnan A. Onart 9
The Goal of the Project

The goal of the project is
identifying a software that would
be a fit better than XMind in          Examples for software for
plotting timelines while teaching      plotting timelines:
history.

                                        ●      Timeglider
The student recruited for the
project will make a quick survey        ●      Timeline Maker
of the applications available to        ●      Microsoft Vision
this effect and after making at
least a cursory evaluation.             ●      Simile
                                        ●      Tiki-toki
                                        ●      VUE
June 2012                     Adnan A. Onart                       10
Deliverables of the Project
● A short report summarizing the results of the studies
● Some minimal documentation for the usage of the
recommended software
● Simple timelines to illustrate “seriously” considered
applications
● 3-5 timelines created using the selected software and that
can be readily used in teaching HI 480 during the 2012
FALL Semester.
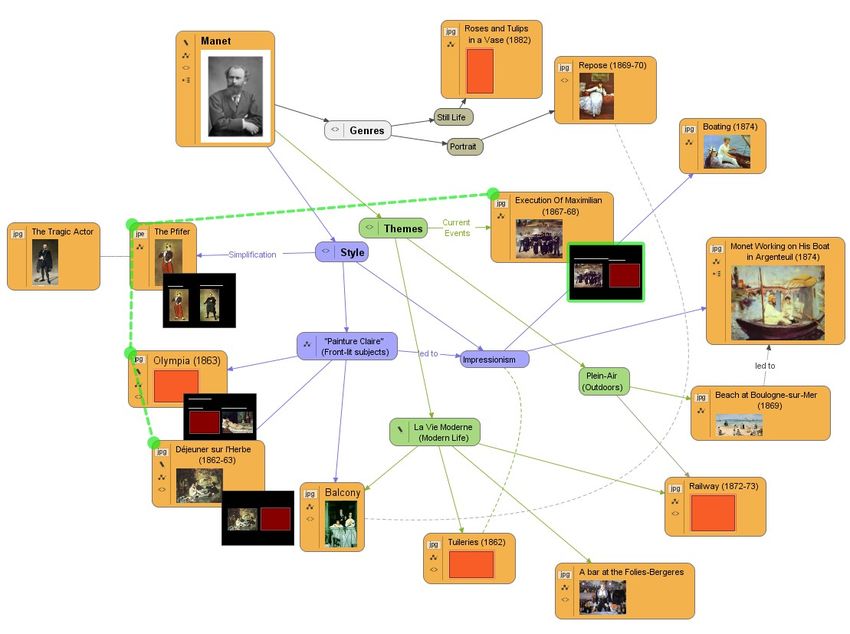
June 2012 Adnan A. Onart 11VUE “The Visual Understanding Environment (VUE) is an Open Source project based at Tufts University. The VUE project is focused on creating flexible tools for managing and integrating digital resources in support of teaching, learning and research. VUE provides a flexible visual environment for structuring, presenting, and sharing digital information. “ Given the comprehensive function of the tool, with some explicit conventions, it could be used to plot timelines. Work of Monet, with its “date” information for selected nodes, could be transformed to a chronological representation. The “SEMANTIC WEB” or “ontology support of VUE appears to be a powerful aspect to take into account June 2012 Adnan A. Onart 12
Timeglider

Timeglider is a WEB based timeline plotting service with different level of
subscription structure. The company defines its mission as follows: To revolutionize
time keeping, planning, and the experience of history with a vehicle for exploring time
that feels rugged, subtle, and profoundly easy to use.

In addition to scrolling back and forth along the time-flow, timeglider also supports
zoom-in and zoom-out features.
June 2012                               Adnan A. Onart                                    13
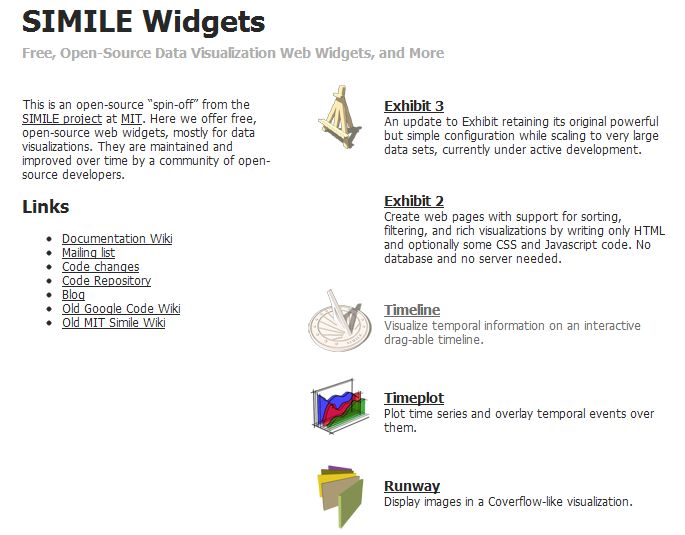
SIMILE PROJECT

SIMILE Widgets are software artifacts developed originally within MIT's SIMILE
project, but now maintained and improved by a community of open-source
developers.

 The purpose of SIMILE widgets
 is the visualization of different
 kinds of data

June 2012                             Adnan A. Onart                             14
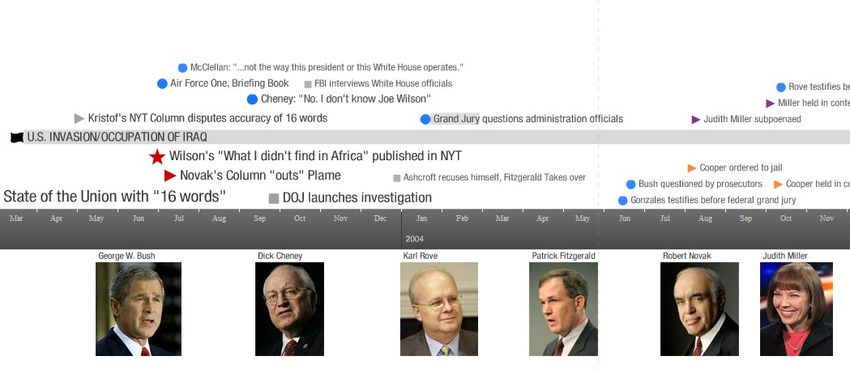
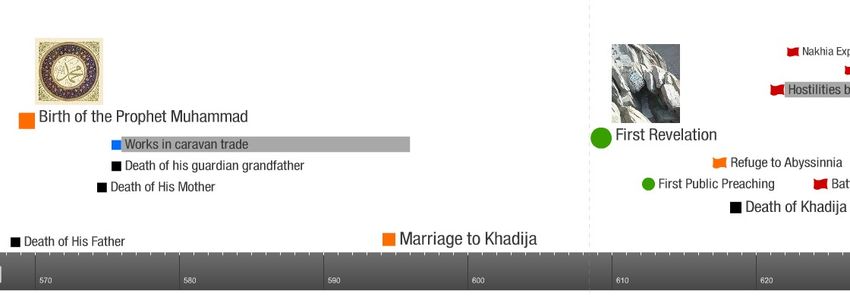
SIMILE – Timeline Widget
This is a WEB based tool developed for the visual representation of timelines. The
Widget supports easy scrolling, multiple time bands, inclusion of pictures.

  Timeline Widget takes advantages of the power of various WEB technologies such
  as XML, Javascript, AJAX, etc.

June 2012                             Adnan A. Onart                                 15
Research-Student

 ●   Alpha Sanneh
 ●   Took HI 480 course
 ●   Up to speed with the topics to be plotted
 ●   Fluent in multiple WEB technologies
      ●     HTML, CSS, PHP, Phyton
      ●     C++, Java
      ●     Oracle, MySQL, FileMaker, Access
      ●     MS-Visio, Office, Peoplesoft

June 2012                      Adnan A. Onart    16
What was accomplished?
● Recommendation for Software Selection
● Summary of the software evaluations
● A local SIMILE example for the Life of the
Prophet
● Getting Started notes for local example
● Sample files
June 2012 Adnan A. Onart 17Recommendation
● SIMILE widget for technically savy users –
because of its
● Technological foundation
● Clean content and representation distinction
● Flexibility and extensibility
● Timeglider for technically shy users – because
of its
● Ease of use in development
● Ease of use in interactive usage
● Ease of collaborative work
June 2012 Adnan A. Onart 18Side by Side
SIMILE
TIMEGLIDER
June 2012 Adnan A. Onart 19Next Steps
● Augment Life of the Prophet timeline for the Fall
Semester course as a basis for other historical
topics
● History of Judaism
● History of Christianity
● History of Islam
● Middle-East in overview
● Update the summary slides
● Extend the Gettings Started Notes for
● Implementation details
●
June 2012
Online deployment Adnan A. Onart 20LINKS
● XMind
● http://www.xmind.net/
● VUE:
● http://vue.tufts.edu/index.cfm
● TIMEGLIDER
● http://timeglider.com/
● SIMILE Widgets
● http://www.simile-widgets.org/timeline/
June 2012 Adnan A. Onart 21You can also read