Comparing the awarded grades in June 2020 with other calculations - ASCL
←
→
Page content transcription
If your browser does not render page correctly, please read the page content below
Comparing the awarded grades in June 2020 with other calculations
Overview
The normal process used by Ofqual exam boards to calculate national grade distributions in
each subject each year (maintaining comparable outcomes) is similar to, but subtly different
from the perspective of schools when considering the grades in terms of the progress made by
individual pupils and the school as a whole. This arises from their different roles and
responsibilities. This document explains how the usual national approach has been adapted to
create the standardisation model, and how it is fundamentally similar to the familiar subject
transition matrices approach, but also where there will be inevitable differences.

Information about the Ofqual and exam board standardisation model
The broad outline was described in slide 18 of the Ofqual Summer Symposium (Tues 21 July)
and the follow-up blog.

The approach adopted is the Direct Centre-level Performance (DCP) approach.

"Previous years"
Ofqual published a blog on 15 May which gave more information at that point about the
methodology which was going to be adopted. In particular, it said:

  "For AS/A levels, the standardisation will consider historical data from 2017, 2018 and 2019.
  For GCSEs, it will consider data from 2018 and 2019, except where there is only a single
  year of data from the reformed specifications. The model will accommodate those centres for
  whom there is not this many years of data available."

Comparison with the ASCL subject Transition Matrices approach and Toolkit
From Centre-assessed Grading 2020: Technical guidance
From Step by step approach to allocating grades using ASCL approach

and then further down on page 1:

Overall steps for each subject
   1. From the KS2 prior attainment of those entered, use the 2019 DfE Subject Transition
      Matrices to calculate a "starting grade distribution" for June 2020, with its average grade
      and % 9-4
   2. The school would state the subject VA for 2018 and 2019, giving details of the
      methodology / provider, and then take the average to use in the 2020 calculations. This
      figure is entered manually in the spreadsheet.
   3. The spreadsheet then calculates what the distribution of grades would be for June 2020
      which would give that specified subject VA figure (assuming uniform VA across the prior
      attainment range). The average grade increases by the VA figure
   4. The school can modify the grade distribution to fit the exact pattern of its pupils,
      PROVIDED that the average grade and the % 9-4 remain the same. This will maintain
      the necessary national consistency. Schools should consider the % 9-7.

                                               2
Infographic of ASCL approach

More about the calculations in the Ofqual standardisation model and the information
being sent to centres on the Wednesday, the day before Results Day
To the right is how the additional subject level
information may be sent through by the exam
board for each subject. The columns may not
be in this order, but it is worth re-ordering,

Also, calculate and add in an extra set of
numbers for any additional national and centre-
level adjustments as below, in red.

You will see that in the example on the right, the
percentages in each row in
the first three sets of data
add up to the percentage in
the "calculated grades" set
e.g. for grade 6 (in green),
15.7% - 2.0% - 3.3% =
10.4%

Note that exam boards
usually work in terms of
cumulative percentages,
which can then be expressed
in terms of percentages

                                                   3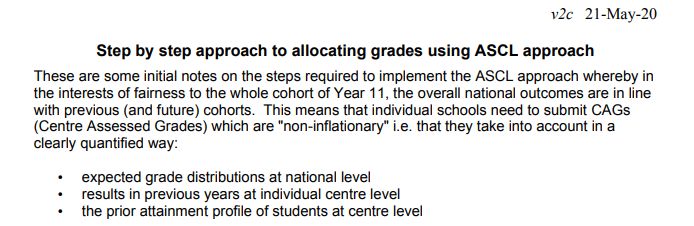
getting a particular grade. Do be aware that because the percentages must add up to 100%, an
increase in one grade will carry through in the cumulative percentages until there is a
corresponding reduction. Stacked column graphs are very helpful for demonstrating this.

"Historical data"
Although this is presented as a single set of data, it will have
been generated from the relevant number of previous years,
typically two years for GCSE and three for A-level. The total
number of students may well be different from the number
for 2020.

"Prior attainment adjustment"
This accounts for any change in prior attainment between
the years for the historical data and for 2020 and is
expressed in terms of changes to the percentage of output
grades. Overall, these must add to 0.

"National and centre-level adjustment"
This may well not be in the information sent out by the exam
boards but is worth calculating as the difference between
the calculated grade percentage and the sum of the
historical data and the prior attainment adjustment. This will
include any changes made at a national level in a particular
subject to maintain comparable outcomes (and any changes resulting from the National
Reference Test) as well as the GCSE ML adjustment in French and German. At a centre level
this will deal with particular cases such as very small numbers etc where the CAGs are given
greater weight. Overall, these must add to 0.

"Calculated grades"
These are the percentages actually awarded and should match the figures from the individual
pupil lists.

"CAGs"
These are the percentages from the grades submitted and should match the figures from the
individual pupil lists.

How do the two different methodologies compare?
Although these are two different methodologies, they should in fact give similar answers in most
cases because the underlying principles are the same of using national subject figures, prior
attainment and centre-level previous years' results.

The easiest way to understand this is to consider the simplest scenario in a typical subject, and
then see the effect of changing each assumption. For convenience, in all the examples below,
we assume no national or centre level adjustment.

1. "start" begin with the situation where the KS2 prior attainment profile of the pupils and their
GCSE outcomes have remained static with zero value-added across three years (2018 and
2019 for previous years, and then calculated for 2020). In this case:
      Ofqual standardisation: by construction, the historical outcomes (2018 and 2019) match
      those in 2020, and there will be no prior attainment adjustment, because the profile
      remains the same, and we assume no national adjustment, so the calculated outcomes
      are those they should be
      ASCL TM approach: putting the 2018 and 2019 outcomes into the TMs gives zero value-
      added, by construction, and repeating it in 2020 will have the same outcome from the TM
      calculation i.e. zero value added.
      Note that this argument works for any KS2 prior attainment distribution.

                                                  4
2. change in prior attainment in 2020: Now suppose that the KS2 prior attainment distribution
in 2020 becomes skewed towards the upper end (i.e. more Level 5 and fewer Level 4) relative
to that in 2018 and 2019, but VA remains zero in all three years. In this case:
Ofqual standardisation: there will be a positive prior attainment adjustment for the
higher grades, because there are more KS2 Level 5, so the calculated outcomes increase
at the higher grades
ASCL TM approach: putting the higher KS2 prior attainment distribution into the TM will
automatically give an increase in higher grades
3. VA was positive in 2018 and 2019 (and same reasoning applies for any combination of VA
incl negative VA), but prior attainment profile stays the same
Ofqual standardisation: if the VA was higher in 2018/19, then the grades obtained will
be higher, and so the historical data will be correspondingly higher. There is no prior
attainment adjustment, leading to the 2020 calculated grades being higher
ASCL TM approach: putting the same KS2 prior attainment distribution into the TM will
give the zero VA grade distribution, but then adding in the VA from 2018/19 will increase
the grade distribution correspondingly.
Particular differences between approaches
There are some small technical differences between the two approaches which do not lead to a
systematic variation across all schools but will lead to individual schools getting small
mismatches in some subjects, and indeed, these may balance out. These differences for KS2
and matched pupils are ones which apply in a normal year and are not a particular feature of the
standardisation model. Also see Annex 1 for more information
KS2:
Exam boards use the marks in the Reading and Maths tests, which are then normalised and
combined.
ASCL TMs: DfE have a complex flowchart (published in their Performance Tables Guidance)
which ASCL replicated, which starts from the marks in the Reading and Maths tests, converts
them to fine scores in Reading and Maths and then combines them, but also uses Teacher
Assessment information if Test results not available.
Matched pupils:
Exam boards: see pp13-15 in Requirements for the calculation of results in summer 2020 for
the matching criteria.
ASCL TMs: DfE do extensive work to track pupils and then match their KS2 results to their
GCSE, and similarly at AL
uniform VA v grade-specific VA + anchor & arithmetic grades
Exam boards: the calculations are grade-specific in the standardisation model working off
cumulative percentages. Normally, it is only the anchor points 7/A, 4/C, 1/G and 9 as a special
case which are used to set the marks for the grade boundaries, and then the intermediate
grades boundaries are calculated arithmetically as equal mark dividers, without formal
consideration of the percentages obtaining each grade
ASCL TMs: the ASCL Toolkit used uniform VA as its input in order to make it easier for schools
to obtain and use figures. Using grade-specific VA did slightly increase accuracy but not by
enough to make it worth introducing. TMs always look at each grade and give a VA score for
each KS2 input value and for each GCSE grade output, as well as an overall score. Schools
are now very focussed on average grades, having moved away from an accountability induced
focus on thresholds, whereas exam boards have a defined statutory duty to focus on
maintaining standards which are defined by cumulative percentages at thresholds
5Annex 1 - Technical information
"Requirements for the calculation of results in
summer 2020"
This very technical document was issued on 7 July, with
a number of Annexes, specifying the information to be
supplied and used by the exam boards. It refers to the
Prediction Matrices and specified that these were to be
derived from the first two years after reform where
possible. This has caused some confusion, as these
are national matrices for each subject which translate
from prior attainment at a national level for each board
to use; they are not the historical data used for each
centre.
Annex E is embargoed until results day as it contains
the fine details which might enable a school or
candidate to know their result in advance of others.
GCSEs and A Levels in Summer 2012
Prediction matrices
Comparable outcomes
"Our approach to setting and maintaining standards" Ofqual, Summer 2012
1. Note that some of these documents date from when Science was included in the KS2
input value.
2. There is a particular issue regarding AL Transition Matrices for 2020, because the input
variable is the average GCSE score. The published DfE subject TMs had as input
GCSE from 2017 when only English and maths had transitioned and were on 9-1 score,
and the other GCSEs were on 8.5-1. But for AL in 2020, the GCSEs were taken in 2018
when almost all GCSEs had transitioned to 9-1. So it is very difficult to use the 2019
TMs. Whereas for GCSE, there was stability between 2014 and 2015 at KS2, and so it
has been possible to use the 2019 GCSE TMs.
Ofqual video explaining approach
These are the matrices used by the exam boards to calculate in any year for each subject how
many of each grade should be allocated, to take into account any changes in prior attainment
6Research in 2013-14 on the use of KS2 data in prediction matrices
Exploring the value of GCSE prediction matrices based upon attainment at Key Stage 2
Tom Benton and Tom Sutch
Cambridge Assessment Research Report 20th May 2013
https://www.cambridgeassessment.org.uk/Images/181034-exploring-the-value-of-gcse-
prediction-matrices-based-upon-attainment-at-key-stage-2.pdf
Analysis of use of Key Stage 2 data in GCSE predictions
Tom Benton and Tom Sutch
UCLES ARD Research Division
https://assets.publishing.service.gov.uk/government/uploads/system/uploads/attachment_data/fi
le/429074/2014-06-16-analysis-of-use-of-key-stage-2-data-in-gcse-predictions.pdf
Appendix 1 has description of how year-on-year KS2 variances are taken into account
7You can also read