Efficacy of S-metolachlor Based Herbicide Programs for Flue-Cured Tobacco - CORESTA
←
→
Page content transcription
If your browser does not render page correctly, please read the page content below
2020_TWC22_Bradley.pdf
Efficacy of S-metolachlor Based Herbicide
     Programs for Flue-Cured Tobacco

                            Art Bradley
                          County Director

                                                                        TWC2020(49) - Document not peer-reviewed
               Edgecombe County Cooperative Extension

  Matthew Vann, Charlie Cahoon, David Jordan, Matt Inman & Drew Clapp
        Department of Crop & Soil Sciences – NC State University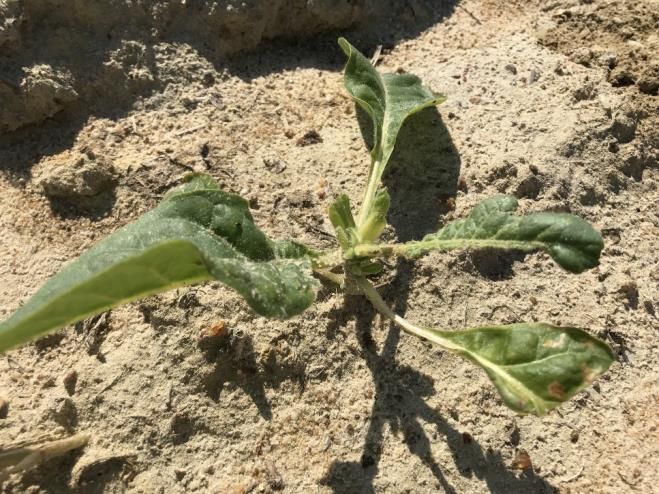
2020_TWC22_Bradley.pdf
            Presentation Outline
• Introduction and
  Objectives
• Methods and Materials
• Results and Discussion

                                   TWC2020(49) - Document not peer-reviewed
• Conclusions
• Questions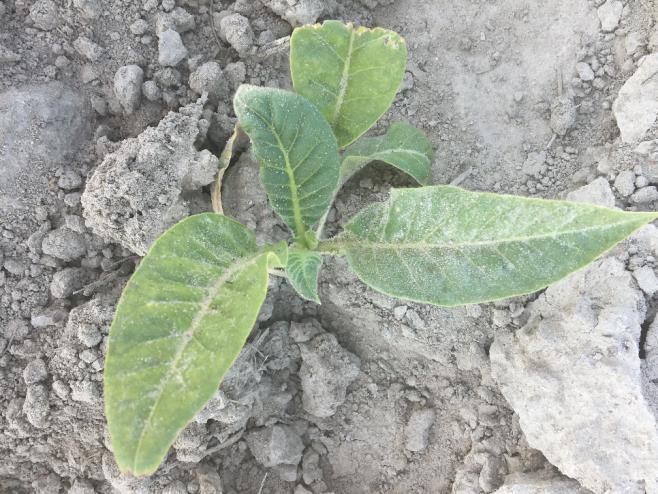
2020_TWC22_Bradley.pdf
                           Introduction
• Herbicide options are limited for US flue-cured tobacco production
    – Seven ai’s are labeled, which represent six MOA’s (Vann et al. 2017)
    – Two ai’s (sulfentrazone & clomazone) are applied to >65% of the
      tobacco hectares annually

• Additional chemical weed control options would benefit resistance

                                                                             TWC2020(49) - Document not peer-reviewed
  management
    – Concern with PPO resistance (Amaranthus sp.) in the Coastal Plain
      growing region (DJ Mahoney personal communication)
    – ALS and EPSP resistance in rotational crops, which increases general
      weed pressure in tobacco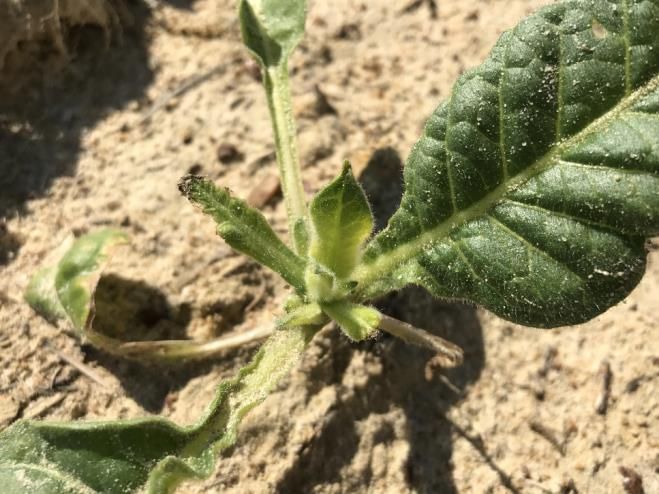
2020_TWC22_Bradley.pdf
                                      Introduction
•   S-metolachlor is a long chain fatty acid inhibitor (WSSA group 15) that provides
    residual control of problematic weed species, such as:
     –   Palmer amaranth (Amaranthus palmeri) (Meyers et al. 2010; Whitaker et al. 2010)
     –   Yellow nutsedge (Cyperus esculentus) (Grichar et al. 2008; Dayton et al. 2017)
     –   Certain annual grass species (Digitaria sanguinalis, Brachiaria platyphylla) (Clewis et al. 2008)

•   S-metolachlor is widely used for residual preemergence weed control in a

                                                                                                             TWC2020(49) - Document not peer-reviewed
    number of agronomic and vegetable crops (Zemolin et al. 2014)

•   Used in tobacco growing regions outside of the United States (Bailey, 2013;
    Vann et al., 2018)
•   Labeling S-metolachlor for tobacco production in the USA could prove
    beneficial
     –   Strong need to identify potential use patterns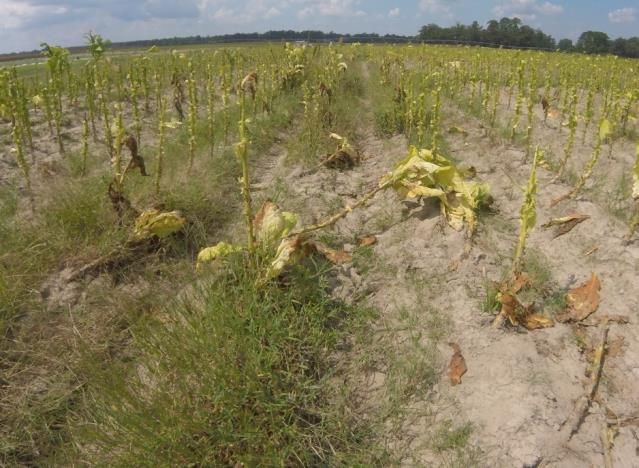
2020_TWC22_Bradley.pdf
                     Objectives

• Compare established herbicide programs with and
  without the inclusion of S-metolachlor.

                                                            TWC2020(49) - Document not peer-reviewed
• Generate efficacy and tolerance data that could support
  a federal label for US tobacco production.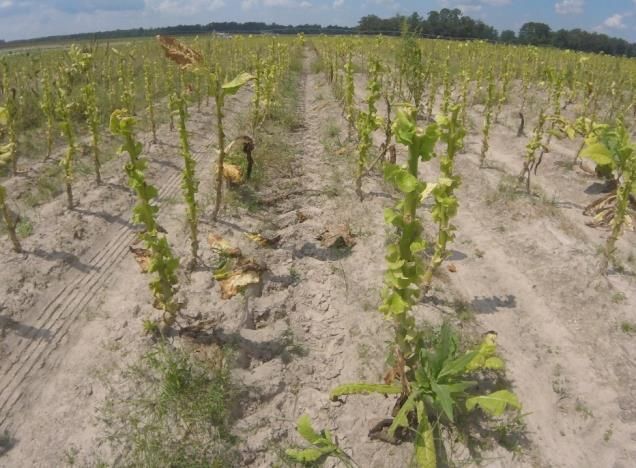
2020_TWC22_Bradley.pdf
Methods and Materials
• Experimental Design: randomized complete block design with three
or four replications, depending on growing environment
• Plot sizes were 4 rows by 15.24 meters
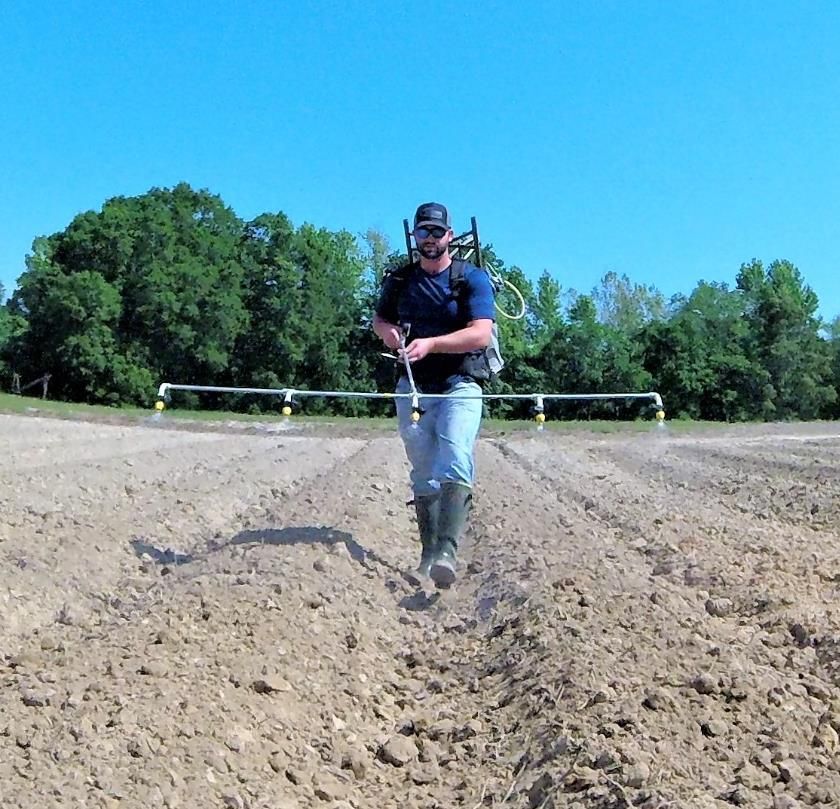
• Herbicides were applied with a backpack sprayer calibrated to
deliver 187 L ha-1 of spray solution
TWC2020(49) - Document not peer-reviewed
– Application pressure was 173 kPa for all PTI and POST-OT treatments
– Application pressure was 241 kPa for all POST-DIR treatments
• Center two rows of plots were used for harvest and data collection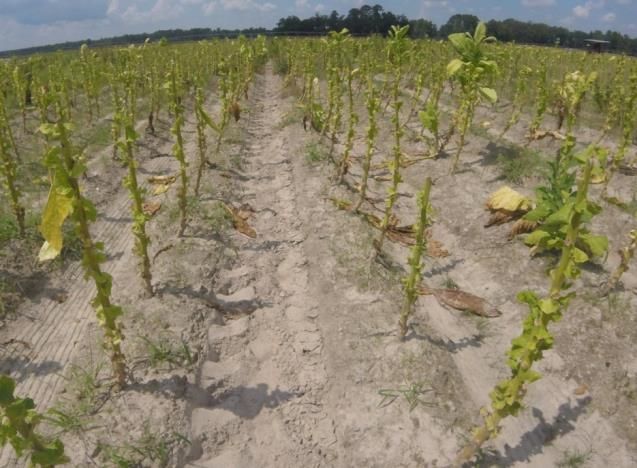
2020_TWC22_Bradley.pdf
                     Methods and Materials
•   Visible estimates of percent weed control were recorded at 2, 6 and 9 weeks after
    transplanting (WAT), and at end of growing season
      – Percent visual weed control scale: 0 to 100, where 0 = no control and 100 =
         complete control
      – Species specific ratings were recorded in 2018

•   Visible estimates of percent crop injury were recorded at 2 and 6 weeks after
    transplanting

                                                                                           TWC2020(49) - Document not peer-reviewed
      – Percent stunting scale: 0 to 100 where 0 = no stunting and 100 = plant death

•   Plant heights of 10 randomly selected plants per plot were measured at 6 weeks after
    transplanting

•   Weights of cured leaf from each plot were recorded for each harvest position to
    determine yield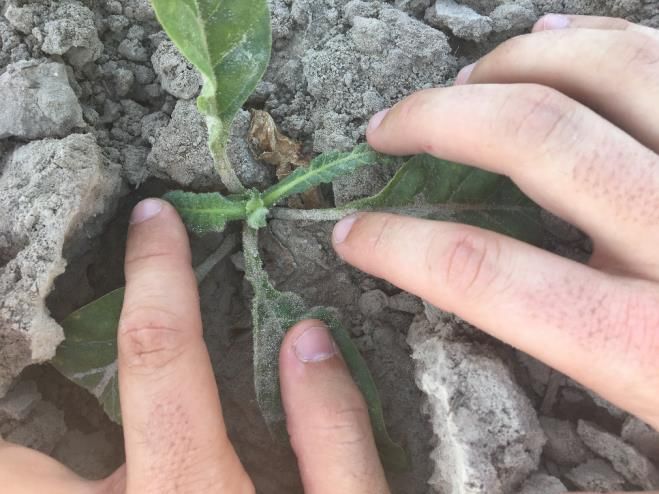
2020_TWC22_Bradley.pdf
                  Methods and Materials
•   Leaf quality was assigned a USDA quality grade, which was associated
    with a quality index value (Bowman et al., 1988; Fisher et al., 2017)

•   50 g composite samples were prepared for each plot to be analyzed for
    total alkaloids and reducing sugar concentration using methods of Davis
    (1976)

                                                                                     TWC2020(49) - Document not peer-reviewed
•   Data were subjected to ANOVA using PROC MIXED in SAS 9.4 and
    means separated using Tukey’s HSD (P < 0.10)
     – Environment and replication were random effects, treatment was considered
       to be a fixed effect
     – Non-treated control used as comparison for injury and weed control ratings,
       but not included in statistical analysis of those parameters
2020_TWC22_Bradley.pdf
Table 1. List of Herbicide Application Methods, Active Ingredients, and Rates.
Application Method Herbicide Programa Rate (kg ai ha-1)
Non-treated -- --
PTI Sulfentrazone + clomazone 0.18 + 0.84
PTI S-metolachlor + sulfentrazone 1.07 + 0.18
PTI S-metolachlor + pendimethalin 1.07 + 0.79
PTI S-metolachlor + clomazone 1.07 + 0.84
PTI Pendimethalin 0.79
TWC2020(49) - Document not peer-reviewed
PTI S-metolachlor 1.07
PTI S-metolachlor + sulfentrazone + clomazone 1.07 + 0.18 + 0.84
POST-OT 7 DAT S-metolachlor 1.07
PTI fb. POST-DIR at Layby Sulfentrazone + clomazone fb. S-metolachlor 0.18 + 0.84 fb. 1.07
PTI fb. POST-DIR at Layby Sulfentrazone + clomazone fb. pendimethalin 0.18 + 0.84 fb. 0.79
a “+”, indicates tankmix application; “fb.”, indicates POST-DIR application 6 weeks after transplanting.2020_TWC22_Bradley.pdf
Site Information
• 2017: Research conducted at two locations: • 2018: Research conducted at two locations:
– On farm test in Guilford County, NC • Lower Coastal Plain Research Station, Kinston, NC
– On farm test in Wayne County, NC • On-farm test in Guilford County, NC
Site
Wayne-17 Guilford-17 LCPRS-18 Guilford-18
Characteristic
Tobacco Variety NC 196 NC 938 NC 196 NC 925
TWC2020(49) - Document not peer-reviewed
Planting Date May 4 May 1 April 30 May 08
Soil Series Norfolk Enon Goldsboro Appling
Soil Texture Loamy Sand Fine Sandy Loam Loamy Sand Sandy Loam
Fine-loamy, Fine, mixed, active, Fine-loamy, siliceous, Fine, kaolinitic,
Taxonomic Class kaolinitic, thermic thermic subactive, thermic thermic Typic
Typic Kandiudults Ultic Hapludalfs Aquic Paleudults Kanhapludults2020_TWC22_Bradley.pdf
Table 2. Application date, final harvest date, monthly, and cumulative rainfall in each location.
Guilford-2017a Wayne-2017b LCPRS-2018c Guilford-2018d
Application Datee 4/12/2017 5/4/2017 4/20/2018 5/8/2018
Layby Application Datef 6/14/2017 6/29/2017 6/20/2018 6/14/2018
Final Harvest Dateg 9/8/2017 9/26/2017 8/29/2018 10/4/2018
___________________________________________cm___________________________________________
April 13.9 -- 4.8 --
May 15.3 11.6 15.7 9.2
June 35.3 10.9 16.1 6.1
July 16.8 9.0 15.5 10.3
August 14.5 8.2 15.0 22.5
TWC2020(49) - Document not peer-reviewed
September 8.6 11.1 -- 22.4
October -- -- -- 0.0
Total8 104.1 50.8 67.1 70.5
a Guilford-2017 Guilford County, North Carolina.
b Wayne-2017 Wayne County, North Carolina.
c LCPRS-2018 Kinston, North Carolina.
c Guilford-2018 Guilford County, North Carolina.
d Application date refers to the date which pre-transplant herbicide treatments were applied in each environment.
e Layby application date refers to the date which POST-DIR herbicides were applied in each environment.
f Final harvest date refers to the date which the last harvest was completed in each environment.
g Total refers to cumulative precipitation from pre-transplant application date to final harvest date in each environment.2020_TWC22_Bradley.pdf
Dominant Weed Species by Location
Guilford-17 Wayne-17 LCPRS-18 Guilford-18
______________________________________m2______________________________________
Annual Grassesa 46 34 12 15
Nutsedge 3 22 23 2
TWC2020(49) - Document not peer-reviewed
Palmer Amaranth 4 - 4 16
Eclipta - 5 2 -
a Annual grass species include broadleaf signalgrass, large crabgrass, goosegrass, and Texas panicum2020_TWC22_Bradley.pdf
100 a a a a a a a a
a a
90
80
70
60
Percent (%)
50
40
30 2 WAT
20
TWC2020(49) - Document not peer-reviewed
10
0
Figure 11. Visual weed control as affected by herbicide application program. Data are pooled across all growing environments.
Means followed by the same letter are not significantly different the α=0.10 level based on Tukey’s HSD.2020_TWC22_Bradley.pdf
100 a a
a a a a a
90 a a a
80
70
60
Percent (%)
50
40
2 WAT
30 6 WAT
20
TWC2020(49) - Document not peer-reviewed
10
0
Figure 11. Visual weed control as affected by herbicide application program. Data are pooled across all growing environments.
Means followed by the same letter are not significantly different the α=0.10 level based on Tukey’s HSD.2020_TWC22_Bradley.pdf
100 a
a a a a
90 a a a a
a
80
70
60
Percent (%)
50
40 2 WAT
30 6 WAT
20 9 WAT
TWC2020(49) - Document not peer-reviewed
10
0
Figure 11. Visual weed control as affected by herbicide application program. Data are pooled across all growing environments.
Means followed by the same letter are not significantly different the α=0.10 level based on Tukey’s HSD.2020_TWC22_Bradley.pdf
100
a
90 ab a
ab ab ab
ab ab
80 ab
b
70
60
Percent (%)
50
2 WAT
40
6 WAT
30 9 WAT
20 End of Season
TWC2020(49) - Document not peer-reviewed
10
0
Figure 11. Visual weed control as affected by herbicide application program. Data are pooled across all growing environments.
Means followed by the same letter are not significantly different the α=0.10 level based on Tukey’s HSD.2020_TWC22_Bradley.pdf
Visual Representation of Weed Control
Lower Coastal Plain Research Station in 2018
Non-treated control Sulf. + Clom. Sulf. + Clom. fb S-met.
TWC2020(49) - Document not peer-reviewed
S-met., S-metolachlor (Dual Magnum); Sulf., sulfentrazone (Spartan 4F); Clom., clomazone (Command 3ME)2020_TWC22_Bradley.pdf
100 a a a a a a a a
a a
90
80
70
60
Percent (%)
50
40
30 2 WAT
20
TWC2020(49) - Document not peer-reviewed
10
0
Figure 12. Amaranthus palmeri control as affected by herbicide application program. Data are pooled across all growing environments.
Means followed by the same letter are not significantly different the α=0.10 level based on Tukey’s HSD.2020_TWC22_Bradley.pdf
100 a
a a
90 a a a
80 a a
a
70 a
60
Percent (%)
50
40
2 WAT
30 6 WAT
20
TWC2020(49) - Document not peer-reviewed
10
0
Figure 12. Amaranthus palmeri control as affected by herbicide application program. Data are pooled across all growing environments.
Means followed by the same letter are not significantly different the α=0.10 level based on Tukey’s HSD.2020_TWC22_Bradley.pdf
100 a a
a a
a a a
90 a a a
80
70
60
Percent (%)
50
40 2 WAT
30 6 WAT
20 9 WAT
TWC2020(49) - Document not peer-reviewed
10
0
Figure 12. Amaranthus palmeri control as affected by herbicide application program. Data are pooled across all growing environments.
Means followed by the same letter are not significantly different the α=0.10 level based on Tukey’s HSD.2020_TWC22_Bradley.pdf
100 a
a a
90 ab a-c a-c
a-c a-c
80 b c
70
60
Percent (%)
50
2 WAT
40
6 WAT
30 9 WAT
20 End of Season
TWC2020(49) - Document not peer-reviewed
10
0
Figure 12. Amaranthus palmeri control as affected by herbicide application program. Data are pooled across all growing environments.
Means followed by the same letter are not significantly different the α=0.10 level based on Tukey’s HSD.2020_TWC22_Bradley.pdf
Table 3. Flue-cured tobacco injury as affected by herbicide application program. Data are pooled
across all growing environments.a
Treatmentb Rate 2 WAT 6 WAT
g ai ha-1 _________________________%_________________________
Sulf.+ Clom. 0.18 + 0.84 0b 0a
S-met. + Sulf. 1.07 + 0.18 0b 1a
S-met. + Pendi. 1.07 + 0.79 0b 2a
S-met. + Clom. 1.07 + 0.84 0b 1a
Pendi. 0.79 0b 0a
S-met. 1.07 0b 0a
TWC2020(49) - Document not peer-reviewed
S-met. + Sulf. + Clom. 1.07 + 0.18 + 0.84 0b 2a
S-met. POST-OT 7 DAT 1.07 9a 2a
Sulf. + Clom. fb S-met.
0.18 + 0.84 fb. 1.07 0b 1a
LAYBY
Sulf. + Clom. fb Pendi. LAYBY 0.18 + 0.84 fb. 0.79 0b 0a
a Treatment means followed by the same letter within the same column are not significantly different at the α=0.10 level.
b S-met., S-metolachlor (Dual Magnum); Sulf., sulfentrazone (Spartan 4F); Clom., clomazone (Command 3ME); Pendi., pendimethalin (Prowl H20)Guilford County
S-metolachlor POST-OT 7 DAT
Wayne County
TWC2020(49) - Document not peer-reviewed 2020_TWC22_Bradley.pdf2020_TWC22_Bradley.pdf
60
a a a a a
a
50 a a a
a a
40
Height (cm)
30
20
TWC2020(49) - Document not peer-reviewed
10
0
Figure 13. Stalk height six weeks after transplanting as affected by herbicide application program. Data are pooled across all growing
environments. Means followed by the same letter are not significantly different the α=0.10 level based on Tukey’s HSD.2020_TWC22_Bradley.pdf
Table 4. Tobacco yield, quality, and value as affected by herbicide application program. Data are pooled across all growing
environments.a
Treatmentb Rate Yield Qualityc Value
g ai ha-1 kg ha-1 $ ha-1
Non-treated Control -- 2,053 b 77 a 7,363 a
Sulf.+ Clom. 0.18 + 0.84 2,322 ab 76 a 8,520 a
S-met. + Sulf. 1.07 + 0.18 2,572 ab 75 a 8,517 a
S-met. + Pend. 1.07 + 0.79 2,553 ab 78 a 9,090 a
S-met. + Clom. 1.07 + 0.84 2,567 ab 76 a 8,990 a
Pend. 0.79 2,562 ab 78 a 9,204 a
TWC2020(49) - Document not peer-reviewed
S-met. 1.07 2,362 ab 75 a 7,951 a
S-met. + Sulf. + Clom. 1.07 + 0.18 + 0.84 2,540 ab 75 a 8,765 a
S-met. POST-OT 1.07 2,652 a 77 a 9,422 a
Sulf. + Clom. fb S-met. 0.18 + 0.84 fb. 1.07 2,580 ab 75 a 9,010 a
Sulf. + Clom. fb Pend. 0.18 + 0.84 fb. 0.79 2,370 ab 75 a 8,490 a
a Treatment means followed by the same letter within the same column are not significantly different at the α=0.10 level.
b S-met., S-metolachlor (Dual Magnum); Sulf., sulfentrazone (Spartan 4F); Clom., clomazone (Command 3ME); Pendi., pendimethalin (Prowl H20) ; “+” indicates tankmix; “fb.”
indicates POST-DIR six weeks after transplanting.
c Quality assessed on a scale of 1 to 100, with 100 having the highest quality.2020_TWC22_Bradley.pdf
Table 5. Tobacco total alkaloids and reducing sugars as affected by herbicide application program. Data
are pooled across all growing environments.a
Treatmentb Rate Total Alkaloids Reducing Sugars
g ai ha-1 ______________________%______________________
Non-Treated Control -- 2.54 b 16.1 a
Sulf.+ Clom. 0.18 + 0.84 3.01 a 15.7 a
S-met. + Sulf. 1.07 + 0.18 2.74 ab 16.5 a
S-met. + Pend. 1.07 + 0.79 2.84 ab 15.9 a
S-met. + Clom. 1.07 + 0.84 2.95 a 14.5 a
Pend. 0.79 2.98 a 15.5 a
TWC2020(49) - Document not peer-reviewed
S-met. 1.07 2.91 a 15.5 a
S-met. + Sulf. + Clom. 1.07 + 0.18 + 0.84 3.02 a 14.9 a
S-met. POST-OT 1.07 3.00 a 14.2 a
Sulf. + Clom. fb. S-met. 0.18 + 0.84 fb. 1.07 2.84 ab 14.8 a
Sulf. + Clom. fb. Pend. 0.18 + 0.84 fb. 0.79 2.81 ab 16.1 a
a Treatment means followed by the same letter within the same column are not significantly different at the α=0.10 level.
b S-met., S-metolachlor (Dual Magnum); Sulf., sulfentrazone (Spartan 4F); Clom., clomazone (Command 3ME); Pendi., pendimethalin (Prowl H20); “+”
indicates tankmix; “fb.” indicates POST-DIR six weeks after transplanting.2020_TWC22_Bradley.pdf
Study Two Results
• S-metolachlor alone may not provide enough control compared to
labeled materials
– Early season trends demonstrated reduced efficacy
– End of season ratings indicated a 16% difference in visual weed control
• Greatest season long Palmer amaranth control was observed
TWC2020(49) - Document not peer-reviewed
when S-metolachlor was applied POST-OT or POST-DIR at labyby
• Injury was observed in the POST-OT application (2020_TWC22_Bradley.pdf
References
Bailey WA (2013) Herbicides Used in Tobacco. Pages 175–199 in Herbicides: Current Research and Case Studies in Use. IntechOpen
Bowman DT, Tart AG, Wernsman EA, Corbin TC (1988) Revised North Carolina Grade Index for Flue-Cured Tobacco. Tobacco Science 32: 39-40
Clewis SB, Miller DK, Koger CH, Baughman TA, Price AJ, Porterfield D, Wilcut JW (2008) Weed management and crop response with glyphosate,
S-metolachlor, tryfloxysulfuron, prometryn, and MSMA in glyphosate-resistant cotton. Weed Technology 22: 160-167
Davis RE (1976) A combined automated procedure for the determination of reducing sugars and nicotine alkaloids in tobacco products using a
new reducing sugar method. Tobacco Science 20: 139-144
Dayton DM, Chaudhari S, Jennings KM, Monks DW, Hoyt GW (2017) Effect of drip-applied metam-sodium and S-metolachlor on yellow nutsedge
and common purslane in polyethylene-mulched bell pepper and tomato. Weed Technology 31:421-429
Fisher LR, Vann MC, Barnes K (2017) Selecting a Variety. Pages 18-43 in 2017 Flue-Cured Tobacco Guide. North Carolina State University: NC
State Extension
TWC2020(49) - Document not peer-reviewed
Grichar WJ, Dotray PA, Baughman TA (2008) Yellow Nutsedge (Cyperus Esculentus) Control and Peanut Tolerance to S-Metolachlor and
Diclosulam Combinations. Weed Technology 22(3): 442-447
Meyers SL, Jennings KM, Schultheis JR, Monks DW (2010) Evaluation of Flumioxazin and S-metolachlor Rate and Timing for Palmer Amaranth
(Amaranthus palmeri) Control in Sweetpotato. Weed Technology 24: 495-503
Vann MC, Fisher LR, Inman MD, Seagroves RW, Whitley DS (2017) Managing Weeds. Pages 77–96 in 2017 Flue-Cured Tobacco Guide. North
Carolina State University: NC State Extension
Whitaker JR, York AC, Jordan DL, Culpepper AS (2010) Palmer Amaranth (Amaranthus palmeri) Control in Soybean with Glyphosate and
Conventional Herbicide Systems. Weed Technology 24: 403-410
Zemolin CR, Avila LA, Cassol GV, Massey JH, Camargo ER (2014) Environmental fate of S-metolachlor – a review. Planta Daninha 32(3): 655-664Questions? TWC2020(49) - Document not peer-reviewed 2020_TWC22_Bradley.pdf
You can also read