2021 Florida Southern Pine Beetle Forecast Florida Forest Service, Forest Health Section
←
→
Page content transcription
If your browser does not render page correctly, please read the page content below
2021 Florida Southern Pine Beetle Forecast
                          Florida Forest Service, Forest Health Section

                                                                                      Florida SPB Activity Forecast
                 Christopher Pearce, Forest Health Survey Coordinator
                                       May 2021

         A pheromone trap survey was conducted in March 2021 as part of an
ongoing program to monitor the populations of Southern Pine Beetle (SPB)
and its associated predators. The purpose is to provide an early season
prediction of the potential level of SPB activity in select Florida counties,
and identify areas which may be at increased risk for an outbreak. The
results of the 2021 survey predict that the probability of SPB activity is low
for Florida Forest Service (FFS) Regions 1, 2 and 3, and the probability of
any major SPB outbreak occurring in Florida is minimal.

Background

        The Southern Pine Beetle is one of the most destructive forest pests in the southern United States. Since 1995, the
FFS has participated in an annual statewide Southern Pine Beetle (Dendroctonus frontalis, or SPB) spring trapping
survey. This survey monitors numbers of adult SPBs and their clerid beetle predators captured in pheromone-baited flight
traps during the SPB primary spring dispersal phase. The results are used as an early-season prediction of SPB population
trends and activity levels, allowing forest managers to identify areas of potential SPB activity in advance of aerial
detection flights. The survey also provides data for monitoring SPB population levels from year to year

Methods
The 2021 Florida survey was conducted in 38 counties in          SPB and their clerid beetle predator, Thanasimus dubius,
North Florida, which includes those that are most likely         were counted for each of the six weekly collections per
to experience SPB problems based on historical                   trap.
outbreaks and/or their relative abundance of loblolly
pines. One to three traps (Lindgren funnel traps baited          Data Collection: Florida joined with other southern
with alpha- and beta-pinene and the SPB aggregation              states to record the SPB trap results in a standardized
pheromone frontalin) were set up in each of those                format survey using the ESRI application Survey123 for
counties. Each trap was set up in or near a different stand      ArcGIS. This standardization enables data to be directly
of susceptible forest type. Endo-brevicomin luresf were          accessible and shared with different stakeholders,
placed near all traps to boost attractiveness to SPB             agencies, and researchers performing SPB prediction
adults, thereby increasing trap catches and prediction           modeling in the South.
accuracy (based on previous research).
                                                                 Prediction Modeling: 2021 was the third year of
Site Selection: As in previous years, effort was made to         application using a new model for predicting the risks of
place traps in stands containing sawtimber size loblolly         SPB damage. This next-generation prediction model is
pine or areas where loblolly pine is most abundant.              based on several variables that have been determined to
Traps were distanced at least 50 feet from any pine tree         work with the survey trapping data collected. Historical
and checked weekly by foresters in March. Numbers of             SPB data is also used to create the framework for
                                                                 development of the model.
The predictive model generates a forecast that displays the probability for various levels of southern pine beetle
spot severity. Out of all the variables tested, the probability of greater than 50 SPB spots (Figure 2) was found to be the
most accurate, although various forest professionals may use other benchmarks. Trapping data collected since 2011 were
used to build the prediction model.
The probability of an outbreak infestation occurring in each county was generated using the following predictor
variables tested : 1) number of SPB trapped in this year’s survey 2) number of the predator checkered beetles trapped this
in year’s survey 3) ratio of SPB/checkered beetles 4) number of SPB infestations that occurred last year in that area, and
5) number of SPB infestations two years ago in that area.
Results
Based on the survey results, the forecast model predicts low levels of SPB activity throughout all of FFS’s
Regions 1, 2 and 3. Overall SPB counts collected from trap locations were lower in Florida this year than in recent years
(Figure 1). Additionally, the ratio of the number of the predator checkered beetles (Thanasimus dubius) caught in traps far
outweighed the amount of SPB trapped (Table 1). Adult checkered beetles eat SPB and are attracted to SPB pheromones.
A robust population of checkered beetle predators will keep rising SPB populations in check and at low levels. The high
ratio of predator to prey in this year’s survey makes it more likely that Florida will not experience any outbreak level SPB
infestations this year.
The probability of “greater than 50 SPB spots” (considered to be an outbreak level) occurring within the
surveyed counties was low (Figure 2). No surveyed county had an outbreak probability greater than 3%, and the
probability of “any SPB spots” occurring ranged from 3 to 19% for all counties surveyed (Table 1). The low probability
of SPB activity that was forecasted from the trapping survey data follows a trend of minimal SPB activity that has
occurred in Florida over recent years.
Figure 1: Southern Pine Beetle trap locations (5-mile radius) and the average number of Southern Pine Beetle caught per
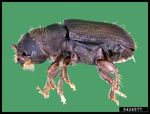
day in traps over a six-week period.Figure 2: The Southern Pine Beetle Outbreak Prediction Map, showing the probability of “greater than 50 SPB spots” occurring in Florida counties that were surveyed. Counties that are not highlighted were not trapped in the 2021 survey. a b a) Southern Pine Beetle (Dendroctonus frontalis) Length 2-4 mm. Image by Erich G. Vallery, USDA Forest Service. b) Aerial view of SPB spot and infestation. Image by Ronald F. Billings, Texas A&M Forest Service.
Table 1: County-level survey trapping data and variables used to generate SPB activity and outbreak probabilities from
the southern pine beetle prediction model. The 2021 survey trapping results resulted in low probabilities for SPB activity
in all counties surveyed.

                                                          Clerid
                                                                    # SPB      # SPB    Probability of       Probability of
                                        Number SPB per 2 predator
Region/District County                  of traps weeks beetle per
                                                                  spots last spots two greater than 50       any SPB spots
                                                                    year     years ago    SPB spots            occuring
                                                         2 weeks
Region 1                                                                               0
Blackwater D-1      Escambia               1         0         6         0         0           1%                 7%
D-1                 Okaloosa               1        11        43         0         0           1%                 9%
D-1                 Santa Rosa             1         0        27         0         0           1%                 6%
Chipola D-2         Bay                    1         0         5         0         0           2%                11%
D-2                 Calhoun                1         0         3         0         0           1%                 4%
D-2                 Gulf                   1         0         3         0         0           2%                11%
D-2                 Holmes                 1         0        40         0         0           1%                 7%
D-2                 Jackson                1        13        77         0         0           2%                12%
D-2                 Walton                 1         0       147         0         0           1%                 6%
D-2                 Washington             1        13        30         0         0           2%                10%
Tallahassee D4      Wakulla                2        22         8         0         0           2%                12%
D-4                 Gadsden                1        16         8         0         0           2%                12%
D-4                 Liberty                1        10        23         0         0           1%                 7%
D-4                 Leon                   1         0         0         0         0           1%                 7%
D-4                 Jefferson              1         0         1         0         0           1%                11%
Region 2
Perry D-5           Lafayette              1         0         0         0         0           2%                11%
D-5                 Madison                1         0        25         0         0           2%                 5%
D-5                 Dixie                  1         0         0         0         0           2%                11%
D-5                 Taylor                 1         0         4         0         0           2%                11%
Suwannee D-6        Baker                  1         1         1         0         0           1%                 6%
D-6                 Bradford               1         3         7         0         0           1%                 6%
D-6                 Columbia               2         1         3         0         0           2%                10%
D-6                 Hamilton               2         1         4         0         0           1%                 6%
D-6                 Suwannee               1         0         5         0         0           1%                 4%
D-6                 Union                  1         1         5         0         0           1%                 6%
Jacksonville D7     Clay                   1         1        14         0         0           1%                 7%
D-7                 Duval                  1         0         0         0         0           2%                 9%
D-7                 Nassau                 3         9         8         0         0           2%                10%
Wacasassa D-8       Alachua                3         2         6         0         0           2%                 9%
D-8                 Gilchrist              1         0         0         0         0           2%                11%
D-8                 Levy                   1         0         1         0         0           1%                 5%
D-8                 Marion                 3        14         2         0         0           2%                13%
D-8                 Putnam                 1        13         1         0        12           3%                19%
Region 3
Bunnell D-10        St. Johns              1         0         0         0         2           1%                 9%
D-10                Volusia                1         0         0         0         0           2%                11%
WFC D-11            Hernando               1         6         0         0         0           3%                14%
D-11                Lake                   1        11        16         0         0           2%                12%
Orlando D-12        Orange                 1         0         0         0         0           2%                11%
D-12                Seminole               1         0         0         0         0           2%                11%
As in previous years, all counties in FFS
Districts/Centers 1-12 will be asked to conduct an
initial aerial SPB detection survey. Due to COVID-
19 concerns and restrictions, typical aerial surveys to
document damage caused by bark beetles may be
done differently in some areas.
Because of limited survey inputs, a vast
resource of potential habitat, and the limitations of the
predictive model, the forecast presented here cannot
be expected to be 100% accurate. Low SPB activity
predictions do not guarantee that troublesome
infestations will not develop on a local or limited basis
in some counties. Activity predictions are likely to be
more accurate for the 5-mile radius region around
each trap than for the county as a whole.
Given the limitations of the forecast, local
weather extremes and variations, and the potential for
environmental conditions to change after the survey,
areas of suspicious pine mortality should be promptly
inspected for evidence of SPB in the coming months.
The SPB Assistance and Prevention Program has been Checkered clerid beetle (Thanasimus dubius), predator of the
very successful in reducing available habitat for the southern pine beetle. Image by Natasha Wright, Bugwood.org.
beetle by encouraging private landowners to thin
overcrowded and stressed pine stands that favor SPB
infestations. Foresters are urged to be on the lookout
for localized and sporadic infestations on stands that
are over-stocked, over-mature, or have poor soil
drainage.
Sincere thanks to all the FFS personnel who
were involved in installing traps, making weekly
collections, and submitting samples for processing.
We would also like to acknowledge the continuing
support from the US Forest Service, as well as
Matthew Ayers (Dartmouth College) and Carissa
Aoki (Bates College) for their work on the next
generation SPB prediction model. Please forward this
report to anyone who may be interested.
For additional information contact:
Jeff Eickwort/Entomologist
Jeffrey.Eickwort@FDACS.gov Lindgren funnel trap used to monitor southern pine beetle
Chris Pearce/Survey Coordinator populations. Image by Andrew Derksen, USDA-APHIS.
Christopher.Pearce@FDACS.gov
Allen Percifield/SPB Forester
George.Percifield@FDACS.gov
Florida Department of Agriculture and Consumer Services
Nicole “Nikki” Fried, Commissioner
Florida Forest Service
Erin Albury, DirectorYou can also read


