QUANTIF: AN IMAGEJ MACRO TO AUTOMATICALLY DETERMINE THE PERCENTAGE OF INFECTED CELLS AFTER IMMUNOFLUORESCENCE - MDPI
←
→
Page content transcription
If your browser does not render page correctly, please read the page content below
viruses
Technical Note
QuantIF: An ImageJ Macro to Automatically
Determine the Percentage of Infected Cells
after Immunofluorescence
Lynda Handala 1,† , Tony Fiore 1,† , Yves Rouillé 2, *         and Francois Helle 1, *
 1    EA4294, Agents Infectieux, Résistance et Chimiothérapie, Centre Universitaire de Recherche en Santé,
      Centre Hospitalier Universitaire et Université de Picardie Jules Verne, 80054 Amiens, France;
      l.handala@gmail.com (L.H.); toni.fiore37@gmail.com (T.F.)
 2    University of Lille, CNRS, INSERM, CHU Lille, Pasteur Institute of Lille, U1019-UMR8204-CIIL-Center for
      Infection and Immunity of Lille, 59019 Lille, France
 *    Correspondence: yves.rouille@ibl.cnrs.fr (Y.R.); francois.helle@u-picardie.fr (F.H.);
      Tel.: +33-3-20-87-10-27 (Y.R.); +33-3-22-82-53-51 (F.H.)
 †    These authors contributed equally to this work.

 Received: 21 January 2019; Accepted: 17 February 2019; Published: 19 February 2019

 Abstract: Counting labeled cells, after immunofluorescence or expression of a genetically fluorescent
 reporter protein, is frequently used to quantify viral infection. However, this can be very tedious
 without a high content screening apparatus. For this reason, we have developed QuantIF, an ImageJ
 macro that automatically determines the total number of cells and the number of labeled cells
 from two images of the same field, using DAPI- and specific-stainings, respectively. QuantIF can
 automatically analyze hundreds of images, taking approximately one second for each field. It is
 freely available as supplementary data online at MDPI.com and has been developed using ImageJ,
 a free image processing program that can run on any computer with a Java virtual machine, which is
 distributed for Windows, Mac, and Linux. It is routinely used in our labs to quantify viral infections
 in vitro, but can easily be used for other applications that require quantification of labeled cells.

 Keywords: virus; infection; fluorescent reporter protein; image quantification; Hepatitis C virus;
 Yellow Fever Virus; polyomavirus; Coxsackievirus B4

1. Introduction
      When evaluating viral infections in vitro, fluorescence microscopy is commonly used to monitor
the expression of a viral protein following immunostaining. However, this method requires a high
content screening apparatus to count large numbers of fluorescent cells. Manual evaluation is feasible
when analyzing few images, but it can result in subjective evaluation by the researcher. Furthermore,
it is very time-consuming when working with hundreds of images, containing thousands of cells
per image.
      ImageJ is a free image-processing program that was developed 20 years ago by Wayne S. Rasband
at the National Institute of Health, and has become a valuable tool for researchers [1,2]. It is a Java-based
software that can run on any computer using a Java virtual machine. It is thus available for Windows,
Mac, and Linux. ImageJ can convert images into numerical values that can be exported and further
processed with other software for statistical analysis. Furthermore, a major strength of ImageJ is the
possibility to record macros that enable the automatization of image analysis.
      In this technical note, we present QuantIF, an ImageJ macro for determining the percentage of
fluorescent cells following immunofluorescence staining. QuantIF can be used when the specific
staining in the cytoplasm and/or nucleus of a cell is diffuse. The macro automatically determines the

Viruses 2019, 11, 165; doi:10.3390/v11020165                                    www.mdpi.com/journal/viruses
Viruses 2019, 11, 165 2 of 4
total number of cells and fluorescently labeled cells for a series of images corresponding to different
conditions. For each condition, two pictures of the same field must be taken, the first one corresponding
to the specific staining and the second one corresponding to the DAPI staining. In this way, the series
of images to be analyzed are placed in the same folder, with images corresponding to the specific
staining in odd rank and images of DAPI staining in even rank. When the macro is run, it automatically
processes all images in the folder, taking around one second to analyze both images of each field.
Ultimately, all results are saved as a “.xls” file that can be processed for statistical analysis.
2. Macro Description
QuantIF was developed using ImageJ version 1.52e and Java version 8. It is freely available
as supplementary data online at MDPI.com. In order to use the QuantiIF macro, it is necessary
to save the QuantIF.ijm file in the “Plugins” folder of ImageJ. The macro will then appear in the
“Plugins” menu. When QuantIF is launched, the folder containing the images for analysis must be
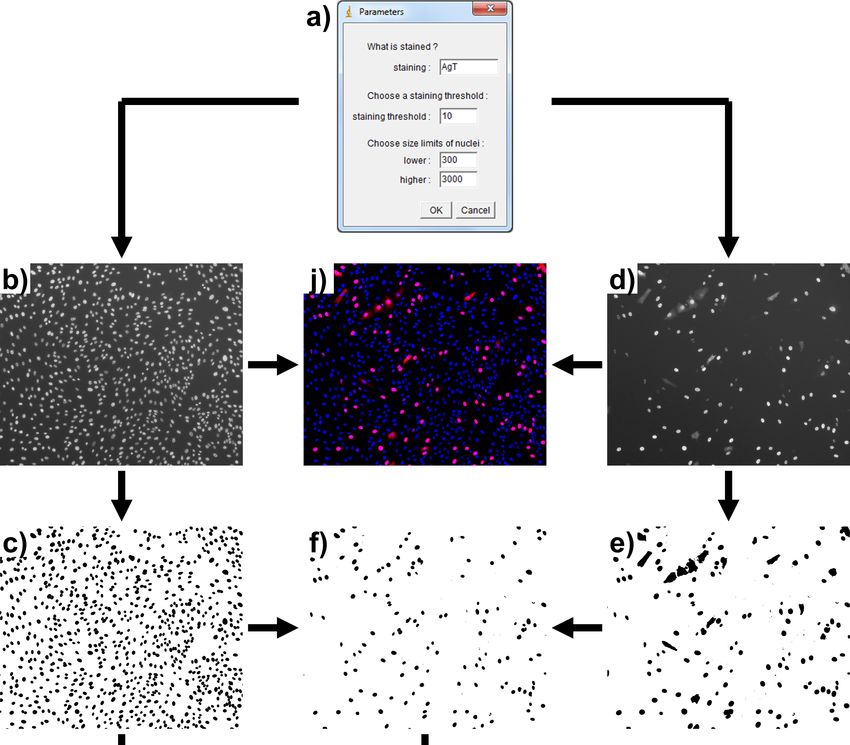
selected. Then, parameter values should be entered in a dialog box (Figure 1a), (i) the type/name of
the specific staining, (ii) the staining threshold, and (iii) the size limits of nuclei. Once the parameters
have been entered, the macro starts analyzing the images. They are first converted to 8-bit images,
displaying 256 gray levels. Indeed, we recommend directly exporting images as 8-bit TIFF files, from
the microscope software. The background of the images is then removed by running the efficient
“Subtract Background” ImageJ command.
QuantIF relies on the “Analyze Particles” tool of ImageJ, which requires binary, black and white,
images. For this reason, images are converted to binary masks by implementing the Huang’s fuzzy
thresholding method [3]. An automatic threshold is set for DAPI staining images since strong and
contrasted signals are expected for all these images (Figure 1b,c). In contrast, for immunostaining
images, the automatic threshold is generally not applicable since some images may show no signal
(in negative controls for instance). For this reason, a manual thresholding is implemented with the
staining threshold value entered in the parameter’s dialog box (Figure 1a). The threshold value must
range between 0 and 255; pixels with values under and above the threshold are converted to white and
black, respectively (Figure 1d,e). The “Watershed” command is also applied to the DAPI staining mask
in order to separate nearby nuclei [4]. However, it is important to avoid cell overconfluence to obtain
interpretable results (see below). Furthermore, the commands “Dilate”, “Close”, and “Fill Holes” are
applied to the mask of the specific staining in order to completely include the area corresponding to
the nuclei. To analyze similar particles in the DAPI- and specific-staining masks and avoid counting
autofluorescent debris, a new mask corresponding to the nuclei of immunostained cells is created. This
is performed by executing the “Image Calculator” command and the “AND” operator using the DAPI-
and specific-staining masks (Figure 1f). Finally, the total number of DAPI-stained and immunostained
cells’ nuclei are counted by implementing the “Analyze Particles” tool to the DAPI staining mask
(Figure 1g) and the immunostained cells’ nuclei mask (Figure 1h), respectively. The size limits for the
nuclei entered in the parameters dialog box correspond to the minimum and maximum pixel area
sizes that are taken into account to exclude anything that is not an object of interest. Additionally,
to help exclude unwanted objects, roundness values have been set between 0.7 and 1.0.
After processing, the numbers of DAPI-stained nuclei and immunostained cells’ nuclei for each
condition are saved as a “.xls” file in the folder that has been analyzed (Figure 1i). In addition, “Total
Area”, “Average Size”, and “%Area” values are saved in the file. While “Total Area” values are not
useful, the “Average Size” values can help in choosing the size limits for the nuclei that must be entered
in the parameters dialog box. Furthermore, “%Area” values of the DAPI staining masks give an idea
on cell confluence, which should not typically exceed 30% for optimal results. To help researchers
find the best parameters for their analyses, the different masks can be saved in the folder that is being
analyzed. To do so, the “//” symbols preceding the “saveAs” line commands must be deleted in the
QuantIF.ijm file.
Viruses 2019, 11, 165                                                                                                               3 of 4
Viruses 2019, 11 FOR PEER REVIEW                                                                                                         3

                  Description of the QuantIF macro. After
     Figure 1. Description                                   After entering the parameters into the dialog box (a), two
     images of each field are analyzed. The DAPI staining image (b) is converted to a DAPI staining mask
     (c), and
          and the
               the specific
                    specificstaining
                              stainingimage
                                         image(d)(d)isisconverted
                                                          converted toto
                                                                       a specific staining
                                                                         a specific         mask
                                                                                     staining  mask(e),(e),
                                                                                                        by implementing
                                                                                                            by implementing  the
     Huang’s     fuzzy thresholding     method.    A   third  mask   corresponding     to the
     the Huang’s fuzzy thresholding method. A third mask corresponding to the nuclei of the   nuclei  of the  immunostained
     cells is created using
     immunostained              the
                         cells is    “Image
                                  created      Calculator”
                                             using the “Image command      and the
                                                                  Calculator”         “AND”and
                                                                                 command       operator
                                                                                                   the “AND”(f). Finally, DAPI
                                                                                                                   operator  (f).
     stained DAPI
     Finally,  nucleistained
                       and immunostained          cell nuclei are
                                nuclei and immunostained             counted
                                                                  cell         using
                                                                       nuclei are       the “Analyze
                                                                                   counted   using theParticles”      tool (g,h).
                                                                                                         “Analyze Particles”
     After  processing,
     tool (g,h).          the numbersthe
                   After processing,       of DAPI-stained    nuclei and immunostained
                                              numbers of DAPI-stained                         cell nuclei for each
                                                                             nuclei and immunostained                 condition
                                                                                                                 cell nuclei for
     are  saved   as a “.xls”  file in the   folder  that  has  been   analyzed   (i). A  merge  of  the  DAPI
     each condition are saved as a “.xls” file in the folder that has been analyzed (i). A merge of the DAPI       and  specific
     staining
     and        images
           specific      is shown
                    staining   imagesfor is
                                          informational     purposes (j).purposes (j).
                                            shown for informational

3. Discussion and Conclusions
3. Discussion and Conclusions
      QuantIF is a free, simple, and robust automated tool to estimate the proportion of virally infected
      QuantIF is a free, simple, and robust automated tool to estimate the proportion of virally infected
cells after immunofluorescence. It is routinely used in our labs to quantify Hepatitis C Viral infections
cells after immunofluorescence. It is routinely used in our labs to quantify Hepatitis C Viral infections
following detection of the E1 envelope glycoprotein that localizes predominantly to the endoplasmic
reticulum in HCV-infected cells [5,6]. Similarly, we use it to evaluate Yellow Fever Virus infections
Viruses 2019, 11, 165 4 of 4
following detection of the E1 envelope glycoprotein that localizes predominantly to the endoplasmic
reticulum in HCV-infected cells [5,6]. Similarly, we use it to evaluate Yellow Fever Virus infections
using anti-E staining [5]. QuantIF is also used to quantify BKPyV and SV40 infections after detection
of the VP1 or AgT proteins that show cytoplasmic and/or nuclear staining patterns (Figure 1d), as
well as Coxsackievirus B4 infections using anti-VP1 staining [5]. QuantIF can also be used to quantify
infection when using recombinant viruses expressing fluorescent reporter proteins [5]. Furthermore,
it can serve many researchers for other applications that require counting labeled cells.
Supplementary Materials: The following is available online at http://www.mdpi.com/1999-4915/11/2/165/s1,
File S1: QuantIF.ijm.
Author Contributions: Conceptualization, Y.R. and F.H.; validation, L.H., T.F., Y.R., and F.H.; writing, Y.R. and F.H.
Funding: This work was supported by the Université de Picardie Jules Verne, the Université de Lille, Inserm
and CNRS.
Acknowledgments: We thank Zuzana Saidak and Thomas Belcher for proofreading the manuscript.
Conflicts of Interest: The authors declare no conflict of interest.
References
1. Schindelin, J.; Rueden, C.T.; Hiner, M.C.; Eliceiri, K.W. The ImageJ ecosystem: An open platform for
biomedical image analysis. Mol. Reprod. Dev. 2015, 82, 518–529. [CrossRef] [PubMed]
2. Schneider, C.A.; Rasband, W.S.; Eliceiri, K.W. NIH Image to ImageJ: 25 years of image analysis. Nat. Methods
2012, 9, 671–675. [CrossRef] [PubMed]
3. Huang, L.-K.; Wang, M.-J.J. Image thresholding by minimizing the measures of fuzziness. Pattern Recognit.
1995, 28, 41–51. [CrossRef]
4. Vincent, L.; Soille, P. Watersheds in digital spaces: An efficient algorithm based on immersion simulations.
IEEE Trans. Pattern Anal. Mach. Intell. 1991, 13, 583–598. [CrossRef]
5. Ferlin, J.; Farhat, R.; Belouzard, S.; Cocquerel, L.; Bertin, A.; Hober, D.; Dubuisson, J.; Rouille, Y. Investigation
of the role of GBF1 in the replication of positive-sense single-stranded RNA viruses. J. Gen. Virol. 2018, 99,
1086–1096. [CrossRef] [PubMed]
6. Rouille, Y.; Helle, F.; Delgrange, D.; Roingeard, P.; Voisset, C.; Blanchard, E.; Belouzard, S.; McKeating, J.;
Patel, A.H.; Maertens, G.; et al. Subcellular localization of hepatitis C virus structural proteins in a cell
culture system that efficiently replicates the virus. J. Virol. 2006, 80, 2832–2841. [CrossRef] [PubMed]
© 2019 by the authors. Licensee MDPI, Basel, Switzerland. This article is an open access
article distributed under the terms and conditions of the Creative Commons Attribution
(CC BY) license (http://creativecommons.org/licenses/by/4.0/).You can also read