Сomparative tests of differentiated fertilizer application for wheat using task cards and nitrogen scanner
←
→
Page content transcription
If your browser does not render page correctly, please read the page content below
E3S Web of Conferences 285, 01016 (2021)                                 https://doi.org/10.1051/e3sconf/202128501016
ABR 2021

       Сomparative tests of differentiated fertilizer
       application for wheat using task cards and
       nitrogen scanner
       E. V. Truflyak1,*, N. Yu. Kurchenko1, V. E. Kuryan2 and Dadu Mones1
       1Kuban   State Agrarian University, 13 Kalinina str., Krasnodar, 350044, Russia
       2LLC    AIS, 1 Pervomskayskaya str, Moscow, 141700 Russia

                      Abstract. In the training and experimental farm of the Kuban State
                      Agrarian University Krasnodarskoe from February 19 to July 6, 2020, an
                      experiment was conducted on the comparative analysis of differentiated
                      fertilizer application in on-line and off-line modes. The aim of the
                      experiment was to compare the modes of differentiated application of
                      nitrogen fertilizers (first and second top dressing) for winter wheat using
                      task maps and GreenSeeker sensors. The calculation of economic
                      efficiency showed that when using nitrogen scanners, fertilizers are saved
                      on average 16 kg / ha, compared to the mode of creating task maps based
                      on the NDVI index based on satellite data without losing grain yield and
                      quality (gluten content increased by 2.3 %; protein content-0.6 %).

       From February 19 to July 6, 2020, comparative tests of differentiated fertilizer application
       in on-line and off-line modes were conducted in the training and experimental farm of the
       Kuban State Agrarian University "Krasnodarskoe".
           The aim of the experiment was to compare the modes of differentiated application of
       nitrogen fertilizers (first and second top dressing) for wheat using task cards and nitrogen
       scanner.
           In 2020 we conducted a questionnaire survey on issues related to the exact farming,
       which was attended by 81 expert (56 % of the respondents belong to the category "science
       ", 26 % – business, 11 % administrative staff; 7 % other) (figure 1) [1].
           The following questions were related to the efficiency of using precision farming
       elements:
           - unmanned aerial vehicles: 70 % – yes (effective); 19 % - no (not effective), 11 % - not
       sure;
           - NDVI satellite images: 64 % - yes; 21 % - no, 15 % - undecided;
           - purchase of an agrochemical laboratory: 66 % - yes, 25 % - no, 9 % - difficult;
           - using nitrogen scanners when applying fertilizers on-line: 65 % - yes, 17 % - no, 18 %
       - difficult;
           - start with the yield mapping system: yes-65 %, no-24 %, 11 % - difficult.

       *
           Corresponding author: trufliak@mail.ru

© The Authors, published by EDP Sciences. This is an open access article distributed under the terms of the Creative Commons
Attribution License 4.0 (http://creativecommons.org/licenses/by/4.0/).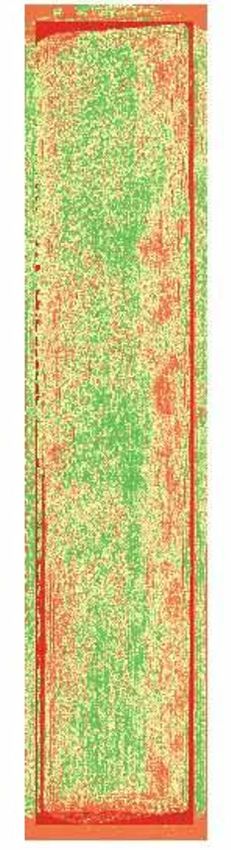
E3S Web of Conferences 285, 01016 (2021)                              https://doi.org/10.1051/e3sconf/202128501016
ABR 2021

      Fig. 1. Expert survey questionnaire.

          Based on the above, it can be summarized that comparative testing of differentiated
      fertilizer application for winter wheat using task cards and nitrogen scanners is a relevant
      area for research [2, 3, 4].
          The conditions of the experiment were as follows. Ammonium nitrate was used as
      fertilizer. The first top dressing was carried out on February 19, 2020 during the resumption
      of spring vegetation (tillering phase), the second top dressing – on March 23, 2020. (start of
      getting on the phone). A Claas Axion 850 tractor with an Amazone ZA TS 4200 fertilizer
      spreader was used (Figure 2). The working speed of movement was 19 km / h with the
      width of the spreader capture 28 m. In the cab of the tractor, an on-board computer
      Amatron 3 was used. Two GreenSeeker optical sensors were placed in front of the tractor at
      a height of 130 cm from the ground and a distance of 565 cm. The Farm Works Mobile
      software (LLC Agro-Soft) was used to create mission.

                                 a                                                       b
      Fig. 2. Differential fertilizer application unit (Claas Axion 850 tractor + Amazone ZA TS 4200
      spreader): a-for applying fertilizers using task cards; b - for applying fertilizers using a nitrogen
      scanner.

          Before conducting comparative tests, a selection of fields was made for conducting the
      experiment: field 2.2 (a task map was created for differentiated fertilizer application) and
      2.3 (a nitrogen scanner was used), with an area of 74.73 hectares and 82.78 hectares,
      respectively, on which wheat of the Bezostaya 100 variety was sown on October 16, 2019.
      The precursor in both cases was corn for silage (Figure 3).
          Fertilizer application doses were determined for zones with different vegetation periods
      in field 2.2 (Figure 4):
          – the first dressing: the low area of vegetation (the value of the NDVI – 0...0,59) – dose
      of fertilizer 125 kg/ha, the average (NDVI – ...0,59 0,74) – 75...125 kg/ha, high (NDVI –
      0,74 1,00...) -75 kg/ha; total weight of fertilizer application on the field – 8676 kg; average
      dose of fertilizer – 105 kg/ha;

                                                          2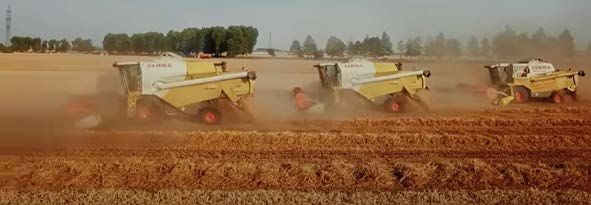
E3S Web of Conferences 285, 01016 (2021)                                 https://doi.org/10.1051/e3sconf/202128501016
ABR 2021

          – the second feeding: low area of vegetation (NDVI – 0...0,63) – dose of fertilizer 180
      kg/ha, the average (NDVI – 0,65) – 140 kg/ha, high (NDVI – 0,66 1,00...) – 100 kg/ha;
      total weight of fertilizer application on the field – 9670 kg; average dose of fertilizer – 117
      kg/ha.

                                 a                                                       b
      Fig. 3. Experimental fields (2.2-left, 2.3-right).

          – the first feeding: low (index NDVI – 0...0,65) – dose of fertilizer 125 kg/ha, the
      average (NDVI – 0,65 0,76...) – 100 kg/ha, high (NDVI – 0,76 1,00...) – 75 kg/ha; total
      weight of fertilizer application on the field – 7250 kg; average dose of fertilizer – 97 kg/ha;
          - second top dressing: low-180 kg / ha, medium-140 kg/ha, high-100 kg/ha; total weight
      of fertilizer applied in the field-10500 kg; average fertilizer application dose-141 kg/ha.

                                 a
                                                                                         b
      Fig. 4. Maps-feeding tasks for field 2.2: a – first; b – second.

                                                           3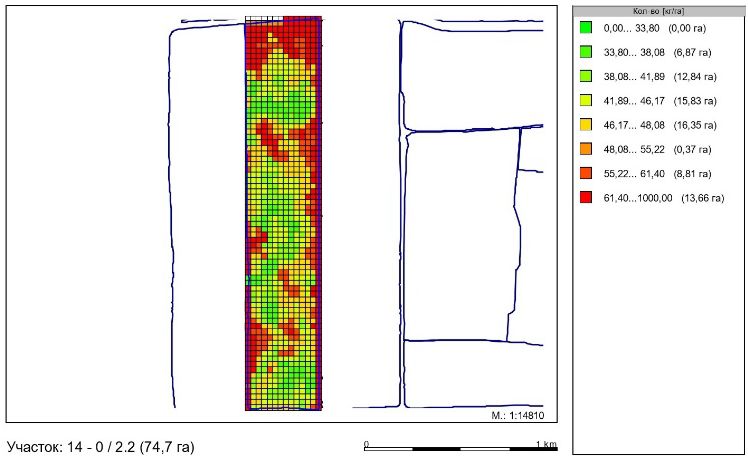
E3S Web of Conferences 285, 01016 (2021) https://doi.org/10.1051/e3sconf/202128501016
ABR 2021
The analysis of plant developmentwas performed using satellite images in the
KosmosAgro system for plant vegetation (NDVI index) based on the basic, analytical and
NDVI distribution scales.
Comparing the fields, we can see that after 17.03.2020, the best development of plants
in field 2.3 occurs-Figure 5.
20.01.2020 8.03.2020 17.03.2020 26.03.2020 10.04.2020
18.04.2020 25.04.2020 30.04.2020 11.05.2020
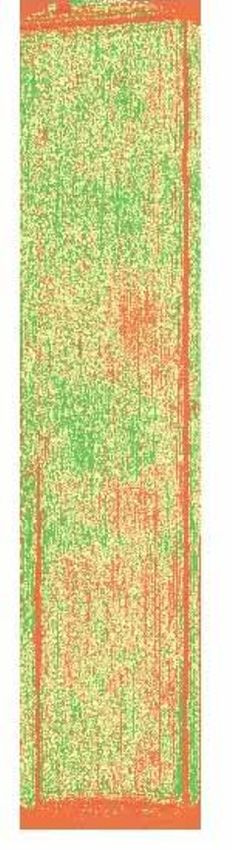
Fig. 5. Analysis of plant development from satellite images (NDVI distribution): left – field 2.2,
right-field 2.3
Before the first top dressing in field 2.2, the area of the field with the index NDVI =
0.53 was
37 %, in field 2.3 with the index NDVI = 0.52-32 % (Table 1).
After 18 days after the first feeding, the situation has not changed – the highest
percentage is higher in field 2.2. After 27 days, the situation changes and field 2.3 takes the
lead (7 % higher).
This trend continues even after the second feeding in 3 (26.03.2020) and 15
(10.04.2020) days.
Wheat harvesting was carried out on July 5-6, 2020 by Tucano 450, 480, 580 combines
with Telematics system (Figure 6).
Fig. 6. Harvesting.
4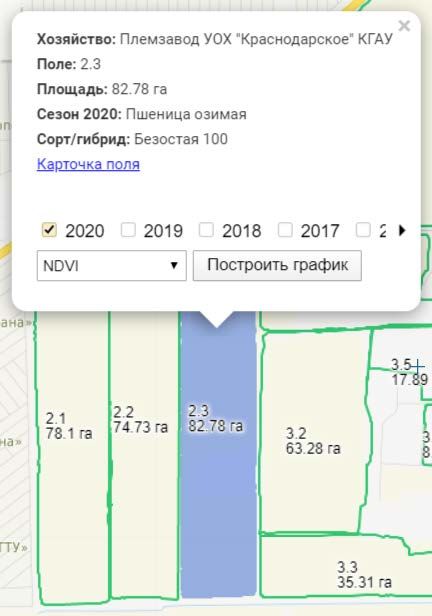
E3S Web of Conferences 285, 01016 (2021) https://doi.org/10.1051/e3sconf/202128501016
ABR 2021
Table 1. Comparative analysis of fields by the highest value of the NDVI index.
20.01.2020
17.03.2020
26.03.2020
10.04.2020
18.04.2020
25.04.2020
30.04.2020
11.05.2020
8.03.2020
Field
8.03.2020
NDVI %
NDVI
NDVI
NDVI
NDVI
NDVI
NDVI
NDVI
NDVI
%
%
%
%
%
%
%
%
%
0,53
0,72
0,76
0,60
0,79
0,81
0,81
0,79
2.2
0,7
37
30
27
33
32
24
36
31
43
0,52
0,70
0,77
0,61
0,80
0,74
0,82
0,82
0,81
2.3
32
23
34
33
46
30
43
42
41
The average yield values obtained in the Telematics system (Figure 7) for field 2.2 were
7.03 t/ha (actual 6.44 t/ha), for field 2.3 – 6.81 t/ha (actual 6.59 t/ha). Averaging the values
for preliminary, actual and mapping yields, we get the same values for the compared fields
of 7 t / ha.
a b
Fig. 7. Field yield maps:a-2.2; b-2.3.
5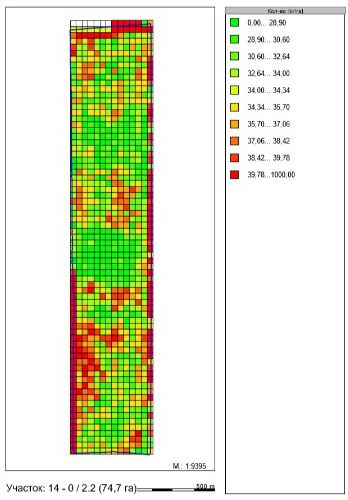
E3S Web of Conferences 285, 01016 (2021)                             https://doi.org/10.1051/e3sconf/202128501016
ABR 2021

         A program developed by AIS LLC was used to highlight pixels corresponding to green
      biomass in the obtained images, including those taken from an unmanned aerial vehicle
      (UAV). This program, based on preliminary training based on marked-up images of various
      green leaves, generates a certain indicator, hereinafter referred to as the bioindex (BIO).
      This indicator is a measure of the amount of chlorophyll corresponding to an image pixel.
      The higher the BIO value, the higher the chlorophyll content.
         To study the relationship between the bioindex values and winter wheat yield, we used
      images of winter wheat fields at the time of applying the first and second top dressing, as
      well as the results of yield measurements during harvesting. Field 2.2 has more than 1,200
      measurements, and Field 2.3 has more than 2,200 measurements.
         The values of the bioindex variation obtained when processing field photographs taken
      with UAVs and the resulting map of actual yield are shown in Figure 8 (Field 2.2).

                                a                                                     b
      Fig. 8. Maps of the field 2.2 bioindex during feeding: a – first; b – second.

                                                         6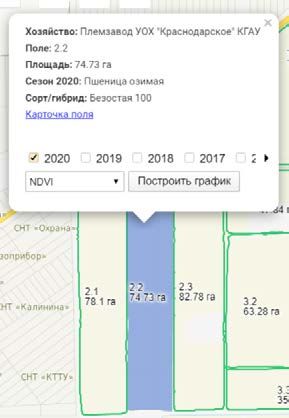
E3S Web of Conferences 285, 01016 (2021)                      https://doi.org/10.1051/e3sconf/202128501016
ABR 2021

          During harvesting, the geographical coordinates of the harvesting machine were
      measured and the yield was recorded. Based on the initial photos of the field during the
      second top dressing, the bioindex value was calculated and averaged over a 3x3 m plot
      centered at the coordinate point for which the harvest yield value was recorded. The values
      of the biondex-yield pairs obtained in this way were divided into classes. Each class
      included those pairs for which the yield value lies in a certain interval. For each of these
      classes, the average value of the bioindex for all pairs of this class was calculated.
          The correlation coefficient "yield-bioindex" for field 2.3 was 0.863. The correlation
      coefficient "yield-smoothed bioindex" was 0.974. Averaging was carried out by taking the
      average value of the bioindex for neighboring three points.
          If the bioindex values are low, there are few plants per unit field area and the yield is
      low. As the bioindex value increases, the number of plants (biomass) per unit field area
      increases and the yield increases. If weeds grow in the field, then the corresponding place
      will have a high bioindex and biomass value, but low yield (weeds contribute to the amount
      of chlorophyll, but do not contribute to the yield). If pests appear in the field (for example,
      mouse colonies) the bioindex at the time of shooting may be high due to the good
      development of plant biomass, and the yield in the affected area may be low due to pest
      destruction before harvesting. This introduces an additional spread in the bioindex values
      for field sections with the same yield.
          The bioindex calculated from field photos taken with a UAV standard color camera
      without using multispectral equipment strongly correlates with wheat yield. This allows to
      predict crop yields based on field photos, plan the distribution of the rate of application of
      top dressing and fertilizers over the field area, depending on the biomass, in order to reduce
      costs and optimize available resources.
          As a result of the comparative tests of differentiated fertilizer application for wheat
      using task maps and nitrogen scanners, the calculation of economic efficiency was
      performed taking into account the actual area of fields participating in the experiment
      without scaling to the total area for fertilizer application on the farm.
          The calculation of economic efficiency showed that when using nitrogen scanners,
      fertilizers are saved on average 16 kg / ha, compared to the mode of creating task maps
      based on the NDVI index based on satellite data without losing grain yield and quality
      (gluten content increased by 2.3 %; protein content-0.6 %).
          Calculation of the cost-effectiveness of using the bioindex obtained by processing
      images from UAVs showed that additional savings are possible compared to using task
      maps for differentiated fertilization, created on the basis of the NDVI index obtained from
      satellite data. The average fertilizer savings will be 10 kg / ha.

      The study was carried out with the financial support of the Kuban Science Foundation in the
      framework of the scientific project No. 20.1 / 73.

      References
      1.   Truflyak E. V. Questionnaire results department of the departmental project «Digital
           agriculture» / E. V. Truflyak, N. Y. Kurchenko // II International Scientific Conference
           GCPMED 2019 «Global Challenges and Prospects of the Modern Economic
           Development». European Proceedings of Soial & Behavioural Sciences EpSBS e-
           ISSN: 2357-1330. – 2020. – LXXIX – GCPMED.– P. 1565–1569. DOI:
           10.15405/epsbs.2020.03.224.
      2.   Truflyak E. V. (2019) Remote monitoring of risks and heterogeneity algorithm.
           Modern problems of remote sensing of the Earth from space. Volume 16, No. 3. pp
           110-124. http://d33.infospace.ru/d33_conf/sb2019t3/110-124.pdf.

                                                    7
E3S Web of Conferences 285, 01016 (2021) https://doi.org/10.1051/e3sconf/202128501016
ABR 2021
3. Trubilin E. I. Multilevel Systematic Approach To Optimization Of Corn Grain
Harvesting, Transportation, Post-Harvesting Processing And Storage / E. I. Trubilin,
E. V. Truflyak, S. M. Sidorenko // Research Journal of Pharmaceutical, Biological and
Chemical Sciences. – 2016. – №7(2). – P. 1426–1437.
4. Maslov G. G.. Parameters Optimization for Multifunctional Aggregates in Plant
Growing Mechanization / G. G. Maslov, E. I. Trubilin, E/ V/ Truflyak // Research
Journal of Pharmaceutical, Biological and Chemical Sciences. – 2016.– №7(3). – P.
1919–1926.
5. Tsarev Y. A. Parameters Adaptive system of parameter settings of self-moving
harvesters – threshers’ operational procedures / Yuriy Aleksandrovich Tsarev, Evgeny
Ivanovich Trubilin, Evgeniy Vladimirovich Truflyak and Elena Yuryevna
Adamchukova // Research Journal of Pharmaceutical, Biological and Chemical
Sciences. – 2017.– №8(1). – P. 1847–1851.
6. Precision agriculture technology for crop farming / Edited by Qin Zhang. –
Washington State University Prosser, Washington, USA, 2016. – 382 с.
7. Ministry of Agriculture of Russia [Electronic resource]. - Access mode: http://mcx.ru.
8. The strategy of scientific and technological development of the Russian Federation:
Decree of the President of the Russian Federation dated 01.12.2016, No. 642. - 2016. -
24 p.
9. Situational centers [Electronic resource]. - Access mode: http: //www. sitcenter.rf.
10. Truflyak I. S. New cutting apparatus of mowers / I. S. Truflyak, E. I. Trubilin //
Proceedings of the VI All-Russian. scientific-practical conf. young scientists /
KubSAU. - Krasnodar, 2012. - P. 370–371.
8You can also read