Canberra 17 September 2015 - Bureau of Infrastructure, Transport and ...
←
→
Page content transcription
If your browser does not render page correctly, please read the page content below
Canberra
                                               17 September 2015

Photo courtesy and copyright: Website source

                                                     © All Rights Reserved.   1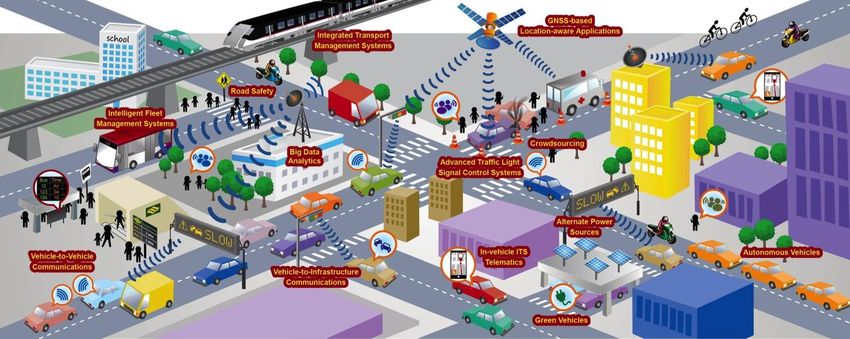
Case Study on
       Singapore’s Land Transport Master Plan
                           17 September 2015

Looi Teik Soon
Dean, LTA Academy
Land Transport Authority

                                                © All Rights Reserved.   2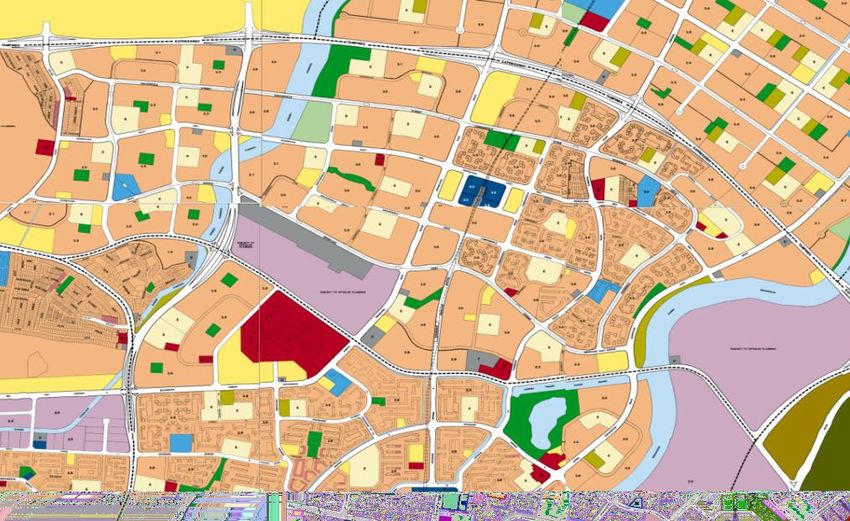
At a glance
•   How do we fare?
•   How do we plan?
•   What’s in the Land Transport Master Plan?
•   What’s next?

                  Centre for Liveable Cities (CLC)
             A Framework for Preparing and Developing
                                        a Liveable City

                                                          © All Rights Reserved.   3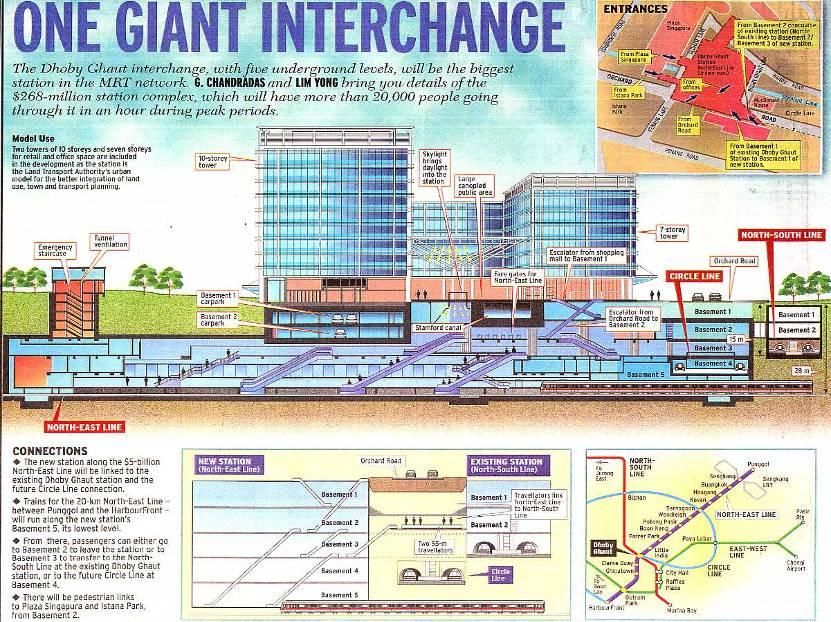
How do we fare?
  We have come a long way in a
relatively short period of 50 years

                                      © All Rights Reserved.   4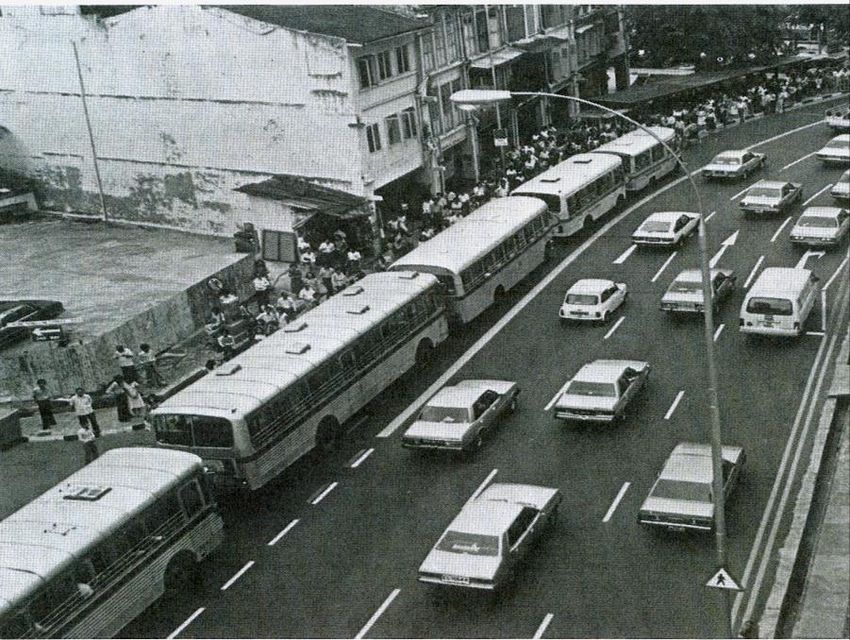
A compact city-state.
                                    Population: 5.5 million
          25 km                     Land area: 718 sq km
49 km                               Roads: 12%

              15%
                    12%
                          Housing
        73%
                          Roads
                          Others

                                    Photo courtesy and copyright: URA, Singapore

                                                                                   © All Rights Reserved.   5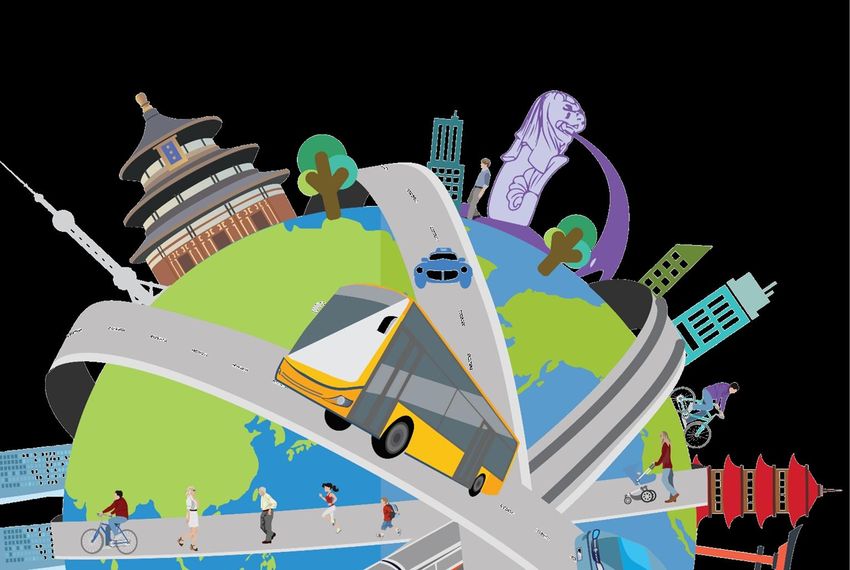
We transformed from this …
                                                    • Traffic congestion
                                                    • Rising travel demand
                                                    • Unreliable bus services

Photo courtesy and copyright: Hansen Report ,1980

                                                                            © All Rights Reserved.   6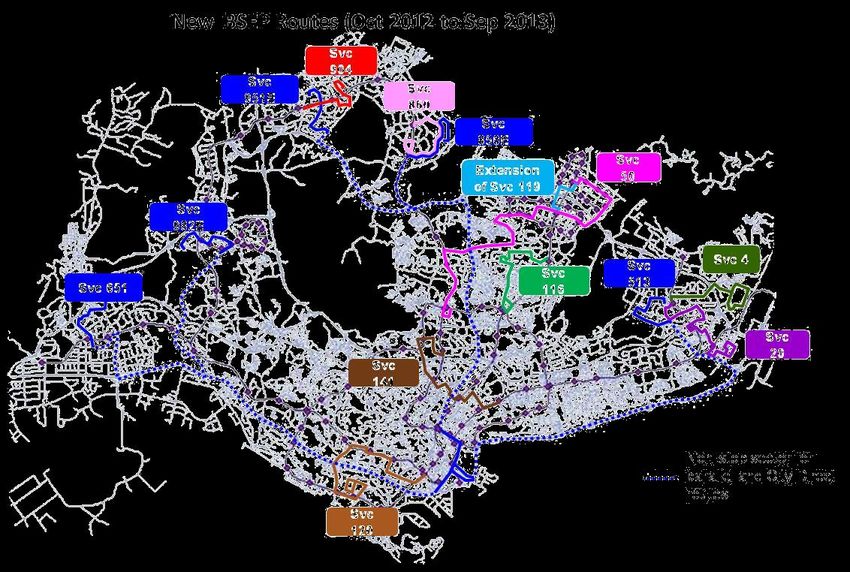
… to a modern metropolis
 • Efficient and sustainable urban transport system

                                                      © All Rights Reserved.   7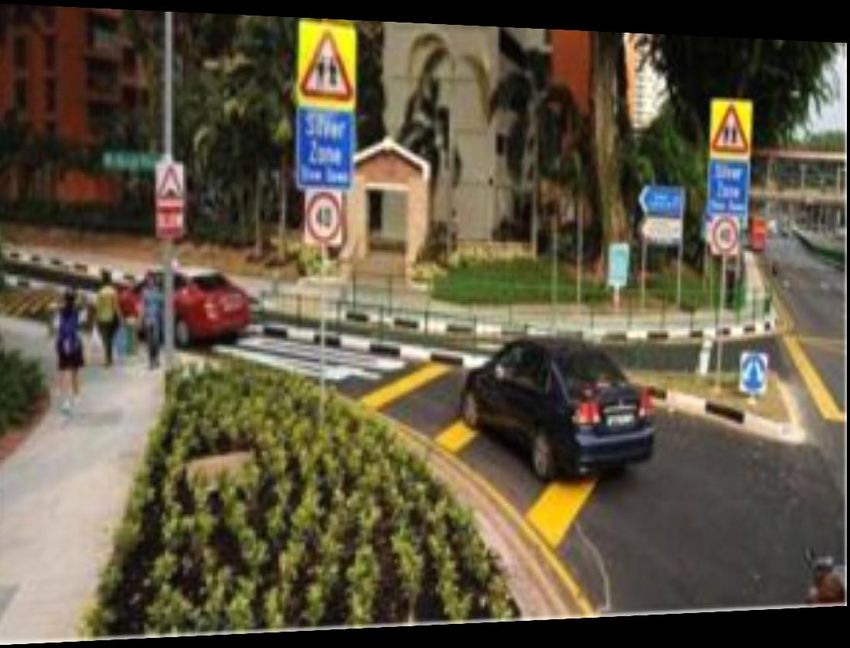
We put public transport at the core
 • More choices, affordable and viable public transport

                       1 million        2.9 million 3.8million
                       Daily Taxi trips Daily Rail trips Daily Bus trips

Total public transport trips – 7.7 million
Average daily travel figures for the year 2014

                                                                © All Rights Reserved.   8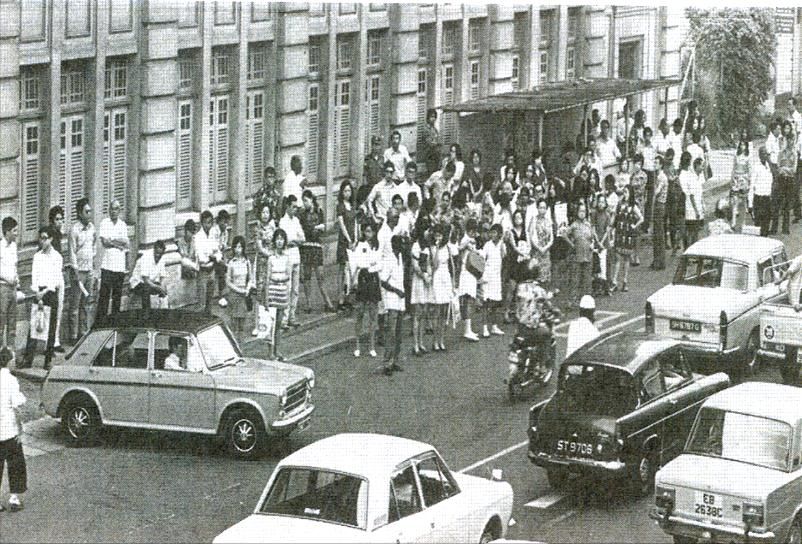
We rely on bus and rapid transit system
• Comprehensive coverage Backbone of public transport
• 3 operators - SMRT Buses, SBS Transit, 2 operators - SMRT Trains & SBS
Tower Transit* Transit
• > 357 services, > 4,552 buses 182 km of MRT & LRT Lines
• Fares and services are regulated Fares and services are regulated
• Transition to government contracting Competitive tendering for operating
model (GCM) licences
* Revenue service in early 2016
© All Rights Reserved. 9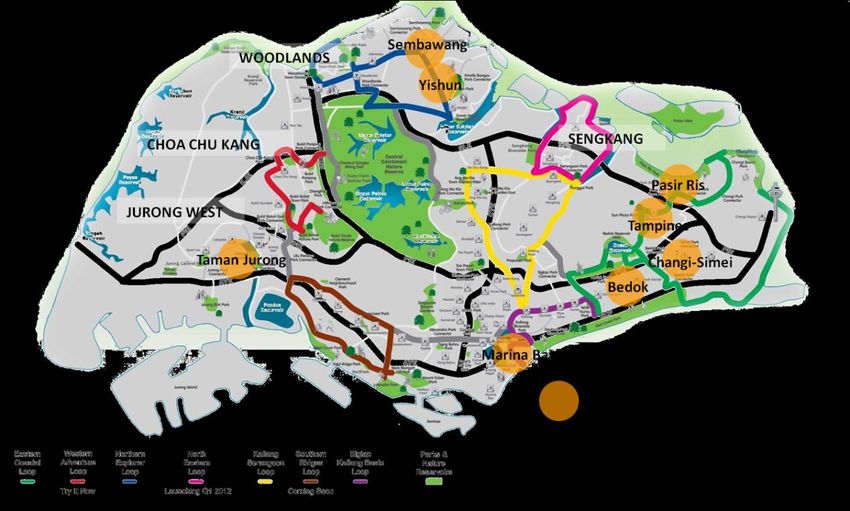
Bus and rail are comparatively well used
Bus 1.0
Rail
0.9 y = 0.0006x - 0.0508 Tokyo
R² = 0.7048 Vienna
0.9
0.8 y = 0.8108x + 0.2647
Warsaw R² = 0.3819
London 0.8
0.7 Beijing
Daily rail ridership per person
Singapore Taipei 0.7
Daily Bus ridership per person
Guangzhou HongKong Seoul
0.6
Taipei
HongKong 0.6
New York
0.5
Seoul 0.5 Singapore
Madrid
Stockholm London
0.4
Stockholm 0.4 Guangzhou
Madrid Berlin
Shanghai Barcelona
0.3 Berlin
0.3 Beijing
Chicago
Washington DC Shanghai
0.2 Vienna New York
0.2 Warsaw
Sydney Chicago
Barcelona
Sydney Melbourne
0.1 Tokyo Melbourne 0.1
Washington DC
0.0 0.0
0 200 400 600 800 1,000 1,200 1,400 0 0.1 0.2 0.3 0.4 0.5 0.6
Bus fleets per million person Number of stations per km2
Source: The Journeys, LTA, 2013
© All Rights Reserved. 10High mode share and low private cars
100% 60
Sydney
Warsaw y = 0.0004x + 14.072
90% HongKong Melbourne
R² = 0.1797
y = -0.0079x + 0.7566
Public transport mode share of motorised trips
R² = 0.5312 50
80% Tokyo
Private cars per 100 persons
70% Seoul
Madrid
Singapore 40 Stockholm
Shanghai Barcelona Vienna
60% Guangzhou Barcelona
Beijing Madrid
Berlin
Vienna London
50% 30
Taipei Warsaw
Berlin
New York
40% London
Stockholm Taipei New York
20 Seoul
30% Tokyo
Melbourne
Beijing
20%
Sydney 10 Guangzhou
Singapore
10% HongKong
Shanghai
0% 0
0 10 20 30 40 50 60 10,000 20,000 30,000 40,000 50,000 60,000 70,000
Private cars per 100 persons
GDP per capita (US$)
Source: The Journeys, LTA, 2013
© All Rights Reserved. 11But, we do have challenges
Growing Competing Changing Profits vs
Population Demands Commuter Performance
and Economy for Limited Expectations of PTOs
Land and Norms
Population Restructuring
White Paper: 12% of land Commuter- the Public
6.0mil by for roads vs centric and Transport
2020, 6.9mil 14% of land inclusive Industry
by 2030* for housing transport
system
*parameters adopted for infrastructure planning
© All Rights Reserved. 12How do we plan?
Integrating planning and development
has been our key strategy
© All Rights Reserved. 13An integrated hub-and-spoke network
HDB Towns Transport Hub City
• Feeder/MRT journeys
• Long-haul journeys in corridors
Town A not yet well served by MRT
• Serve local needs or short
journeys
Town C
• Make transfers seamless and
take care of first-mile last-mile
Town B
© All Rights Reserved. 14Our master planning is holistic
Concept Plan Land Use Plan Beyond 2030
1972
Concept Plan1991
Map courtesy and copyright: URA, Singapore
© All Rights Reserved. 15We take a strategic long term view
Planning Process
Long Term Long term plans
Concept Plan
RTS/bus and RMP 30-40 years
Medium term plans
Medium Term RTS Master Plan 10-15 years
and Road Plans
Planning Feasibility
Near term plans
Studies 5-10 years
5 Year Road Rail Lines and
Development Bus Network
Programme
© All Rights Reserved. 16Why long range transport planning?
• Value capture - promote high
density, transit oriented
developments Integration of transport and towns
• Optimise land-take
• Maximise value capture
• Enhance system viability
• Shape travel needs and car
dependency
• Safeguard future transport
corridors
© All Rights Reserved. 17Some examples of integrated
developments…
• A mix of uses
• High density
• Good connectivity
• Transportation choices
• High quality design
PUNGGOL LRT SYSTEM ROUTE
Sengkang
Station
Sengkang Town
© All Rights Reserved. 18Dhoby Ghaut Interchange
Info-graphics courtesy and copyright: The Straits Times, Singapore
© All Rights Reserved. 19What’s in the
Land Transport Master Plan 2013?
A flavour of the road-map is presented here
© All Rights Reserved. 20A people-centred land transport system
More
Connections
Enhancing
Your Travel
Better Experience Liveable and
Inclusive
Service
Community
Reduce reliance on private transport
© All Rights Reserved. 21LTMP key targets by 2030
75% 8 in 10
Of all journeys in peak HOUSEHOLDS
hours undertaken on
public transport
85%More Connections
© All Rights Reserved. 23A denser rail network with greater
coverage and resilience
Jurong Thomson Cross
Region Line Island
North East Line
Line Line
Extension
Downtown
Tuas West Line
Extension
Downtown Line
Extension
Eastern Region Line
Downtown North-South Line
Line Extension
Today 2030 Circle Line Stage 6
6 Rail Lines with 11 Rail Lines with Blue: Opening by 2022
15 interchanges 40* interchanges Red: Opening by 2030
*Indicative
© All Rights Reserved. 24More choices, more connecting bus services
LTA as the More City Direct
central bus planner Services
© All Rights Reserved. 25Promote active mobility
• National Cycling Plan
• Cycling Infrastructure Walk2Ride
200km
• Bike Sharing
Additional covered
link-ways by 2018
CONFIDENTIAL © All Rights Reserved. 26Better Service
© All Rights Reserved. 27Ramp up train services
• More trains mean shorter waiting times and less
crowding for commuters
*
Punggol LRT NSL
West Loop Extension
Opening Opening
2H2014 End-2014
*First 2 trains in service; last train in by 3Q2014
© All Rights Reserved. 28We want to ramp up bus services quickly to:
Increase connectivity Reduce crowding Increase reliability
Bus Service Enhancement Programme
(BSEP)
• Additional 1000 buses by 2017 to relieve
crowding and reduce waiting time
• 80 new bus services to improve connectivity
• Contracting private operators to provide City Quality Incentive Framework
Direct Services and Peak Period Short Services Incentivize operators based on
to further augment service levels regularity of en-route arrival
times at bus stops.
Bus Priority Schemes
Give buses more priority on roads with dedicated bus
lanes and mandatory give-way to buses schemes
© All Rights Reserved. 29Transition to GCM
Gradual transition to ensure stability for the industry and workers
All bus routes grouped into 12 packages
Area-based, centered around depots
About 300-500 buses for each package
Three packages to be tendered out (20% of existing buses)
5-year contracts, option for 2-year extension
Remaining 9 packages to be operated by incumbents (80% of
existing buses)
Loyang Package
Negotiated contracts for
5 years or more
Bulim Package
© All Rights Reserved. 30Promote a smarter way to travel
Smoothen travel demand around peak hours
Off-peak travel incentives for commuters
Free $0.50 Win
travel if you exit
discount if you
at designated
stations before
exit from prizes
7.45 to 8am with your points
7.45am
Engagement of key employers
Public sector taking the lead
© All Rights Reserved. 31Provide timely and reliable info
Live traffic on social Bus and trains arrival
Smartphone traffic apps
media information system
Real-time info on the move Comprehensive and Reliable, relevant and
– anytime, anywhere Integrated transport Info intuitive infoLiveable & Inclusive Community
CONFIDENTIAL © All Rights Reserved. 33Make public transport even more inclusive
• Barrier-free at all MRT stations and bus interchanges
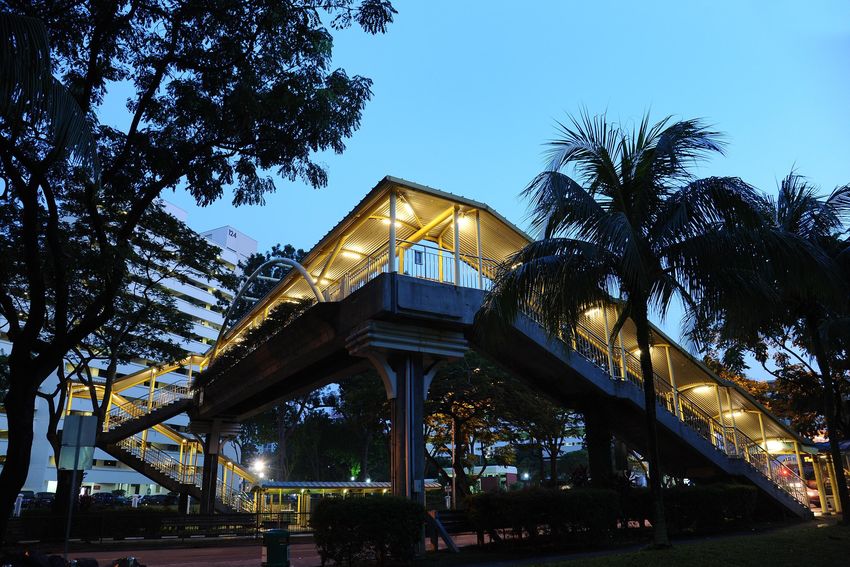
• Lifts at pedestrian overhead bridges
• All buses to be wheelchair-accessible
• More wheelchair-accessible taxis
© All Rights Reserved. 34… and more inclusive streets
Expand Green Man + Scheme
More silver zones
© All Rights Reserved. 35Reducing Reliance on Private Transport
© All Rights Reserved. 36Rely less on private transport
Change overall narrative from “I want a car”
to “Why would I even want a car”
© All Rights Reserved. 37Ownership restraint: Vehicle quota system
• New vehicle registration is controlled, while the market
determines the price of owning a vehicle
• Open on-line bidding for Certificate of Entitlement (COE)
Price vs Quota
Vehicle growth rate
© All Rights Reserved.Usage restraint: Electronic Road Pricing (ERP)
• Both cordon-based and point-based
• Equitable - motorists pay for
congestion costs imposed on others
or choose to travel at different time,
route or use public transport
• ERP rates - determine based on local
traffic conditions, vehicle types,
location and time of the day
© All Rights Reserved.More flexible spatial and temporal pricing
• ERP rates reviewed every 3 months
• 85% of motorists assured of smooth
travel within the optimal speed ranges
Expressways 45 km/h 65 km/h
Increase rate Optimal Speed Range Decrease rate
Increase rate Optimal Speed Range Decrease rate
20 km/h 30 km/h Other Roads
© All Rights Reserved.How are speed ranges determined?
• Rates are adjusted to keep traffic within
optimal Level of Service (LOS)
Unstable
Zone
Max flow
41
© All Rights Reserved. 41Effectiveness is self-evident
Index
Car Growth
Vehicle
Start of ERP Growth
Population
Start of ALS Growth
Road
Growth
CBD Traffic (Am peak)
© All Rights Reserved. 42Next generation ERP
Today: Point Charging ERP2: Distance Charging
GNSS technology
Benefits of ERP2:
•More cost-efficient: Removes the need to build more gantries
•Fairer: Charges motorists according to the congestion they cause
•Value-added services: e.g. coupon-less roadside parking
Expected timeline for implementation – around 2019/2020
© All Rights Reserved. 43What’s next?
A glimpse into what we are working on
© All Rights Reserved. 44Towards Future Mobility
© All Rights Reserved. 45Our ITS vision…
“Moving towards a more connected and
interactive land transport community”
Copyright © 2015 LTA © All Rights Reserved. 46
Info-graphics courtesy and copyright: LTA and ITS, 2014 All rights reservedReality of Autonomous Vehicles (AV) is here
Robosoft Google Catapult, UK Mercedes
BMW Audi Volvo
Photo courtesy and copyright: Various website sources
© All Rights Reserved. 47AV possibilities for land transport system
AV Mobility-On-Demand
AV automated driving for point-to-point travels using
whereby applications can a network of demand
enhance traffic management responsive shared vehicles
AV automated driving
AV Mobility-on-Demand
for “Car-lite” oriented town
Autonomous bus for a
mass transport service that “Platooning” of AVs and
operates on fixed routes and autonomous freight
scheduled timings. This can
alleviate Singapore’s heavy
reliance on manpower. Autonomous bus
AV Freight for
Autonomous utility movement of goods on
AV utility rubbish trucks, road expressways during
sweepers for effective night time. This can
navigation and operation alleviate traffic
during off-peak hours congestion during day
(e.g. navigating close to time and maximise road
road kerbs for cleaning) capacity
Photo credit and copyright: Various website sources
© All Rights Reserved.INNOVATING TRANSPORT FOR LIVEABLE CITIES
MARK YOUR CALENDAR
19-21 October 2016
www.sitce.org
SEE YOU IN SINGAPORE!
© All Rights Reserved.A great city to call home
Thank You
Photo courtesy and copyright: URA, Singapore
© All Rights Reserved. 50You can also read