New Brunswick Labour Force Trends - April 2021 - NBjobs.ca

Page created by Roberta Cook
 
CONTINUE READING
New Brunswick Labour Force Trends - April 2021 - NBjobs.ca
New Brunswick
Labour Force Trends
April 2021
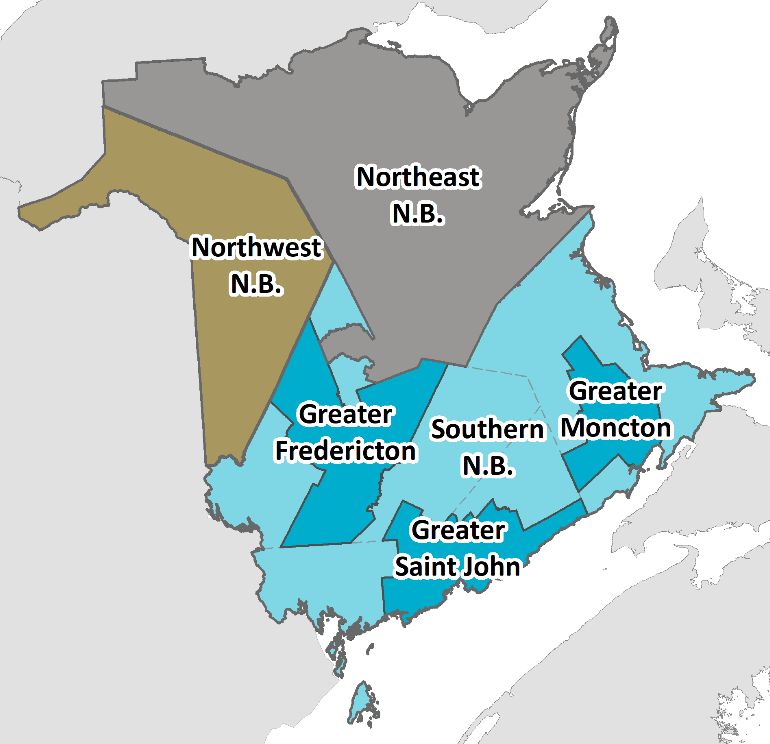
New Brunswick Labour Force Trends - April 2021 - NBjobs.ca
Table of Contents
Overview ................................................................................................................................................................................. 2
   Pre-Pandemic Trends .......................................................................................................................................................... 2
   COVID-19 Pandemic ............................................................................................................................................................ 3
Trends in Labour Force Participation ...................................................................................................................................... 5
   Pre-Pandemic Trends .......................................................................................................................................................... 5
   COVID-19 Pandemic ............................................................................................................................................................ 6
Industry Trends ....................................................................................................................................................................... 7
   Pre-Pandemic Trends .......................................................................................................................................................... 7
   COVID-19 Pandemic ............................................................................................................................................................ 8
Wages.................................................................................................................................................................................... 10
   Pre-Pandemic Trends ........................................................................................................................................................ 10
   COVID-19 Pandemic .......................................................................................................................................................... 11
Sub-Provincial ....................................................................................................................................................................... 11
   Pre-Pandemic Trends ........................................................................................................................................................ 11
   COVID-19 Pandemic .......................................................................................................................................................... 12
Education .............................................................................................................................................................................. 14

                                                                                  New Brunswick
                                                                 1                Labour Force Trends
Overview1                                                                       Within the labour force, the number of employed
                                                                                individuals (12-month average) in the province grew to
Pre-Pandemic Trends                                                             361,100 in 2019, up 0.8% (+2,700) from 2018. This
                                                                                represented the fourth consecutive year of employment
Throughout 2019, there were an average of 393,000                               growth in the province, after having had experienced
individuals participating in New Brunswick’s labour                             two consecutive years of declines. Nationally
force (i.e. employed or actively looking for work), up                          employment increased by 2.2% year-over-year.
0.8% (+3,300) from 2018. This represented the second
consecutive year of labour force growth in the province,                        Year-over-Year Change in Employment – 2018/19
after having had experienced four consecutive years of
declines. Nationally the labour force grew 2.1%.                                   Canada                       +2.2%
                                                                                         N.L.               +1.2%
Recent growth to the number of labour force
                                                                                      P.E.I.                               +3.4%
participants in New Brunswick has been driven primarily
                                                                                         N.S.                   +2.3%
by increased international migration levels. This growth,
                                                                                       N.B.             +0.8%
however, has been (and will continue to be) limited by
                                                                                      Que.                  +2.0%
the significant number of retirements that have been
                                                                                      Ont.                          +2.8%
occurring in the province in recent years.
                                                                                      Man.      +1.0%
Year-over-Year Change in Labour Force – 2018/19                                       Sask.               +1.9%
                                                                                      Alta.             +0.7%
      Canada                             +2.1%
                                                                                         B.C.                           +3.0%
           N.L.         -1.0%
        P.E.I.                               +2.5%
           N.S.                          +2.0%                                  Employment Growth Relative to 1999 – N.B., Atlantic
         N.B.                            +0.8%                                  Canada and Canada
         Que.                        +1.7%
                                                                                 +40%
         Ont.                                 +2.7%
                                                                                 +30%
        Man.                       +0.3%
                                                                                 +20%
        Sask.                    +1.2%
         Alta.                                                                   +10%
                                           +1.0%
           B.C.                                  +2.9%                              0%

Labour Force Growth Relative to 1999 – N.B., Atlantic                                       New Brunswick           Atlantic Canada   Canada
Canada and Canada
    +40%                                                                        The year-over-year employment increase in the
    +30%
                                                                                province was accompanied by a slight increase to the
    +20%
    +10%                                                                        unemployment rate, from 8.0% to 8.1%. Leading up to
      0%                                                                        this small increase, New Brunswick’s unemployment
                                                                                rate had decreased significantly between 2013 and
                                                                                2018 (although still far exceeded the national rate of
              New Brunswick        Atlantic Canada        Canada
                                                                                5.7%).

1   Source(s): Statistics Canada, Labour Force Survey, Tables 14-10-0287 and 14-10-0327.

                                                                New Brunswick
                                                            Labour Force Trends                 2
The recent downward trend in unemployment in the                                     COVID-19 Pandemic
province has primarily been the result of increased
employment opportunities arising as the result of                                    As a result of the COVID-19 pandemic, and the various
retirements.                                                                         restrictions and measures that were put in place in
                                                                                     response to it, the labour market was significantly
Unemployment Rate – N.B., Atlantic Canada and                                        impacted.
Canada
                                                                                     After starting the year off by reaching record high
    12%
                                                                                     employment levels, approximately 50,000 New
    10%
                                                                                     Brunswickers lost their jobs between February and
     8%
                                                                                     April. Despite this representing by far the largest two-
     6%
                                                                                     month decline in employment on record (with
     4%
                                                                                     comparable data available back to 1976), job loss
                                                                                     figures fail to capture the full extent of the pandemic’s
               New Brunswick           Atlantic Canada           Canada
                                                                                     impact. In addition to the previously mentioned
                                                                                     employment losses, nearly 30,000 individuals, while still
                                                                                     technically considered employed, were working zero
Unemployment Rate – 2019                                                             hours (for reasons likely attributable to the pandemic2)
      Canada
                                                                                     during the initial lockdown and more than 6,000
                                5.7%
           N.L.
                                                                                     individuals were working less than half of their usual
                                                         12.3%
          P.E.I.
                                                                                     hours.
                                              8.8%
           N.S.                        7.4%                                          While New Brunswick was significantly impacted at the
          N.B.                           8.1%                                        onset of the pandemic, due to its relatively low case
          Que.             5.1%                                                      count, it was among the first provinces to begin to
          Ont.                 5.6%                                                  recover. In June, New Brunswick had the lowest
          Man.                 5.3%                                                  unemployment rate in the country (tied with
          Sask.                5.6%                                                  Manitoba), and ranked first among the provinces in
          Alta.                       7.0%                                           terms of employment as a percentage of pre-pandemic
           B.C.           4.7%                                                       (February) levels, at 97.1% (with Manitoba ranking
                                                                                     second at 92.9%).

Labour Force Characteristics – New Brunswick
                                                       12-Month Averages                       Selected Months (Seasonally Adjusted)
                                                      2019          2020              Feb 2020        Apr 2020      June 2020       Feb 2021
    Population (Aged 15+)                            642,700       646,900             645,900        646,300        646,700         648,400
     Labour Force                                    393,000       390,700             394,000        363,600        395,400         394,200
      Employment                                     361,100       351,600             365,400        315,300        354,700         359,200
       Full-Time Employment                          306,900       299,900             314,100        275,400        299,700         302,200
       Part-Time Employment                          54,200        51,700              51,300          40,000         55,100         57,000
      Unemployment                                   31,900        39,100              28,600          48,300         40,700         35,000
    Participation Rate                                61.1%         60.4%               61.0%          56.3%          61.1%           60.8%
    Employment Rate                                   56.2%         54.4%               56.6%          48.8%          54.8%           55.4%
    Unemployment Rate                                 8.1%          10.0%                7.3%          13.3%          10.3%           8.9%

2Employed, worked zero hours includes employees and self-employed who were absent from work all week, but excludes people who have been
away for reasons such as 'vacation,' 'maternity,' 'seasonal business 'and labour dispute.'

                                                                          New Brunswick
                                                         3                Labour Force Trends
Employment Losses and Individuals Working Zero                                                                                                             Its important to note that while labour force and
Hours Relative to February 2020 – New Brunswick                                                                                                            employment levels towards the end of 2020 and
(Seasonally Adjusted)                                                                                                                                      through the beginning of 2021 pointed towards the
 100,000                                                                                                                                                   economy being close to a full recovery, many workers
  80,000                                                                                                                                                   were still working reduced hours and/or were employed
  60,000                                                                                                                                                   in jobs that were only able to exist due to government
  40,000                                                                                                                                                   support programs such as the Canada Emergency Wage
  20,000                                                                                                                                                   Subsidy. A full return to pre-pandemic levels of output
         0                                                                                                                                                 will likely stretch into 2022 (or beyond).
                                                                    Jul-20
                                                           Jun-20
                                         Apr-20
                                                  May-20

                                                                                                                   Nov-20
                                                                                Aug-20
                      Feb-20
                               Mar-20

                                                                                            Sep-20

                                                                                                                              Dec-20
                                                                                                                                        Jan-21
                                                                                                                                                  Feb-21
                                                                                                        Oct-20
                                   Employment Losses Relative to Feb 2020

                                   Employment Losses Relative to Feb 2020 +
                                   Individuals Working Zero Hours

Following this initial bounce back however, the recovery
slowed down. As of February 2021, employment in New
Brunswick had reached 98.3% of its February 2020 total
(compared to 96.9% at a national level).

Employment Relative to February 2020 (Seasonally
Adjusted)
                                                                                                              New Brunswick
 100%
  95%
                                                                                                                            Canada
  90%
  85%
  80%
                                                                Jul-20
                                             May-20
                                                       Jun-20
                                    Apr-20

                                                                                                                 Nov-20
                                                                             Aug-20

                                                                                                                            Dec-20
             Feb-20
                          Mar-20

                                                                                         Sep-20

                                                                                                                                       Jan-21
                                                                                                                                                 Feb-21
                                                                                                     Oct-20

Employment in February 2021 Relative to February
2020 (Seasonally Adjusted)

   Canada                                                                                                           96.9%
        N.L.                                                                                                  92.4%
     P.E.I.                                                                                                       95.2%
        N.S.                                                                                                              99.6%
        N.B.                                                                                                         98.3%
     Que.                                                                                                           96.8%
     Ont.                                                                                                          95.9%
     Man.                                                                                                           97.4%
     Sask.                                                                                                         96.0%
     Alta.                                                                                                          96.9%
        B.C.                                                                                                          99.4%

                                                                                                                                              New Brunswick
                                                                                                                                          Labour Force Trends        4
Trends in Labour Force Participation3                                          Participation Rate Among the Population Aged 25 to
                                                                               54 Years by Educational Attainment – 2019
Pre-Pandemic Trends                                                                                                        67.0%
                                                                                  Less than high school
                                                                                                                          63.6%
Throughout the ‘70s, ‘80s, ‘90s and 2000s, New
                                                                                                                                 81.8%
                                                                                  High school graduate
Brunswick’s labour force participation rate rose slowly                                                                          80.5%
but steadily. Between 1979 and 2009, the participation                                   Postsecondary                               90.7%
rate among typical working-age individuals (aged 15 to                              certificate/diploma                              89.4%

64 years) grew from 62.4% to 76.3%. Increases in                                                                                     90.9%
                                                                                      University degree
                                                                                                                                      94.1%
labour force participation over this time were primarily
driven by increased participation among women. During                                                Canada        New Brunswick

this time, the participation rate among typical working-
age women in New Brunswick increased by 25.4                                   Sex-specific participation rates, and the gaps between
percentage points (from 47.4% to 72.8%), compared to                           them, vary significantly by age; however, in general,
2.2 percentage points among typical working-age men                            women are less likely to be participating in the labour
(from 77.6% to 79.8%).                                                         force than men across nearly all age categories (with
                                                                               the one exception in New Brunswick in 2019 being the
Since this time, increases in participation have slowed                        “25 to 29 years” age range).
down. As of 2019, the participation rate among typical
working-age individuals in the province was 77.1%                              Participation Rate by Sex and Age Group – New
(74.5% among women and 79.7% among men).                                       Brunswick – 2019
Nationally, the typical working-age participation rate
                                                                                                                     54.7%
was 78.7% in 2019 (75.2% among women, 82.2% among                                   15 to 19 years
                                                                                                                     54.8%
men).                                                                                                                           80.4%
                                                                                    20 to 24 years
                                                                                                                               76.5%
Participation Rate Among Population Aged 15 to 64                                                                                   88.0%
                                                                                    25 to 54 years
Years - New Brunswick                                                                                                              84.5%
                                                                                                                             76.1%
    100%                                                                            55 to 59 years
                                                                                                                          68.9%
     80%                                                                                                               60.9%
                                                                                    60 to 64 years
                                                                                                               45.4%
     60%
                                                                                                       26.6%
                                                                                    65 to 69 years
     40%                                                                                             17.2%
                                                                                                                                        Males
     20%                                                                                                  10.4%
                                                                                70 years and over
                                                                                                                                        Females

                 Both sexes           Males              Females

Recent increases in labour force participation among
the typical working-age population have primarily been
the result of increased participation among older
individuals. Participation rates among younger age
groups have generally not changed significantly since
2009.

3   Source(s): Statistics Canada, Labour Force Survey, Tables 14-10-0117, 14-10-0118, 14-10-0287 and 14-10-0327.

                                                                   New Brunswick
                                                     5             Labour Force Trends
COVID-19 Pandemic                                                      One factor that may be contributing to this trend could
                                                                       be the type of work that is available. Students and other
While some workers were fortunate enough to only be                    youth without post-secondary credentials may be more
laid off for a short period of time during the initial                 willing than post-secondary graduates to accept low-
lockdown, many others were laid off indefinitely or                    skill and/or part-time job opportunities.
permanently. This led to a sharp reduction in labour
force participation, particularly among the youth                      Year-over-Year Change in Participation Rate Between
population.                                                            Dec 2019 to Feb 2020 and Dec 2020 to Feb 2021 (3-
                                                                       Month Averages) by Age and Educational Attainment
In April, the participation rate among individuals aged                – New Brunswick
15 to 24 years was down 11.3 percentage points year-
over-year (50.9% in April 2020 compared to 62.2% in                                                                            +8.2 p.p.
                                                                              15 to 24 years
                                                                                                              -2.0 p.p.
April 2019). This drop included a 14.0 percentage point
year-over-year drop among individuals in this age range                                                                    +0.7 p.p.
with only a high school diploma or less and a 9.8                             25 to 54 years
                                                                                                                           +0.4 p.p.
percentage point drop among individuals with post-
secondary credentials. These decreases were                                                                 -3.3 p.p.
                                                                         55 years and over
significantly larger than those seen among the                                                                                 +1.4 p.p.
population aged 25 years and over.
                                                                                           High school diploma or less

Year-over-Year Change in Participation Rate Between                                        Postsecondary certificate/diploma
April 2019 and April 2020 by Age and Educational
Attainment – New Brunswick                                             Another group that has somewhat struggled to recover
                                                                       has been individuals aged 55 years and over with a high
                       -14.0 p.p.
    15 to 24 years                                                     school diploma or less, particularly women.
                                -9.8 p.p.

                                         -6.2 p.p.
    25 to 54 years
                                            -4.8 p.p.

                                                        +1.0 p.p.
 55 years and over
                                    -3.4 p.p.

                 High school diploma or less
                 Postsecondary certificate/diploma

More recent estimates suggest that the participation
rate in the province has since recovered to near pre-
pandemic levels among many groups, despite
unemployment remaining relatively high. While labour
force participation among the youth population as a
whole has seemingly recovered, participation among
those with post-secondary credentials has continued to
lag behind, while participation among youth with a high
school diploma or less has seen a noticeable increase.

                                                            New Brunswick
                                                        Labour Force Trends           6
Industry Trends4                                                                 Between 2014 and 2019, the greatest employment
                                                                                 growth was seen in the following sectors:
Pre-Pandemic Trends                                                                     •     Agriculture (+45.0%; 4,000 to 5,800)
                                                                                        •     Information, culture and recreation (+20.2%;
Employment in the following sectors was proportionally
                                                                                              10,900 to 13,100)
much more common in New Brunswick compared to
the country as a whole in 2019:                                                         •     Health care and social assistance (+18.0%;
                                                                                              51,700 to 61,000)
       •    Fishing, hunting and trapping
                                                                                        •     Public administration (+16.4%; 22,500 to
       •    Forestry and logging and support activities for
                                                                                              26,200)
            forestry
       •    Public administration                                                In contrast, the following sectors saw the greatest
       •    Health care and social assistance                                    employment losses during this time:
                                                                                        •     Mining, quarrying, and oil and gas extraction
On the other hand, employment in the following sectors
                                                                                              (-26.3%; 5,700 to 4,200)
was proportionally much less common in New
                                                                                        •     Business, building and other support services
Brunswick compared to the country as a whole in 2019:
                                                                                              (-16.4%; 19,500 to 16,300)
       •    Professional, scientific and technical services
                                                                                        •     Forestry and logging and support activities for
       •    Finance, insurance, real estate, rental and
                                                                                              forestry (-16.3%; 4,300 to 3,600)
            leasing
       •    Information, culture and recreation

Employment by Sector - New Brunswick - 2019

                                                    Agriculture        5,800
       Forestry and logging and support activities for forestry      3,600
                                 Fishing, hunting and trapping     2,400
                 Mining, quarrying, and oil and gas extraction       4,200
                                                       Utilities     3,600
                                                  Construction                         25,000
                                                Manufacturing                                   31,500
                                    Wholesale and retail trade                                                     52,100
                             Transportation and warehousing                   18,900
            Finance, insurance, real estate, rental and leasing            16,700
                 Professional, scientific and technical services             17,200
                Business, building and other support services              16,300
                                          Educational services                              27,500
                             Health care and social assistance                                                              61,000
                          Information, culture and recreation        13,100
                           Accommodation and food services                       21,900
                Other services (except public administration)         14,000
                                         Public administration                          26,200

4   Source(s): Statistics Canada, Labour Force Survey, Tables 14-10-0023 and 14-10-0026.

                                                                   New Brunswick
                                                        7          Labour Force Trends
COVID-19 Pandemic                                                                       Since April, many industries have begun to recover,
                                                                                        although many still remain vulnerable. A few of the
There were very few businesses that were not affect by                                  industries that continue to be heavily impacted include:
the pandemic-driven lockdown measures. The bulk of
                                                                                            •     Tourism-related industries
the job losses that occurred at the onset of the
                                                                                            •     Agriculture
pandemic were in the private sector however, with
                                                                                            •     Construction
businesses in the following sectors being among the
hardest hit:                                                                            Its important to note that even among industries that
   •   Tourism-related industries (accommodation and                                    have shown signs of recovery, in many cases, the
       food services, information, culture and                                          recovery was not only the result of the easing of
       recreation, travel, etc.)                                                        restrictions but may have also been due to the
   •   Construction                                                                     introduction of government support programs such as
   •   Retail trade (with some exceptions such as food                                  the Canada Emergency Wage Subsidy (CEWS). Close to
       retailers, building supplies stores and general                                  $1 billion had been paid out to New Brunswick
       merchandise stores)                                                              employers (and in turn, employees) through the CEWS
   •   Business support services (e.g. call centres)                                    as of February 2021. Uptake for the CEWS was
   •   Personal and laundry services (e.g. hairdressers)                                particularly high in the accommodation and food
   •   Manufacturing                                                                    services sector.
   •   Agriculture

Year-over-Year Change in Employment Between April 2019 and April 2020 by Sector - New Brunswick
        Public sector

                                          Health care and social assistance                                                                   +6.1%
                                                       Educational services                                              -10.2%
                                            Other public sector employees                                                        -4.3%
                             Professional, scientific and technical services                                                          -1.8%
                                          Transportation and warehousing                                                         -5.0%
                         Finance, insurance, real estate, rental and leasing                                                  -9.0%
                                                Wholesale and retail trade                                            -14.1%
                                          Health care and social assistance                                          -15.2%
                                                              Construction                                      -17.9%
        Private sector

                           Forestry, fishing, mining, quarrying, oil and gas                                 -21.5%
                             Business, building and other support services                                   -22.1%
                                                            Manufacturing                                   -23.5%
                                                                Agriculture                        -32.6%
                                       Information, culture and recreation                       -35.0%
                                                             Other services                     -36.4%
                                        Accommodation and food services                 -43.6%
                                           Other private sector employees      -52.6%

                                                                          New Brunswick
                                                                      Labour Force Trends            8
Year-over-Year Change in Employment Between Dec 2019 to Feb 2020 and Dec 2020 to Feb 2021 (3-Month Averages) by
Sector - New Brunswick
        Public sector

                                          Health care and social assistance                                                     +13.7%
                                                       Educational services                                                 +5.5%
                                            Other public sector employees                                                     +10.1%
                         Finance, insurance, real estate, rental and leasing                                                  +9.4%
                                                Wholesale and retail trade                                                  +6.4%
                                                             Other services                                         -0.7%
                             Professional, scientific and technical services                                        -0.8%
                                        Accommodation and food services                                        -6.0%
                                          Health care and social assistance                                  -7.0%
        Private sector

                                                            Manufacturing                                    -7.5%
                           Forestry, fishing, mining, quarrying, oil and gas                                -8.5%
                                          Transportation and warehousing                                    -9.1%
                             Business, building and other support services                                -10.8%
                                                              Construction                            -14.2%
                                       Information, culture and recreation                       -23.5%
                                                                Agriculture                -29.1%
                                           Other private sector employees                 -30.6%

                                                                           New Brunswick
                                                              9            Labour Force Trends
Wages5                                                                         When comparing high-level wage or income statistics
                                                                               such as these, it’s important to keep in mind that there
Pre-Pandemic Trends                                                            are a number of factors that may be having an
                                                                               influence, such as:
In 2019, the median hourly wage rate among
                                                                                    •    The type of occupations and/or industries that
employees in New Brunswick was $20.18. This
                                                                                         individuals work in
represented the third lowest median among the
                                                                                    •    Education and experience levels
provinces and was well below the national median of
$24.00. While factors such as education and                                         •    Factors such as job tenure, part-time/full-time
demographics account for some of this gap, even when                                     status, and union coverage
these factors are controlled for, a noticeable gap                                  •    Discrimination (whether it’s based on sex,
persists.                                                                                sexual orientation, race, age, religion, parental
                                                                                         status, etc.)
Within the province, males earned noticeably more
than females. In 2019, the median hourly wage rate was
$21.00 among males compared to $19.50 among
females. An even larger gap existed at a national level,
where these rates were $25.79 and $22.00 respectively.
This gap is most prominent among lower education
levels.

Median Hourly Wage Rate Among Employees by Highest Level of Education - 2019
    $45.00

    $35.00                                                                                                                    N.B.
                                                                                                               $32.31
                                                                                                               $32.00
                                                                                                                              Other Provinces
    $25.00                                                                                     $25.00
                                                                                               $21.50                         Canada
                                                               $19.69          $17.50
                               $17.00                          $16.75
    $15.00                     $15.00          $15.51                          $15.05
                                               $13.50

     $5.00
             0        0 to 81Years      Some2 High           3
                                                        High School         4
                                                                          Some              5
                                                                                          Post-             6
                                                                                                        University       7
                                          School         Graduate         Post-         Secondary        Degree
                                                                        Secondary       Certificate

Median Hourly Wage Rate Among Employees by Highest Level of Education – N.B. and Canada – 2019
                                                                 New Brunswick                                       Canada
                                                         Male                 Female                       Male                Female
    0 to 8 Years                                        $17.00                 $13.50                     $16.60               $14.55
    Some High School                                    $15.20                 $12.25                     $18.00               $14.50
    High School Graduate                                $18.00                 $15.00                     $19.00               $16.50
    Some Post-Secondary                                 $17.50                 $14.24                     $20.00               $18.00
    Post-Secondary Certificate                          $23.53                 $20.00                     $25.00               $20.15
    University Degree                                   $33.06                 $31.28                     $33.11               $32.00

5   Source(s): Statistics Canada, Labour Force Survey, Tables 14-10-0301 and 14-10-0340 and Special Data Purchase.

                                                                 New Brunswick
                                                             Labour Force Trends            10
COVID-19 Pandemic                                                              In contrast to southern parts of the province,
                                                                               employment declined in the northern regions. Year-over-
Amidst the pandemic, the median hourly wage rate                               year, Northeast New Brunswick saw employment
among employees in New Brunswick increased from                                decrease by 4,300 (-6.7%), while the Northwest region
$20.12 to $21.00 per hour in 2020, a 4.4% increase. This                       saw employment decrease by 1,100 (-2.9%).
increase was in large part driven by job losses among
low wage earners. Furthermore, among employees
who managed to keep their jobs (or find new jobs),
many were working reduced hours, limiting their total
earnings.

One group that did see a substantial increase to their
earnings were individuals employed in management
occupations. Between 2019 and 2020, the median
hourly wage rate of managers increased by 13.8%. At
the same time, both employment (+7.6%) and average
hours worked (+1.1%) increased among this group.

Sub-Provincial6
Pre-Pandemic Trends

Labour market conditions in New Brunswick vary
significantly by geographic location. While the province’s
three major centres – Moncton, Saint John and                                  Looking over a slightly longer period, Greater Saint John,
Fredericton – all have relatively low unemployment rates                       Greater Fredericton, and Greater Moncton saw 3.6%,
and relatively high participation rates, more rural parts of                   9.7% and 7.1% employment growth between 2014 and
the province, especially in the Northeast, generally have                      2019 respectively. On the other hand, southern New
low rates of labour force participation and high rates of                      Brunswick outside of its three major centres saw
unemployment. This is in large part a reflection of the                        employment decline by 5.4% during this time, while the
fact that employment opportunities in New Brunswick                            province’s Northeast and Northwest regions saw declines
are largely concentrated in or around its three largest                        of 3.4% and 0.8% respectively.
cities (Moncton, Saint John and Fredericton), a trend that                     Greater Fredericton (6.4% to 5.7%) and Greater Moncton
has become more pronounced over time.                                          (6.0% to 5.7%), both saw their unemployment rates fall
Year-over-year, Greater Saint John (+3,000; +4.7%),                            year-over-year, while Greater Saint John (6.3% to 6.8%),
Greater Fredericton (+2,300; +4.2%), and Greater                               Northeast N.B. (12.6% to 13.0%) and Northwest N.B.
Moncton (+1,300; +1.6%) all experienced gains in                               (6.5% to 7.2%) all saw their rates increase.
employment, while other parts of southern New                                  In the longer term, all regions of the province have seen
Brunswick also saw employment levels increase (+1,700;                         their unemployment rates trend downwards over the
+2.9%).                                                                        past several years, with the Northeast and Northwest
                                                                               seeing the most dramatic decreases, and rural southern
                                                                               parts of the province seeing the least change.

6   Source(s): Statistics Canada, Labour Force Survey, Tables 14-10-0378, 14-10-0385, 14-10-0387 and 14-10-0393.

                                                                 New Brunswick
                                                    11           Labour Force Trends
Employment Growth – Selected Regions – 2014 to 2019                        Unemployment Rate – Selected Regions – 2019
      Greater Moncton                     +7.1%                                  Greater Moncton            5.7%
     Greater Saint John                       +3.6%                             Greater Saint John            6.8%
    Greater Fredericton                        +9.7%                          Greater Fredericton           5.7%
    Other Southern N.B.        -5.4%                                          Other Southern N.B.                    10.2%
         Northeast N.B.    -3.4%                                                   Northeast N.B.                            13.0%
        Northwest N.B.        -0.8%                                                Northwest N.B.             7.2%

                                                                           COVID-19 Pandemic

Labour Force Statistics – Selected Regions – 2014 to 2019
                                              2014             2015             2016                 2017             2018           2019
    Greater Moncton
     Employment                              75,100           76,600           76,000            75,300              79,100          80,400
     Participation rate                      66.9%            67.8%            66.7%             64.2%               66.1%           65.8%
     Employment rate                         62.3%            63.0%            61.7%             60.3%               62.3%           62.0%
     Unemployment rate                        6.9%             7.0%             7.4%              6.1%                6.0%            5.7%
    Greater Saint John
     Employment                              64,700           63,900           64,200            66,600              64,000          67,000
     Participation rate                      65.7%            65.5%            65.3%             65.9%               63.2%           65.9%
     Employment rate                         60.6%            59.9%            60.1%             62.0%               59.2%           61.4%
     Unemployment rate                        7.8%             8.3%             8.0%              5.9%                6.1%            6.8%
    Greater Fredericton
     Employment                              51,500           53,100           54,900            53,100              54,200          56,500
     Participation rate                      65.7%            66.7%            68.2%             63.6%               64.4%           65.3%
     Employment rate                         60.4%            61.9%            63.2%             60.1%               60.3%           61.6%
     Unemployment rate                        8.0%             7.2%             7.3%              5.5%                6.4%            5.7%
    Other Southern N.B.7
     Employment                              64,400           59,900           60,300            61,200              59,200          60,900
     Participation rate                      62.4%            59.3%            59.1%             59.0%               57.4%           58.7%
     Employment rate                         56.1%            52.3%            52.5%             53.3%               51.5%           52.8%
     Unemployment rate                       10.1%            12.1%            11.2%              9.5%                9.9%           10.2%
    Northeast N.B.                           64,400           59,900           60,300            61,200              59,200          60,900
     Employment                              62,200           62,600           60,300            62,800              64,400          60,100
     Participation rate                      56.4%            55.6%            53.9%             54.8%               55.7%           52.3%
     Employment rate                         46.7%            47.0%            45.2%             47.3%               48.7%           45.5%
     Unemployment rate                       17.3%            15.5%            16.0%             13.9%               12.6%           13.0%
    Northwest N.B.
     Employment                              36,600           37,000           37,800            37,200              37,400          36,300
     Participation rate                      61.9%            63.0%            62.4%             61.9%               61.8%           60.3%
     Employment rate                         56.0%            56.8%            58.1%             57.3%               57.8%           56.0%
     Unemployment rate                        9.6%             9.8%             6.9%              7.5%                6.5%            7.2%

7For the purposes of this document, “Other Southern N.B.” refers to New Brunswick’s Southeast, Southwest and Central Economic Regions
excluding the cities and surrounding areas of Moncton, Saint John and Fredericton.

                                                            New Brunswick
                                                        Labour Force Trends            12
Individuals across all parts of New Brunswick were                     As previously mentioned, while employment estimates
affected by the pandemic in 2020; however, some                        may point towards the economy being close to a full
regions were affected less than others. In terms of job                recovery, many workers were still working reduced
losses at the onset of the pandemic, estimates suggest                 hours and/or were employed in jobs that were only able
that the Greater Saint John area was possibly the                      to exist due to government support programs such as
hardest hit area in the province, while the Greater                    the Canada Emergency Wage Subsidy.
Moncton area and the Northwest were arguably the
least impacted.

Year-over-Year Change in Employment Between Mar-
May 2019 and Mar-May 2020 (3-Month Averages) –
Selected Regions

   Greater Moncton                          -3.6%
  Greater Saint John          -14.7%
 Greater Fredericton                   -11.2%
 Other Southern N.B.                            -7.7%
      Northeast N.B.                    -10.4%
     Northwest N.B.                         -3.4%

Since the initial disruption, most areas of the province
have seen a partial recovery. While employment in
some parts of the province, such as the Greater Saint
John area and the Northwest region, continued to lag
behind in early 2021, other areas of the province,
particularly the Greater Fredericton area and Northeast
region, were seeing employment totals that exceeded
pre-pandemic levels.

Year-over-Year Change in Employment Between Dec
2019 to Feb 2020 and Dec 2020 to Feb 2021 (3-Month
Averages) – Selected Regions

   Greater Moncton               -2.5%
  Greater Saint John           -4.4%
 Greater Fredericton                               +8.2%
 Other Southern N.B.          -4.8%
      Northeast N.B.                                    +4.7%
     Northwest N.B.             -9.7%

                                                            New Brunswick
                                                 13         Labour Force Trends
Education8                                                                     Post-secondary educational attainment levels in New
                                                                               Brunswick varied significantly by:
The educational attainment of New Brunswick’s
                                                                                    •    Geography: Only 49.7% of New Brunswickers
population is in part a reflection of the skills demanded
                                                                                         aged 25 to 64 years who were living in
by the province’s employers, or more broadly, its labour
                                                                                         communities outside of the province’s seven
market. In general, compared to the country as a whole,
                                                                                         main cities or their surrounding areas had some
there is somewhat less demand for workers with post-
                                                                                         form of post-secondary education, compared to
secondary credentials in New Brunswick. This is likely a
                                                                                         62.2% of those that were living in one of those
contributing factor for New Brunswick’s educational
                                                                                         seven centres or their surrounding areas.
attainment levels being among the lowest in the
                                                                                    •    Age: Only 47.5% of New Brunswickers aged 55
country.
                                                                                         to 64 years had completed some form of post-
Post-Secondary Education Completion Rate Among the                                       secondary education, compared to 65.1% of
Population Aged 25 to 64 Years – 2016                                                    individuals aged 25 to 44 years.
     Canada                                       65%
                                                                                    •    Sex: Only 54.4% of male New Brunswickers
        N.L.                                    62%                                      aged 25 to 64 years had completed some form
       P.E.I.                                    63%                                     of post-secondary education, compared to
        N.S.                                      64%                                    60.6% of females in this age range. This gap was
        N.B.                                  58%
                                                                                         even larger among younger age groups.
       Que.                                          68%
        Ont.                                       65%
       Man.                                   58%                              Post-Secondary Education Completion Rate Among
       Sask.                                  58%                              Individuals Aged 25 to 64 Years – Selected Regions –
       Alta.                                      64%                          2016
        B.C.                                      64%
                                                                                   Greater Moncton                        64%
                                                                                  Greater Saint John                     61%
At the time of the 2016 Census, 57.6% of New                                     Greater Fredericton                        68%
                                                                                Other Southern N.B.                  51%
Brunswickers between the ages of 25 and 64 had some
                                                                                    Greater Bathurst                   55%
form of post-secondary credential, compared to 64.8%                              Greater Miramichi                     57%
at a national level. Among labour force participants in                         Greater Campbellton                   54%
this age range, these percentages were somewhat                                 Greater Edmundston                     56%
                                                                                Other Northern N.B.                 48%
higher, at 62.1% within New Brunswick, and 68.7%
nationally.
                                                                               Compared to the general Canadian population, New
Post-Secondary Education Completion Rate by Age                                Brunswickers were somewhat more likely to have a
Group – New Brunswick – 2016                                                   post-secondary certificate or diploma (specifically at the
                                                                               college level), but much less likely to have a university
        15 to 19 years     3%
                                                                               degree.
        20 to 24 years                   43%
        25 to 44 years                                 65%
        45 to 54 years                           57%
        55 to 64 years                     48%
    65 years and over                   41%

8   Source(s): Statistics Canada, 2016 Census of Population, Catalogue no. 98-400-X2016197.

                                                                 New Brunswick
                                                             Labour Force Trends              14
Post-Secondary Education Completion Rate by Age Group – N.B. and Canada – 2016
                                                          New Brunswick                     Canada
                                                  Total       Male      Female   Total       Male    Female
 15 to 19 years                                    3%          3%         3%      4%          4%       4%
 20 to 24 years                                   43%         38%        49%     45%         40%      50%
 25 to 44 years                                   65%         59%        71%     70%         66%      74%
 45 to 54 years                                   57%         54%        59%     64%         63%      66%
 55 to 64 years                                   48%         49%        46%     56%         58%      54%
 65 years and over                                41%         46%        37%     45%         52%      40%

Highest Certificate, Diploma or Degree Among Individuals Aged 25 to 64 – N.B. and Canada – 2016
                                                          New Brunswick                     Canada
                                                  Total       Male      Female   Total       Male    Female
 No Certificate, Diploma or Degree                14%         17%        11%     11%         13%      10%
 High School or Equivalent                        29%         29%        28%     24%         24%      23%
 Post-Secondary                                   58%         54%        61%     65%         63%      67%
  Apprenticeship/Trades                            9%         14%         6%     11%         15%       7%
  College/Non-University Certificate or Diploma   26%         22%        30%     22%         19%      25%
  University, Below Bachelor Level                 2%          1%         2%      3%          3%       4%
  University, Bachelor Level                      14%         12%        17%     19%         17%      21%
  University, Above Bachelor Level                 6%          5%         6%     10%          9%      10%

                                                     New Brunswick
                                            15       Labour Force Trends
You can also read