Rightmove House Price Index - The largest monthly sample of residential property prices
←
→
Page content transcription
If your browser does not render page correctly, please read the page content below
Rightmove
House Price Index
The largest monthly sample of
residential property prices

   March 2019
  National edition

   Copyright © 2019, Rightmove plc. Released 18th March. For media enquiries and interviews please contact the
   Rightmove press office: T | 020 7087 0605 M | 07894 255295 or E | amy.murphy@rightmove.co.uk

Under embargo for 00.01 hours, Monday 18 th March 2019

              Usual spring buoyancy weighed down by Brexit uncertainty
• The average price of property coming to market rises by just 0.4% (+£1,287) this month, as the
  traditionally busier spring market gets off to a subdued start:
     • Lowest average monthly rise at this time of year since 2011, though London is the main drag
     • Prices remain more buoyant outside London with nine out of 11 regions seeing new-to-the-
        market sellers pricing higher
• More buyers hesitating as Brexit goes to the wire:
    • Number of sales agreed by estate agents in February was 7% below same period in 2018,
      compared with the 4% annual fall recorded in January
• Search activity on Rightmove remains steady, indicating home movers are keeping a watching
  brief which could lead to an eventual bounce if and when uncertainty abates

                                        National average asking prices
            Month          Avg. asking price    Monthly change      Annual change           Index
          Mar 2019             £302,002              0.4%                -0.8%              233.5
          Feb 2019             £300,715              0.7%                0.2%                232.5
                   National average asking prices by market sector (excluding Inner London)
            Sector             Mar 2019            Feb 2019         Monthly change      Annual change
      First-time buyers        £189,606            £189,347               0.1%              -0.1%
      Second-steppers          £273,493            £271,880               0.6%               0.5%
      Top of the ladder        £531,987            £521,601               2.0%              -1.0%

         Monthly asking price trend

         £320,000

         £315,000

         £310,000

         £305,000

         £300,000

         £295,000

         £290,000

         £285,000
                       Mar-18 Apr-18 May-18 Jun-18 Jul-18 Aug-18 Sep-18 Oct-18 Nov-18 Dec-18 Jan-19 Feb-19 Mar-19

           Rightmove measured 110,716 asking prices nationally this month, circa 90% of the UK market. The properties were
           put on sale by estate agents from 10th February 2019 to 9th March 2019 and advertised on Rightmove.co.uk.

     2
                    Copyright © 2019, Rightmove plc. Released 18th March. For media enquiries and interviews please contact the
                    Rightmove press office: T | 020 7087 0605 M | 07894 255295 or E | amy.murphy@rightmove.co.uk
Overview
The start of the busy spring market is on hold in some parts of the country, with the
average price of property coming to market rising by just 0.4% (+£1,287) this month. This is
the lowest average monthly rise at this time of year since 2011, and considerably lower
than the 0.9% average over the last seven years. With the number of sales agreed by estate
agents also falling below this time last year, Brexit uncertainty has at best delayed the usual
spring bounce.
Miles Shipside, Rightmove director and housing market analyst comments: “While March
marks the start of spring, temperatures have yet to rise in the housing market. Buying
activity remains cooler than usual, with hesitation as some buyers await a more settled
political climate. There’s greater resilience the further away you get from the London
market, and there’s a sound bedrock of demand for the right property at the right price,
reinforced by ongoing housing needs combined with cheap mortgage borrowing.”
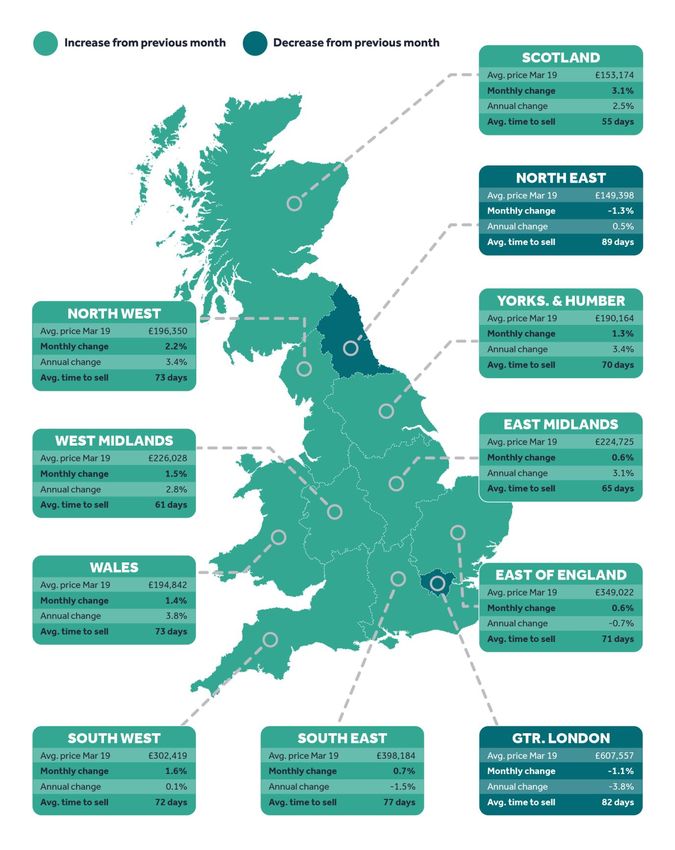
London continues to be the main drag as nine out of 11 regions still see new-to-the-
market sellers pricing higher than a month ago. Prices in London are down by 1.1% on the
previous month, and the other region to record a monthly fall is the North East, down by
1.3%. Their respective pricing histories are very different however, with London prices still
68% higher than ten years ago and buyers looking for prices to settle at a new level of fair
value. In contrast, the North East has seen new seller asking prices up by just 8% in the
same time-span.
Shipside notes: “London and some of its commuter belt are suffering from a post-boom
hangover, with prices now having to be far more sober to attract buyer interest. In
contrast, North East prices never had the opportunity to become intoxicated by the capital
city’s heady mix of high demand, low interest rates and higher salaries.”
As the clock ticks down towards the Brexit deadline it is natural human behaviour for more
buyers to hesitate. The number of sales agreed by estate agents in February was 7% below
the same period in 2018, compared with a year-on-year fall of 4% recorded in January.
However, search activity on Rightmove remains steady, with the number of visits to the
website staying level in the year-to-date. This indicates that home-movers are keeping a
watching brief which could lead to an eventual bounce if and when the uncertainty abates.
Shipside adds: “The closer you get to the wire without the clarity of an agreed way forward,
the greater the propensity for buyers to wait and see rather than acting now. This could be
a temporary pause, and indeed market slowdowns at election time and around the original
referendum result bounced back pretty quickly. Markets and people do not like uncertainty,
though while sales agreed numbers are down by 7%, that means they are still running at
93% of last year’s levels. Most potential buyers are getting on with their lives or seeing a
price lull as an opportunity to get onto the housing ladder or move to the next rung, with
average national asking prices being 0.8% cheaper than a year ago.”
Miles Shipside, Rightmove director and housing market analyst says: While March marks the
start of spring, temperatures have yet to rise in the housing market. Buying activity remains
cooler than usual, with hesitation as some buyers await a more settled political climate.
There’s greater resilience the further away you get from the London market, and there’s a
sound bedrock of demand for the right property at the right price, reinforced by ongoing
housing needs combined with cheap mortgage borrowing.”
3
Copyright © 2019, Rightmove plc. Released 18th March. For media enquiries and interviews please contact the
Rightmove press office: T | 020 7087 0605 M | 07894 255295 or E | amy.murphy@rightmove.co.ukAgents’ views
Tom De Ville, Director at Fine and Country Nottinghamshire, says: “The wheels are still
turning in the housing market but they’re turning more slowly than this time last year as
there’s hesitation from both buyers and sellers. A more certain political outcome would
help to reassure those currently hesitating and would help to get the wheels turning
more quickly again, and it would also help boost much-needed supply. Houses that are
priced sensibly are still selling but there are some sellers who haven’t realised that
there’s been a shift in power from a sellers’ market to a buyers’ market.”
Guy Gittins, Managing Director of Chestertons, says: “It was almost inevitable that the
uncertainty of Brexit would drag property prices down in the short term, especially as the
date gets closer and many buyers take a ‘wait-and-see approach’. However, we have
experienced an incredibly busy start to the year, with a sharp increase in buyer
registrations, viewings and offers throughout January and February, which reflects pent-
up demand and suggests that prices are now at a level that buyers are comfortable
buying. I therefore see this month’s drop as a temporary blip, and expect prices to
recover once the market has more clarity on Brexit. Over the medium-and long-term,
London property has outperformed most other asset classes and we believe it will
remain a solid investment, regardless of the Brexit outcome.”
4
Copyright © 2019, Rightmove plc. Released 18th March. For media enquiries and interviews please contact the
Rightmove press office: T | 020 7087 0605 M | 07894 255295 or E | amy.murphy@rightmove.co.ukAsking price trends
Five year asking price trend
£320,000
£310,000
£300,000
£290,000
£280,000
£270,000
£260,000
£250,000
£240,000
£230,000
£220,000
Mar-14 Sep-14 Mar-15 Sep-15 Mar-16 Sep-16 Mar-17 Sep-17 Mar-18 Sep-18 Mar-19
% monthly change in average asking prices
2.0%
1.5%
1.5%
1.0%
1.0% 0.8% 0.7% 0.7%
0.4% 0.4% 0.4% 0.4%
0.5%
0.0%
-0.5%
-0.1%
-1.0%
-1.5%
-1.5%
-2.0% -1.7%
-2.5% -2.3%
Mar-18 Apr-18 May-18 Jun-18 Jul-18 Aug-18 Sep-18 Oct-18 Nov-18 Dec-18 Jan-19 Feb-19 Mar-19
5
Copyright © 2019, Rightmove plc. Released 18th March. For media enquiries and interviews please contact the
Rightmove press office: T | 020 7087 0605 M | 07894 255295 or E | amy.murphy@rightmove.co.ukAverage time to sell and stock
Average 'time to sell' (no. of days) - National
85
80 77
75
71
70
70
65 65
65
61 61 61
60
59
60 57
56 56
55
50
45
40
Feb-18 Mar-18 Apr-18 May-18 Jun-18 Jul-18 Aug-18 Sep-18 Oct-18 Nov-18 Dec-18 Jan-19 Feb-19
Average stock per agent (including Under Offer/Sold STC)
60
52 53 52 52 52
50 50
50 45
47 46 45 46
43
40
30
20
10
0
Feb-18 Mar-18 Apr-18 May-18 Jun-18 Jul-18 Aug-18 Sep-18 Oct-18 Nov-18 Dec-18 Jan-19 Feb-19
6
Copyright © 2019, Rightmove plc. Released 18th March. For media enquiries and interviews please contact the
Rightmove press office: T | 020 7087 0605 M | 07894 255295 or E | amy.murphy@rightmove.co.ukRegional trends
7
Copyright © 2019, Rightmove plc. Released 18th March. For media enquiries and interviews please contact the
Rightmove press office: T | 020 7087 0605 M | 07894 255295 or E | amy.murphy@rightmove.co.ukLondon trends
Average 'time to sell' (no. of days) - London
100
95
89
90
85 82 82
80 76
75
75 72 72 72 71
70
70 67 67 67
65
60
55
50
Feb-18 Mar-18 Apr-18 May-18 Jun-18 Jul-18 Aug-18 Sep-18 Oct-18 Nov-18 Dec-18 Jan-19 Feb-19
8
Copyright © 2019, Rightmove plc. Released 18th March. For media enquiries and interviews please contact the
Rightmove press office: T | 020 7087 0605 M | 07894 255295 or E | amy.murphy@rightmove.co.ukLondon trends
Borough data is based on a three month rolling average and can be used as an indicator of overall
price trends in each borough over time. It is not directly comparable with the overall London
monthly figures.
Avg. price
Borough Monthly change Annual change
Mar 2019
Havering £413,633 -0.2% 1.4%
Camden £984,981 -2.9% 0.1%
Richmond upon Thames £817,639 1.4% -0.2%
Bromley £525,009 0.1% -0.2%
Redbridge £451,062 0.1% -0.3%
Waltham Forest £475,241 0.0% -0.5%
Islington £746,340 0.0% -0.8%
Merton £625,222 5.2% -0.9%
Wandsworth £797,947 -0.5% -1.0%
Enfield £449,134 -0.1% -1.1%
Ealing £549,317 2.8% -1.2%
Haringey £602,027 1.1% -1.3%
Bexley £402,370 -0.1% -1.4%
Hounslow £541,993 4.7% -1.5%
Westminster £1,415,864 -4.4% -1.6%
Barking and Dagenham £310,249 1.0% -1.8%
Harrow £542,890 0.4% -2.0%
Kingston upon Thames £609,111 1.9% -2.1%
Barnet £628,527 2.6% -2.2%
Hammersmith and Fulham £916,565 2.7% -2.6%
Greenwich £436,208 1.2% -2.7%
Southwark £629,457 1.3% -2.9%
Brent £563,558 0.6% -3.2%
Newham £403,224 -1.0% -3.5%
Hillingdon £479,541 -0.1% -3.6%
Lewisham £457,310 0.1% -3.8%
Sutton £450,856 2.5% -3.8%
Croydon £426,030 0.7% -4.0%
Hackney £629,757 2.3% -4.2%
Tower Hamlets £554,157 -1.9% -6.1%
Lambeth £604,351 0.5% -6.8%
Kensington and Chelsea £1,509,017 -0.8% -8.3%
9
Copyright © 2019, Rightmove plc. Released 18th March. For media enquiries and interviews please contact the
Rightmove press office: T | 020 7087 0605 M | 07894 255295 or E | amy.murphy@rightmove.co.ukEditor’s notes
About the Index:
The Rightmove House Price Index methodology was updated in January 2018. The report now includes data for
Scotland and a number of measures have been refined. The stock per agent figure now calculates the average based
on the number of properties an agent has on Rightmove each day across the month, rather than the average of the
total number of properties each agent advertised in the month. London asking prices are now broken down into travel
zones. For the purpose of historical comparisons, the historical figures have been restated based on the new
methodology.
The Index includes asking price breakdowns in the housing market to offer trends at three different sectors of the
market: first-time buyer, second-stepper and top of the ladder. Inner London prices have been excluded from this
categorisation as the normal housing ladder is not really applicable.
Advertising property for over 90% of all UK estate agents, Rightmove is in a unique position to identify any immediate
changes in the market. Rightmove’s House Price Index is compiled from the asking prices of properties coming onto
the market via over 13,000 estate agency branches listing on Rightmove.co.uk. Rather than being a survey of opinions
as with some other indices, it is produced from factual data of actual asking prices of properties currently on the
market. The sample includes up to 200,000 homes each month – representing circa 90% of the market, the largest and
most up-to-date monthly sample of any house price indicator in the UK. The Index differs from other house price
indicators in that it reflects asking prices when properties first come onto the market, rather than those recorded by
lenders during the mortgage application process or final sales prices reported to the Land Registry. In essence,
Rightmove’s Index measures prices at the very beginning of the home buying and selling process while other indices
measure prices at points later in the process. Having a large sample size and being very up-to-date, the Rightmove
Index has established itself as a reliable indicator of current and future trends in the housing market.
Rightmove measured 110,716 asking prices nationally this month, circa 90% of the UK market. The properties were
put on sale by estate agents from 10th February 2019 to 9th March 2019 and advertised on Rightmove.co.uk.
Market sectors explained:
First-time buyer: This figure represents the typical property a first-time buyer would purchase, covering all two bed
properties and smaller that come to market (houses and flats).
Second-stepper: This figure represents the typical property of a person moving from their first home, covering all
three and four bed properties that come to market (houses and flats) excluding four bed detached houses.
Top of the ladder: This figure represents asking prices at the top end of the market, covering all five bed properties
and above (houses and flats), as well as four bed detached houses.
About Rightmove.co.uk:
Rightmove.co.uk is the UK’s leading property website, displaying details of homes for sale or rent to the largest online
audience. It is consistently ranked the number one property website in the UK (source: Experian Hitwise). It has circa
90% of all properties for sale and at any time displays a stock of over one million properties to buy or rent. The
Rightmove.co.uk site attracts over 130 million visits from home movers each month with time on site averaging over
one billion minutes per month (Rightmove data, July 2017).
10
Copyright © 2019, Rightmove plc. Released 18th March. For media enquiries and interviews please contact the
Rightmove press office: T | 020 7087 0605 M | 07894 255295 or E | amy.murphy@rightmove.co.ukYou can also read