Q3 2018 Result presentation - Oslo, 6 November 2018 - Cision

Page created by Roger Ferguson
 
CONTINUE READING
Q3 2018 Result presentation - Oslo, 6 November 2018 - Cision
Q3 2018 Result presentation
Oslo, 6 November 2018
Q3 2018 Result presentation - Oslo, 6 November 2018 - Cision
Disclaimer
Forward Looking Statements

This presentation contains forward-looking statements that involve risks and uncertainties. All statements other than statements of
historical facts are forward-looking. You should not place undue reliance on these forward-looking statements for many reasons.
These forward-looking statements reflect current views with respect to future events and are by their nature subject to significant risk and
uncertainties because they relate to events and depend on circumstances that will occur in future. There are a number of factors that could
cause actual results and developments to differ materially from those expressed or implied by these forward-looking statements.
Although we believe that the expectations reflected in the forward-looking statements are reasonable, we cannot assure you that our future
results, level of activity or performance will meet these expectations. Moreover, neither we nor any other person assumes responsibility for
the accuracy and completeness of the forward-looking statements. Unless we are required by law to update these statements, we will not
necessarily update any of these statements after the date of this presentation, either to conform them to actual results or to changes in our
expectations.

22
Q3 2018 Result presentation - Oslo, 6 November 2018 - Cision
Highlights

                      Creating the largest Nordic rail infrastructure player
     Acquisition of
     VR Track OY      An even stronger platform to capture future growth initiatives including maintenance-, design- and environmental services

                      Creating value for NRC Group investors - strong cash flow generation and significant growth prospects

                      Revenues of NOK 851 million

     Key figures      EBITDA of NOK 72 million excluding M&A cost
        Q3                    –   EBITDA in SBB of NOK –18 million due to changes in cost estimates in projects

                      Strong order backlog

                      Sustainability requirements create new business opportunities within environmental services

                               – Acquisitions of Gunnar Knutsen AS and NSS Holding AS
        Key
                      Subsequent awarded NOK 360 million Storgata tramway contract in Oslo
       events
                      EGM approved to increase the share capital in connection with the acquisition of VR Track Oy

                      Rolf Jansson and Eva Nygren elected as new Board members with effect from early January 2019

33
Q3 2018 Result presentation - Oslo, 6 November 2018 - Cision
Financials   BILDE KOMMER

44
Q3 2018 Result presentation - Oslo, 6 November 2018 - Cision
Q3 2018 key figures – profit and loss
•    Revenue in Q3 2018 of NOK 851 million (+10%)                    (Amounts in NOK million)    Q3 2018   Q3 2017   YTD 2018   YTD 2017   FY 2017
                                                                     Revenue                        851       776       2 206      1 699     2 373
      –   Continued strong growth in Norway: + 65%
                                                                     M&A expenses                    14         2          14          4        6
      –   Decrease in Sweden due to none track renewal projects in
          2018
          (Q3 17 revenue of NOK ~200 million)                        EBITDA (ex M&A)                 72       113         139        164      236
                                                                     EBITA (ex M&A)                  54       100          93        133      190
                                                                     EBIT (ex M&A)                   44        91          74        107      156
•    EBITDA ex M&A Q3 2018 of NOK 72 million
     –    Weak performance in SBB, Sweden, with EBITDA of NOK -
          18 mill.                                                   EBITDA % (ex M&A)             8,4 %    14,5 %      6,3 %      9,6 %     9,9 %

             •   Management replaced. Projects estimates adjusted    EBITDA % (ex M&A cost and
                                                                     SBB)                         10,6 %
     –    No track renewal project in 2018
     –    Weakening SEK vs NOK of 6%
     –    Strong performance in Norway: 10.7% EBITDA margin

•    EBIT ex M&A in Q3 2018 of NOK 44 million
     –    Includes NOK 6 million of SBB remaining amortisations

55
Q3 2018 Result presentation - Oslo, 6 November 2018 - Cision
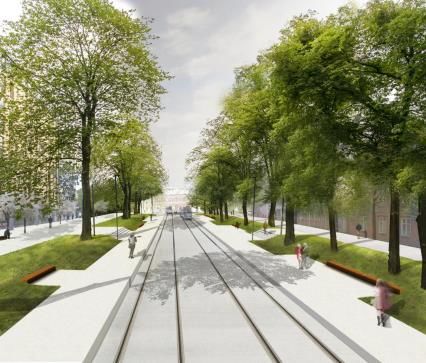
Proforma Q3 2018 key figures – profit and loss
Profit and loss including acquired companies VR Track OY, Gunnar Knutsen AS (GK) and NSS Holding AS (NSS)

(Amounts in NOK million) NRC Group*                         GK+NSS             VR Track         Combined
Revenue                                          851                134               804            1 789

EBITDA                                            72                  31                92              195
EBITA                                             54                  23                73              150

EBITDA ex M&A (%)                                8,4 %             23,8 %           11,4 %            10,9 %

Proforma figures based on management accounts from the acquired companies with estimated IFRS adjustments
EUR: 9,57
* NRC Group figures exluding M&A cost

66
Q3 2018 Result presentation - Oslo, 6 November 2018 - Cision
Order book development*
Order book Q3 2016 – Q3 2018                                                           Order book development Q2 2018 – Q3 2018
In NOK million                                                                         In NOK million
                                                                            7031
 7000

                                                                                    4 000
 6000
                                                                                    3 500
                                                                            3678
 5000
                                                                                    3 000                                   14
                                                                            **VR
                                                                                                                  175
 4000                                                                               2 500
                                                            3500                                                  558
                                                                    3178                                851
                                                                                                                                    2 802
                                                                                    2 000
 3000                                                                                        2 610                295
                                                                                                                                                                  3 678
                                    2451    2417    2408
                                                                                    1 500
 2000
            1397            1548                                            3353
                    1402                                                            1 000

 1000
                                                                                     500                                                                551
                                                                                                                                               568
       0                                                                                0
            Q3 16   Q4 16   Q1 17   Q2 17   Q3 17   Q4 17   Q1 18   Q2 18   Q3 18            Q2 18 Revenue      New       FX        Q3 18    JV Q2     JV Q3     VR Q3
                                                                                                              Contracts effects
                                                                                        Order book       Revenues       Announced      Contracts not   Acquisitions   Order book
                                                                                        VR Order book    FX effects     contracts      announced                      from JVs
     *Including order book from JVs
     ** VR Track proforma included in Q3 2018                                       Approximately 30% of the order book is estimated for production in 2018
77
Q3 2018 Result presentation - Oslo, 6 November 2018 - Cision
Q3 2018 key figures – balance sheet

•    Acquisition of Gunnar Knutsen AS included           (Amounts in NOK million)
                                                         ASSETS                                     30.09.2018   30.09.2017   31.12.2017
                                                         Intangible assets                               1 262          955        1 048
•    Cash is NOK 189 million                             Other non-current assets                          437          266          287

                                                         Other current assets                            1 059          621          741
•    Net debt is NOK 446 million
                                                         Cash and cash equivalents                         189          308          408
        – Increased bank debt related to acquisitions:   Total assets                                    2 948        2 150        2 484
          NOK 145 million
        – Leasing from NSS Holding AS and Gunnar         EQUITY AND LIABILITIES
          Knutsen AS: NOK 88 million                     Total equity                                    1 443        1 232        1 357
        – Cut off – payment from customers ~
          NOK 60 million                                 Non-current interest-bearing liabilities         467          319          317
                                                         Other non-current liabilities                     41           20           27

•    Intangible assets of NOK 1,262 million              Interest-bearing current liabilities              168          114          121
                                                         Other current liabilities                         829          465          662
                                                         Total equity and liabilities                    2 948        2 150        2 484
•    Equity ratio is 49%

88
Q3 2018 Result presentation - Oslo, 6 November 2018 - Cision
Q3 2018 key figures – cash flow
                                                                                                                          Q3     Q3   YTD    YTD      FY
•    Cash flow from operating activities of NOK 3 million          (Amounts in NOK million)                             2018   2017   2018   2017   2017

      –   Cut-off between quarters ~ NOK 60 million                Profit/loss before tax                                 26     88    54      98    144

•    Net cash flow from investing activities is NOK -138 million   Net cash flow from operating activities                 3     33    -44    -28    133

      –   Acquisitions: NOK -139 million
                                                                   Net cash flow from investing activities              -138   -138   -140   -214   -243
      –   Capex: NOK -1 million

                                                                   Net cash flow from financing activities               102    151    -21   128      92
•    Net cash flow from financing activities is NOK 102 million
                                                                   Net change in cash and cash equivalents               -33     46   -206   -114    -18
      –   Increased bank debt for acquisitions: NOK 145 million
                                                                   Cash and cash equivalents at the end of the period    189    308   189    308     408
      –   Payment of borrowings and leasing: NOK -43 million

99
Q3 2018 Result presentation - Oslo, 6 November 2018 - Cision
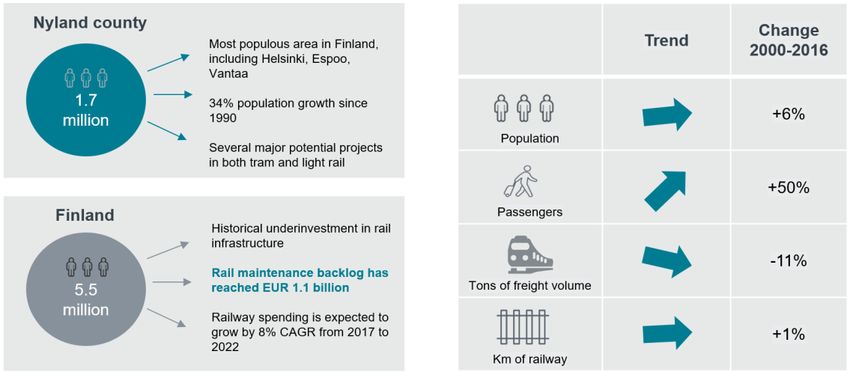
NRC Group acquires VR Track and creates the largest Nordic
rail infrastructure player
In NOK million                  Last twelve months (LTM) revenues
7000
                                                                                  6 225
6000

5000

4000

3000
                                                            2 251
2000

                                       977
1000
                 462

     0
            LTM Q315*              LTM Q316*             LTM Q317*            LTM Q318**

* Reported figures
** Proforma figures, including NSS Holding, Gunnar Knutsen and VR Track figures LTM Q3 2018

10
10
The acquisition of VR Track represents a solid foundation for
value creation
         Enterprise value (EURm)(1)                                                     2018 financial targets                                                            Outlook
                             225

                                                                                  Revenue                                                            •    Strong growth outlook across all three
                                                                                                                     EUR 300m
                                                                                                                                                          key markets:
                                                                                                                                                                 – Norway: Government recently
                                                                                   EBITDA                             EUR 28m                                      announced 12.4% increase in
                                                                                                                                                                   railway spending for 2019
      Debt                   146
                                                                                                                                                                 – Sweden: New NTP outlines
                                                                               Maintenance
                                                                                                                       EUR 4m                                      significant increases in
                                                                                  capex
                                                                                                                                                                   maintenance and investments
                                                                                                                                                                 – Finland: Expected to grow by
                                                                              Interest cost(2)                         EUR 3m                                      8% CAGR from 2017 to 2022

                                                                                Tax @ 20%                              EUR 3m
     Equity                   79
                                                                                Calculatory
                                                                                earnings(3)                           EUR 17m

11
11       (1)   Based on transaction enterprise value. Final purchase price is subject to certain net working capital and net debt adjustments at the time of closing
         (2)   Weighted annual interest cost on acquisition bank debt financing
         (3)   Calculated as: EBITDA – maintenance capex – interest cost – tax. May not add up due to rounding
The enlarged NRC Group represents a significantly enhanced
platform to capture further growth opportunities
•    Unique pan-Nordic capabilities
                                                                                    The leading infrastructure
                                                                                     company in the Nordics
•    Ability to offer larger turnkey projects to a wider customer group                 with potential for
                                                                                      European expansion
•    Very well positioned to capture maintenance contracts in the
     Norwegian market

•    Cross-selling potential for groundwork in Finland, engineering &                  Wide service offering
     design projects in Norway and environmental services in Sweden                    Broad geographical
     and Finland                                                                       presence
                                                                                       Leading market positions
•    Improved utilization of machine park and resources create synergies
     in Sweden

                                                                          Present            Future vision

12
12
NRC Group is now uniquely positioned to serve the Nordic market
Overview of NRC Group and VR Track offices   Key market figures
                                                                                Sweden                           Norway                         Finland
                                               Installed railway

                                                                                 ~12 000 km                       ~ 4 200 km                    ~ 6 000 km

                                               Annual railway passenger journeys

                                                                                 219 million                       74 million                   86 million

                                               Annual railway freight volume (tons)

                                                                                  68 million                       33 million                   36 million

                                              Maintenance backlog* (NOK)

                                                                                   18 billion                       19 billion                   11 billion

                                             Source: Norway: NTP 2018-29 and 2019 national budget. Sweden: NTP 2018-29, Trafikverket and 2018
                                             national budget. Finland: Finnish Transportation Agency, VR Track estimates.
13
13
NORWAY             SWEDEN         FINLAND

Norway 2019 budget confirms long-term growth trend
•    2019 railway spending budgeted at NOK 21.2 billion, up 11% from    Long-term railway spending development
     2018
                                                                        NOK billion per year
                                                                        30,0
                                                                                                  Investments and investment planning
•    Spending on operations, maintenance and investments continues to                             Operations, maintenance and renewal (partly non-adressable)
     lag levels required to meet the new NTP
                                                                        25,0

•    Norwegian Government supportive of increased investments in
                                                                        20,0
     environmentally friendly transport systems

                                                                                                                                                                               14,9
                                                                        15,0                                                                                            12,1
    Investments in infrastructure renewal                                                                                                    10,7
                                                                                                                                                                 11,0
    NOK billion                                                                                                                     9,8                10,9
                                                                                                                          9,1
                                                                        10,0
                                                                                                                6,5
                                                                                            4,4        5,1
                                                                                   3…
                                      3,4
                                                                         5,0                                                                                                   9,3
                                                                                                                                              9,0                8,2    8,9
                                                                                                                          6,7       7,4                    7,1
                                                                                  5,4       5,7        5,6      5,5
            2,1
                                                                         0,0

    Minimum use in 2019   Required to halt increase in
                            maintenance backlog
                                                                         *)Sources: The Norwegian national budget, national accounts and most recent NTP

14
14
NORWAY       SWEDEN     FINLAND

Further growth needed to close investment gap to NTP levels
External service purchases                                                  Relative to NTP average for 2018-23 period
NOK billion
     30                                                                                157%                            158%

     25

     20
                                                                                                               95%
                                                              13,8
                              +12%       10,0                                  88%
     15             8,9                                                                                                         72%
                                                                                                64%
     10             2,1       +0.7%       2,2                 1,4

     5                                    8,9                 9,3
                    8,2
                              +7.9%

     0
               2018 revised           2019 budget     NTP average 2018-            2018 revised                      2019 budget
                                                            2023

          Operations and maintenance    Investment planning   Investments   Operations and maintenance   Investment planning    Investments

15
15
NORWAY       SWEDEN        FINLAND

Full-service positioning confirmed by 2nd large Oslo tram award
Major contract for Storgata rehabilitation
                                                                                                                                                             Source: Sporveien

•    NOK 360 million contract awarded
         – Street improvement works and tram infrastructure upgrades including track,
           electro and groundwork
         – Modernising parts of the water and wastewater network
         – Part of Sporveien’s high-profile NOK 4.1 billion Tram Program (2018-2021)

•    Second major turnkey tram project awarded in 2018
         – Both won by NRC Group, combined value NOK 762 million
         – Confirming shift towards bigger contracts involving several specialist
           disciplines
         – In line with NRC Group’s strategic positioning

•    Environmental impact a key selection criteria

                                                                                        “NRC Group has demonstrated understanding and insight with
                                                                                        regards to environmental impact during project execution, and
                                                                                        also by selecting climate-friendly solutions.”
                                                                                        From letter of award

16
16
NORWAY               SWEDEN                  FINLAND

Long-term growth expected for railway activity in Sweden

                                                                         Long-term railway spending development**
                                                                         SEK billion per year
•    2019 budget still pending formation of a new government after the    25,0
     general elections 9 September                                                                    Railroad operations and maintenance                   Investments

                                                                          20,0
•    The new NTP announced on 4 June confirms continued growth in
     demand for infrastructure services                                                                                                                                                         12,3
                                                                          15,0
         – Average maintenance spend of SEK 10.4 billion for the                                                                                                      10,1
                                                                                                                                                                                  10,3
           2018-2029 period, up 47% from old NTP                                                                                                           9,8
                                                                                   10,8        11,5        10,7        8,6
                                                                                                                                   7,5         8,3
         – Average investments in new named* railway projects of SEK      10,0
           12.3 billion, up 32% from old NTP

                                                                           5,0                                                                                                                  10,4
                                                                                                                                                                       9,0         8,2
                                                                                                                       7,5         7,4         7,3         7,6
                                                                                    6,2         5,8        6,6

                                                                           0,0
                                                                                  2010        2011         2012       2013        2014        2015        2016        2017       2018E 2018-23E

                                                                           Sources: *) 2018-29 NTP. Named projects exceed SEK 100 million of investments,
                                                                                       2010-2018: Swedish national budget: Tables for Investment plan for Trafikvärket and Maintenance of the
                                                                                      State transport infrastructure

17
17
NORWAY             SWEDEN         FINLAND

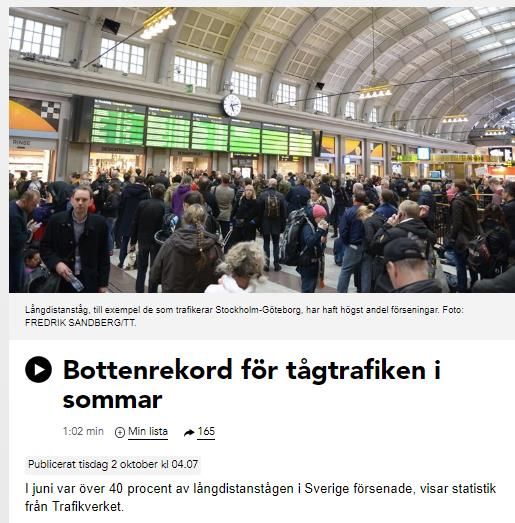
Step-up in investments expected from 2019

•    High tendering activity in the fourth quarter 2018
         – Five track renewal projects for tender in 2019
         – Projects with revenue and margin potential

•    Three long-term maintenance contracts up for tendering in 2019
                                                                      Source: Dagens Nyheter, 30 September 2018

•    Maintenance backlog, delays and environment are high on agenda

•    Increased focus on interdisciplinary projects

•    Stable competitive landscape
                                                                                                                                                   Source: SVT, 24 August 2018

                                                                                                                  Source: Sveriges Radio, 2 October 2018

18
18
NORWAY       SWEDEN             FINLAND

Attractive growth expected in Finland

                                              Finland railway spending* (EURbn)
                                                    Project investments and maintenance

                                                                                                      0,9 0,9
                                                                                               0,8
                                                           0,7 0,7
                                                                                  0,6 0,7
                                              0,5
                                                     0,6              0,5 0,5 0,6

                                        (1)   Source: Finnish Transportation Agency, VR Track estimates

19
19
NORWAY   SWEDEN   FINLAND

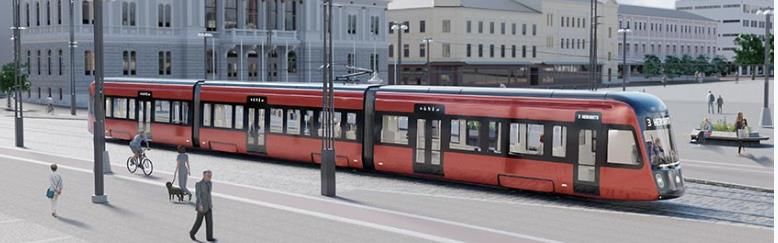
Tramway and metro market in Finland

•    NOK 2.7 billion tramway development programme for the city of
     Tampere

•    VR Track is part of the Tramway Alliance in charge of designing and
     constructing the infrastructure and depot area
         – VR Track responsible for 50% of planning and 50% of
           construction
         – YIT Construction Services and Pöyry Finland Oy are the other
           alliance partners

•    Section 1 (NOK 2.3 billion) is scheduled for completion in 2021
         – Turnkey project including tramway and tramway stop
           construction, groundworks, depot construction, power supply,
           bridges and all technical systems
         – Total length of 15 km with 23 main stops

20
20
Summary & outlook

•    Focus on VR Track integration process and capture synergies

•    Strong market outlook with good project pipeline visibility

•    Strong order backlog

•    Positioned for privatization of maintenance contracts in Norway

21
21
Appendix

22
22
20 largest shareholders
Per 5 November 2018
INVESTOR                                       NO OF SHARES     % OF TOTAL    COUNTRY
DATUM                                               5 100 000         11,58       NOR
MIDDELBORG INVEST                                   4 401 454         10,00       NOR
ARCTIC FUNDS                                        2 329 034          5,29         IRL
CARNEGIE INVESTMENT                                 2 242 491          5,09       SWE
NORDEA                                              1 951 397          4,43         FIN
CHARLOTTE HOLDING                                   1 328 008          3,02       NOR
NORDNET                                             1 307 970          2,97       SWE
GUNNAR KNUTSEN HOLDING                              1 252 677          2,85       NOR
LGA HOLDING                                         1 168 102          2,65       NOR
NORRON SICAV                                        1 034 208          2,35        LUX
SOGN INVEST                                         1 018 807          2,31       NOR
HANDELSBANKEN NORDISKA                                991 051          2,25       SWE
VERDIPAPIRFONDET ALFRED BERG                          975 810          2,22       NOR
HAUGO RIVING                                          850 745          1,93       NOR
DNB NOR MARKETS                                       748 859          1,70       NOR
CATELLA SMÅBOLAGSFOND SKANDINAVISKA ENSKILDA          719 805          1,63       SWE
DANSKE BANK                                           681 616          1,55       SWE
SKANDINAVISKA ENSKILDA SEB                            680 142          1,54       SWE
E.K HOLDING                                           668 102          1,52       NOR
AVANZA BANK                                           567 595          1,29       SWE
TOTAL NUMBER OWNED BY TOP 20                       30 017 873         68,18
TOTAL NUMBER OF SHARES                             44 026 270

23
23
Segments – key figures quarterly development

                                             Restated Restated Restated Restated Restated Reported Reported Reported Reported Reported Reported Reported
                                             Full year
Norway operations (NOK million)                  2015    Q1 2016   Q2 2016   Q3 2016   Q4 2016   Q1 2017   Q2 2017   Q3 2017   Q4 2017   Q1 2018   Q2 2018   Q3 2018
Total revenue                                      349       113       162       161       168       108       189       255       219       212       335       421
EBITDA                                              27        -5         6        14        -2        -6        10        19        18        -1        25        45
EBITA                                               21        -8         3        11        -4       -10         5        13        10        -7        19        36
EBIT                                                19        -9         2         9        -5       -12         2         8         4       -13        16        32

                                             Full year
Sweden operations (NOK million)                  2015    Q1 2016   Q2 2016   Q3 2016   Q4 2016   Q1 2017   Q2 2017   Q3 2017   Q4 2017   Q1 2018   Q2 2018   Q3 2018
Total revenue                                      330       207       341       439       384       233       396       525       460       316       498       433
EBITDA                                              44        11        34        73        56        19        42        96        62         9        45        32
EBITA                                               42         9        32        67        52        15        37        89        55         2        38        23
EBIT                                                35         3        26        61        47         9        32        84        52         1        37        17

Parent, holding companies and eliminations   Full year
(NOK million)                                    2015    Q1 2016   Q2 2016   Q3 2016   Q4 2016   Q1 2017   Q2 2017   Q3 2017   Q4 2017   Q1 2018   Q2 2018   Q3 2018
Eliminations                                         0         0         0         0         0         0        -3        -3        -5        -1        -5        -3
EBITDA                                             -39        -5       -17        -5        -7        -8        -9        -4       -10        -6        -6       -19
EBITA                                              -40        -5       -17        -5        -7        -8        -9        -4       -10        -6        -6       -19
EBIT                                               -40        -5       -17        -5        -7        -8        -9        -4       -10        -6        -6       -19

24
24
Our entire business revolves around sustainability
As populations and cities grow, efficient transportation systems with a low carbon footprint are becoming increasingly important across the world.
Building such systems is our core business.
Our competence and capabilities cover all phases of the projects. Since we take a holistic view in the planning and execution of the work, our projects
are sustainable and create value in both economic and environmental terms.

UN model for sustainable business                                                            Our sustainable business model
                                                                                                                ENGINEERING

                                                                                                                        1

                                                                                         ENVIRONMENT        7                      2       SECURITY &
                                                                                                                                           SAFETY

                                                                                                                      PROJECT
                                                                                                                    MANAGEMENT
                                                                                           ELECTRO      6                              3     GROUNDWORK

                                                                                                                5             4
                                                                                                   SIGNAL &                       TRACK
                                                                                                   TELECOM

25
25
Sustainability goals in action
       •   HSE Handbook (Norway and Sweden)
       •   Diversity
       •   Trainees)

       •   Green public transportation infrastructure
       •   Landfill and waste disposal
       •   Innovation and creativity on assignment
                                                                                 NRC Group sees UN’s
       •   Site waste management and recycling                             sustainability goals as a guideline
       •   Harbour development and renovation                             to our business approach. Here are
       •   Road safety projects                                           examples of how these goals come
       •   Environmental decontamination and soil waste management         into action in our daily operations.

       •   Material selection
       •   Responsible supply chain

       •   Storgata, fossil-free construction site
       •   Electric excavator
       •   Reducing soil waste transportation, focus on local solutions

26
26
You can also read