Acquisition of Shell NZ Downstream Oil Assets - Marko Bogoievski CEO - Infratil
←
→
Page content transcription
If your browser does not render page correctly, please read the page content below
Acquisition of Shell NZ Downstream Oil Assets

Marko Bogoievski
CEO
Infratil Limited
March 29, 2010
SNZ – high quality asset in an attractive industry

• Transaction terms and purchase price
 – 50/50 JV between Infratil and NZ Super
 – Acquisition scheduled to close on April 1, 2010
 – $696.5 million base purchase price
    - plus net working capital (NWC) adjustment for NWC at close in excess of $208m
    - includes 17.1% stake in NZ Refining (value approximately $190m)

• Key investment highlights
  – Structurally attractive industry
  – Leading market share position
  – Strong cash-flows with long-term business improvement initiatives and
    reinvestment potential
  – Experienced local management team focused on optimising New Zealand
    outcomes

                                                                                2
How does downstream oil fit with IFT?

• Strong cash flow asset with material
  reinvestment potential in an industry about to
  undergo significant change
• Market leader in most segments with
  competitive cost base and access to critical
  infrastructure
• Quality portfolio of commercial customers and
  retail sites
• Should respond well to selective investment
  after many years of limited available capital
• IFT familiarity with energy and transport
  supplemented by industry hires and third-party
  advisors where necessary
• Opportunity to invest in a substantial NZ
  business

                                                   3
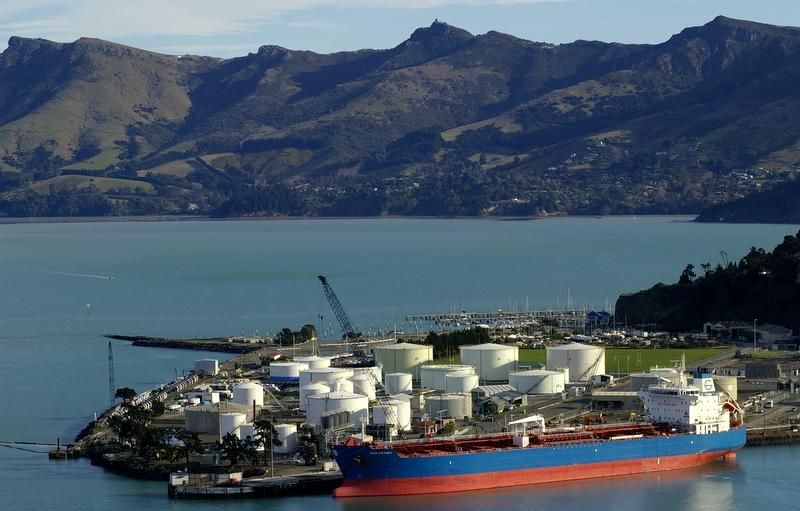
What is being acquired

                                  Refining & National           Storage, terminal &           Retail & Commercial
  Supply & Inventory                  Distribution             Regional Distribution                  Sales

• Annual purchase of             • 17.1% of the New Zealand   • 12 storage and terminal      • 229 service stations and
  2,500m litres of crude and       Refining Company             facilities around New          95 truck stops nationwide
  refined product and its        • Process agreements to        Zealand                      • Other specialist fuel
  delivery to New Zealand          source finished product    • Delivery from regional         facilities for aviation,
• Finance and management         • 25% share in coastal         depots directly to             marine and commercial
  of up to 650m litres of fuel     shipping network             commercial users or to         users
  inventory                      • 47.9m shares in NZRC         service stations and truck   • 25% of Fly Buys
                                   approx $190m market          stops
                                   value

                                                                                                             4
Transaction overview

• 50/50 Joint Venture between Infratil Limited and
  the NZ Superannuation Fund                               PURCHASE PRICE ANALYSIS:

• $696.5 million base purchase price:                      $696m base consideration

  – Includes 47.9m shares in NZ Refining                   Adjustments:
    (17.1% stake)
                                                           - $190m NZRC stake
  – Plus/minus a working capital adjustment for actual
    values on 1 April 2010 above/below $208m               + $42m(1) to normalise NWC
  – Normalised NWC over 12 months is expected to be        = normalised EV of $548m
    closer to $250m
  – NWC can fluctuate significantly at period-end as a   • 2009 current cost EBITDA of $138m
    result of crude shipments, oil prices and FX rates
  – $13.5 million advance license royalty payment for    • 2009 historic cost EBITDA of $176m
    brand
• $420m equity capital
                                                         (1)($250m normalised NWC less $208m included
• $600m total debt facilities to fund acquisition,         in base purchase price)
  working capital fluctuations and future activity:
  – $350m core bank debt
  – $250m working capital facility                                                        5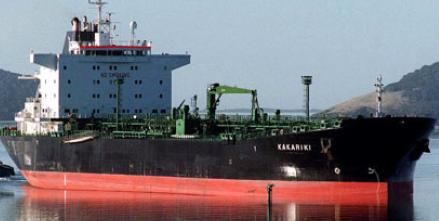
Transaction structure

                        • Infratil and the New Zealand
                          Superannuation Fund will each
                          subscribe for $210 million of
                          equity in a new Holdco (total
                          $420m equity)      250
Retail

                        • Holdco will use bank facilities
 Infrastructure
                          to fund the remainder of the
                          purchase consideration
Marine                    – $696.5m base acquisition price
                            +/- any net working capital
Aviation
                            adjustment on 1/4/10 (to be
                            determined)
Customers/pricing
                        • Agreement provides for
                          specific indemnities related to
Chemicals
                          litigation, tax and
                          environmental risks
                                                    6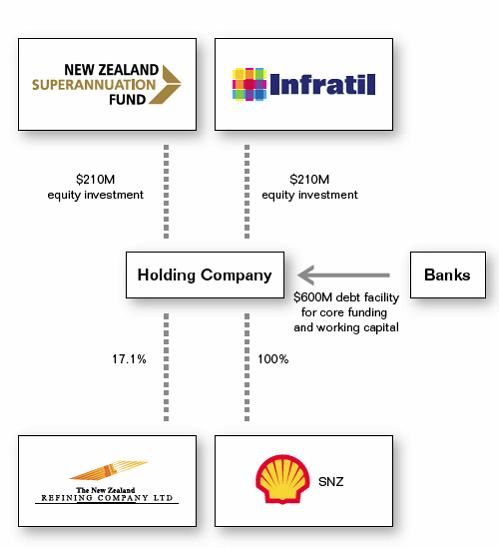
Impact on IFT consolidated accounts

• Statutory reporting based on FIFO result        Year ended 31 Dec 2009            SNZ
  for valuing inventory                           $ million                      Pro-forma
                                                  Reported EBITDAF                  $179
• Internal performance reporting based on
  a “current cost” valuation for inventory        Depreciation                      ($22)
  – Industry norm for monitoring retail margins   Additional debt interest          ($30)
    given the need to reflect the current         NPBT                              $127
    wholesale cost of product
                                                  Tax                               ($38)
                                                  Net Surplus                       $89
2009 PRO-FORMA
                                                  Year ended 31 Dec 2009          Pro-forma
• Pro-forma SNZ result for December 2009          $ million                     impact on IFT
  would have shown accretion at the IFT           Tax paid associate earnings       $44
  consolidated level after all financing
                                                  Additional debt interest          ($10)
  costs ($10m pa = actual current marginal
  cost on the $210m investment)                   NPBT                              $34

  – EPS +6cps                                     Tax credit                         $3
  – SNZ would also have been accretive from a     Net Surplus                       $37
    cash basis after financing, capex, and        Per share/IFTWB 606.6m            6 cps
    dividends

                                                                                          7
Infratil asset mix and capital structure – post Shell
IFT asset mix IFT parent capital structure
Other 2%
NZ BUS 8%
IAE 6%
Shell 10% PiiBs 12%
WIAL 14% Equity 49%
Bonds 26%
TrustPower
48%
Banks 13%
IFT Energy
Australia 12%
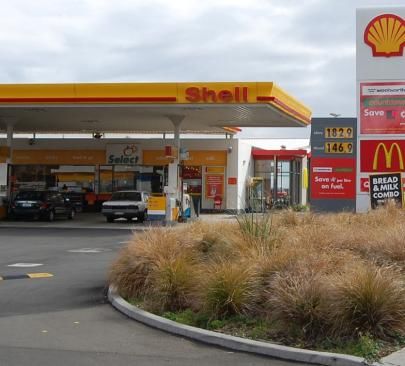
8Shell NZ customer experience
• In the short term change will not be obvious to retail customers
• Procurement is being undertaken by Shell on behalf of the new owners
• Shell’s fuel technology and product development will continue to be available
• Shell has agreed to allow medium term use of the Shell brand for retail sales
• Marketing initiatives and competitive retail pricing of fuels will remain
9Industry Overview
Overview of the NZ downstream oil industry

 Sourcing                Refining                       Storage and distribution                                   Sales

                                          Refinery to                                         Airport refuelling
                                                               Wiri            Wiri to
   Crude                   NZRC           Auckland                                             infrastructure
                                           pipeline          storage       airport pipeline
                                                                                                 (Auckland)
                                                                                                                            Airlines
                                                                                              Airport refuelling
                                                                                                infrastructure
                                                                                               (other airports)

                                           Coastal                              Road               Retail
                                                                                                                           Consumers
                                           shipping                           transport            sites

                                                           12 national
 Refined                                                                                           Truck
                                                             storage                                                       Businesses
 products                                                                                          stops
                                                            locations

                                                                                                Barges and
                                                                                                                             Ship
                                                                                               port refuelling
                                                                                                                            owners
                                                                                               infrastructure
 Not owned by local oil majors

 Shared by oil majors                                       Bitumen                                                          Road
                                                            storage                                                        contractors
 Individually owned, fee based sharing

 Individually controlled, seldom shared
                                                                                                                       11
Overview of the NZ downstream oil industry
(cont’d)
Supply Refining Distribution Channel
Key players Shell Shell
Retail
BP BP
Business to business
Chevron NZRC Caltex
fuels
Mobil Mobil
Specialty
Oil trading agents Gull (eg chemicals)
• Crude and refined • NZRC is the sole • Product is distributed • Marketing channels to
Description product sourced from refinery in NZ around country via final customer
overseas upstream shared coastal
• Produces approx • Retail: Branded service
producers shipping arrangement
70-80% of NZ’s stations nationwide.
(COLL)
• Majors typically use finished product Various owner/operator
their own proprietary (balance is imported) • Shared industry models available.
trading desks arrangement provides Convenience retail a
• Majors are
tankage throughout NZ key supplementary
• Various markets & shareholders
income
trading agents • Fuel in a shared tank
• Direct pipeline from
available anywhere in the • B2B: Includes marine,
NZRC (Marsden point)
country means a Major aviation, and bulk fuels
to Auckland, largest
can draw fuel from any
market
other tank in the
country (within limits)
• Also some proprietary
distribution assets
(eg Woolston pipeline)
12NZ diesel and petrol demand projections
Annual Consumption MED forecast diesel demand,
(million litres) upper and lower bounds
4,000
3,500
3,000
2,500
2,000
1,500
1,000
1997 1999 2001 2003 2005 2007 2009 2011 2013 2015 2017 2019 2021 2023 2025
Annual Consumption MED forecast petrol demand,
(million litres) upper and lower bounds
3,500
3,000
2,500
2,000
1,500
1,000
1997 1999 2001 2003 2005 2007 2009 2011 2013 2015 2017 2019 2021 2023 2025
13
Source: NZ Ministry of Economic DevelopmentIndustry has structurally attractive elements
• Volatile crude and product prices are largely passed through to end users
• Demand is quite robust relative to normal fluctuations in price
– NZ retail petrol demand has declined 1% since 2004 despite pump prices fluctuating
within a much broader range
• Market currently has 4 key players
– Shell and BP currently have ≈ 56% retail market share in NZ
• Difficult to replicate assets and infrastructure
– Single tolling refinery producing 70-75% of NZ’s finished product needs
– Distribution pipelines, storage facilities and on-airport JV’s
• Competitive environment is likely to be favourable to a new local owner
– Evidence of a growing consumer preference for local companies, e.g. Kiwibank
– Multinational oil majors focusing investment on upstream and exploration activities
(Mobil has announced it’s intention to exit NZ downstream)
– Signals interpreted as the beginning of a potentially significant industry restructure
14Shell NZ provides a strong entry point
Crude supply, procurement, inventory, funding and risk management
Sourcing • Ongoing relationship with Shell global trading desk (trading and logistics
expertise) and access to the right crudes and finished product for the NZ
market
70% of SNZ’s product requirements are sourced from NZ Refining Company
• Buying 17.1% share of NZRC during a period of bottom-of-cycle margins
Refining
• Contract terms provide a benefit relative to importing refined products
• Refinery to Auckland pipeline provides lowest cost distribution option
National network of storage and distribution facilities
Storage and • Significant competitive advantage arising from economies of scale
distribution • Coastal shipping and terminal facilities at 12 locations around NZ
• SNZ owned assets supplemented by shared industry facilities
SNZ is the market leader in most market segments
• Well located nationwide network of retail sites and truck stops
Sales
• Retail site volumes average ≈ 5mL pa compared to industry ≈ 2.7mL pa
• Unique loyalty programs of FlyBuys and supermarket dockets
15Future sources of value
• Improve the economics and flexibility of the crude and product
supply arrangements
Sourcing
• Increase economies of scale through shared sourcing, e.g. freight
and crude shipments
• Explore increased optimisation within NZRC tolling arrangements
Refining
• Make build or buy decisions on an integrated margin basis
• Increase import terminal storage to enable improved freight economics
Storage & and reliability
distribution • Optimise cost structures as existing JV’s flex with changes in industry
structure – i.e. transport, distribution, and storage
• Invest in an improved overall retail offer
Sales • Make decisions based on local context and an integrated business model
• Options around carbon pricing and risk management for third parties
16Benefits to NZ Inc and local stakeholders
• SNZ and NZRC dividends will mainly flow to NZ shareholders, and the public via NZ Super Fund
Profits retained
in New Zealand – Closer proximity of capital providers and operations will result in a more pragmatic approach
to investing in the business
• On-shoring of many roles currently performed overseas
More local jobs – Front-line roles such as the customer service centre, presently based in Manilla
and staff training – Highly skilled knowledge based roles such as Asset Management and Marketing
• Training and skill development required for front-line staff to deliver new customer offers
• Upgrading core corporate IT systems and retail POS systems
Increased capital
spend with local • Potential re-imaging of all physical assets nationwide – design, engineering, construction
businesses • New infrastructure (e.g. import terminals) and upgraded convenience offer
Local R&D • On-shoring of R&D in products and services, which are tailored to the NZ market
activity • Concept trials and pilot programmes conducted locally, rather than offshore by Shell
Improved • Innovative new offers for business customers, unconstrained by Shell global policy
customer offers • Upgraded retail offer through broadening and/or deepening options
17Shell NZ Financial and Operational Metrics
Shell NZ historic financial performance

    Year ended 31 December
    $ million                             2005           2006          2007           2008          2009
    Revenue (excluding tax)              $1,788         $2,206         $2,175        $2,942         $2,152
    Gross margin                          $289           $315           $288          $399           $368
    Operating costs                       ($171)        ($204)         ($208)        ($245)         ($230)
    Current Cost EBITDA                   $118           $111           $80           $154           $138
    Stock value adjustment                 $55            $47           $70          ($160)          $38
    Historic Cost EBITDA                  $173           $158           $150           ($6)          $176
    Depreciation                          ($27)          ($23)         ($20)          ($21)          ($22)
    NZRC contribution                      $41            $41           $33            $32            $3
    Group Reported Earnings
                                          $187           $176           $163           $5            $157
    before Interest & Tax

Stable, growing core earnings
•    Current cost earnings reflect historic cost earnings adjusting COGS by restating opening and closing balance
     of inventory at the average cost per litre for the period
•    NZ GAAP earnings will reflect historic cost or FIFO-based methodology

                                                                                                        19
Shell NZ historic operational metrics
Year ended 31 December
$ million 2005 2006 2007 2008 2009
$49.18 – $80.95 – $71.44 – $64.49 – $65.13 –
Crude price range NZ$/bbl
$84.30 $113.42 $116.96 $180.75 $111.51
Sales (million litres) 2,519 2,479 2,538 2,610 2,508
Sourced from Refinery (%) 67% 70% 64% 67% 70%
Distributed to retail (%) 49% 50% 49% 47% 50%
Inventory (million litres) 630 516 533 456 411
Current Cost EBITDA $118m $111m $80m $154m $138m
Stable sales volumes and increased margins
• Approximately 70-75%% of the fuel SNZ distributes is processed through NZ Refinery on favourable terms
• Sales are approximately 50/50 retail/commercial, which is the same split as the market as a whole
• Market leadership provides a benefit as many costs are relatively fixed. SNZ’s service stations dispense an
average 5.2 million litres of fuel per annum while the rest of the industry averages 2.7 million litres
20Net working capital
• Shell NZ receives relatively steady Cashflow from operations — simplified example
receipts from retail and commercial
sales
Total cash held
• But infrequent shipments of crude
and finished product create large
payables and movements in
inventory
• 12-15 crude shipments p.a.
averaging 0.7mbbl, and 20-30 Crude Product Crude Time
shipment 1 shipment 1 shipment 2
cargoes of refined fuel averaging
0.2mbbl
• At any point in time, SNZ maintains
targeted minimum levels of
inventory
• SNZ exposure is largely limited to
inventory above or below average
inventory levels
21www.infratil.com
You can also read