THE WHEELHOUSE REPORT - Wheelhouse Commercial
←
→
Page content transcription
If your browser does not render page correctly, please read the page content below

FEBRUARY 2020 | ISSUE XIV

                THE WHEELHOUSE REPORT
                 In-depth market information on Denver’s commercial real estate market.

                                                                                   In This Issue
                                                                                   FEATURE ARTICLE
                                                                                   The Metamorphosis of
                                                                                   the Shopping Mall
                                                                                   MARKET REPORT
                                                                                   Retail Market
                                                                                   Analysis, Q4 2019
                                                                                   ASK AN EXPERT
                                                                                   Property Tax Increases
                                                                                   for Colorado Retail

                                                                                   The Wheelhouse Report is
The Metamorphosis of the Shopping Mall                                             produced by Wheelhouse
                                                                                   Commercial, a full-service
By Andrea Ackerman, Business Development Manager                                   commercial property
                                                                                   management company
                                                                                   headquartered in
Since the first shopping mall opened in 1954 in Detroit, Michigan, the
                                                                                   Denver, Colorado.
U.S. has seen an exponential increase in the number of malls. Over the
years, as consumer buying trends have changed, malls have undergone an             Each month we bring you
impressive metamorphosis themselves. Nationwide, creative developers,              in-depth market news and
often in partnership with local governments, are transforming older malls          data on all segments of
into vibrant, new communities with unique neighborhood focal points.               Denver’s commercial real
And Colorado has been at the forefront of this trend.                              estate market.

THE BIRTH OF THE MALL
In the early 1950s, Austrian architect Victor Gruen conceptualized the
modern “shopping mall.” While in Detroit, Michigan due to a canceled
flight, Gruen decided to visit Detroit’s landmark Hudson’s Department
Store. During his visit he came to the realization that despite the store itself
being quite nice, it was located in a deteriorating section of downtown. Run-      574 Santa Fe Dr, Suite 300
down city centers were a common occurrence across the country after the            Denver, CO 80204
                                                                                   303.518.7406
                                                                                   wheelhousecommercial.com
FEATURE ARTICLE

The Metamorphosis of the Shopping Mall 				                                                (from previous page)

Great Depression and WWII, as veterans could           such as transportation, accessibility, and nearby
purchase housing outside of the city center, for       residential neighborhoods, today these malls are
no money down. The transformative American             located on prime real estate.
suburban migration had begun.
                                                       TRANSFORMATION ACROSS THE NATION
Gruen reached out to Hudson’s leadership and           Innovative   and    responsive    developers       and
explained that their customers were moving             business owners are observing these trends and
outside the city and so should they. He urged          making moves. Nationwide, shopping malls have
Hudson’s to embark on the creation of a suburban       been repurposed into a variety of different uses,
commercial development. This would allow them          and the options seem endless.
to be their own landlord, thereby also diversifying
their business by becoming real estate developers      As an example, big companies like Hewlett-
and property managers. Lastly, this would give         Packard and Google see these already existing
them the authority to pick and choose other            “communities”      as   opportunities     to    create
retailers that would complement and enhance            campuses and offices for their companies. An
their core business, creating a first-ever synergy     iconic mall in Rhode Island has converted their real
among retailers.                                       estate into micro-apartments while also keeping
                                                       a mix of local businesses and conveniences such
Gruen’s Northland Mall opened in 1954. It was          as salons, coffee shops, restaurants, and other
the first of its kind, and the largest mall that had   “lifestyle” businesses. Tennessee transformed
ever been built. It was a tremendous success, and      one of their antiquated malls into an education
was the genesis for what has become known as           and sports venue; supporting their local hockey
the shopping mall, and created a significant shift     team, making space for a community college, and
in consumer shopping habits.                           adding a public library.

THE 21ST CENTURY MALL PLAGUE                           Repurposing trends include apartments, business
Beginning around the turn of this century,             and conference centers, churches, government
shopping malls across America have been                offices, hotels, senior living, medical campuses
increasingly abandoned. These 100-500 acre,            and public transportation hubs. Entities that
1-million-square-foot-plus     centers   are   being   embody community and convenience have
vacated rapidly, as one retailer after another         become the newest tenants.
closes its doors or downsizes dramatically. They
leave behind enormous, desolate buildings in           In some cities, one might find that large portions
the center of bustling neighborhoods. As many          of a shopping mall converted to appeal to a strong
of the properties are falling into bankruptcy,         demographic of a population. One might find a
creative real estate entrepreneurs are finding         mixture of ethnic food markets, clothing apparel,
tremendous re-development opportunities. As            restaurant equipment, and perhaps event spaces
the locations were originally chosen by indicators     to hold cultural parties and gatherings.

THE WHEELHOUSE REPORT | FEBRUARY 2020                                                                    PAGE 2
FEATURE ARTICLE

The Metamorphosis of the Shopping Mall 				                                                  (from previous page)

Another recent trend is the ghost kitchen. This model transforms large, empty spaces into professional,
food preparation facilities providing dining-less restaurants. This allows food concepts to sell their menus,
by delivery only, without having the expense of brick-and-mortar and additional staff.

Simon Properties has taken a vested interest in the tenants in their portfolio. In 2016, Simon and mall
owner General Growth Properties, now owned by Brookfield Property Partners, saved Aeropostale from
bankruptcy. Today, they’re at it again, making an $81 million offer to buy Forever 21. Owners are becoming
players in their own game.

MILE-HIGH TRENDSETTERS
Colorado has been a trendsetter in mall transformations; more than 60% of the malls in the Denver
Metropolitan area have been, or are currently being repositioned.

•   Cinderella City Mall, built in 1968, was known as the largest mall west of the Mississippi. In the early
    2000s, it was redeveloped and is now called City Center Englewood – a mixed-use development that
    has revitalized the area. The 55-acre development includes a light rail station, city government offices,
    residential units, retail, a library, and even an art museum.
•   The Pavilions was Denver’s first “open air” mall. Gart Properties wisely located it right on the 16th
    Street pedestrian mall, in the heart of downtown Denver in 1998.
•   Southglenn Mall in Littleton was a typical indoor American shopping mall. In 2005, Alberta Development
    partnered with the City of Centennial to create the neighborhood-style Streets at Southglenn.
•   Crossroads Mall in Boulder, built in 1963, was another mall hanging on for dear life. In 2004 it closed,
    and re-opened as the new 29th Street Retail District, an outdoor shopping neighborhood.
•   Villa Italia Mall in Lakewood closed and defaulted to the city in 2001. The resulting redevelopment,
    Belmar, is generating four times the tax revenue of the old mall. Belmar’s open-air residential and
    shopping district consists of 900,000 sf of retail over 22 walkable city blocks and is 95% occupied.
•   Westminster Mall is currently in redevelopment. The city purchased the site and is acting as the
    “horizontal developer,” selling individual parcels to developers who are implementing the vertical
    construction.

SOARING TO NEW HEIGHTS
The use and intention of traditional shopping malls has shifted. Historically, they held clothing, apparel,
and other retail choices. Today, mall owners are repositioning their assets to go far beyond retail, and
adjusting to the needs of the community. By providing a welcoming new mix of uses, malls are producing
a cultural win, and re-establishing a significant source of tax revenue.

THE WHEELHOUSE REPORT | FEBRUARY 2020                                                                      PAGE 3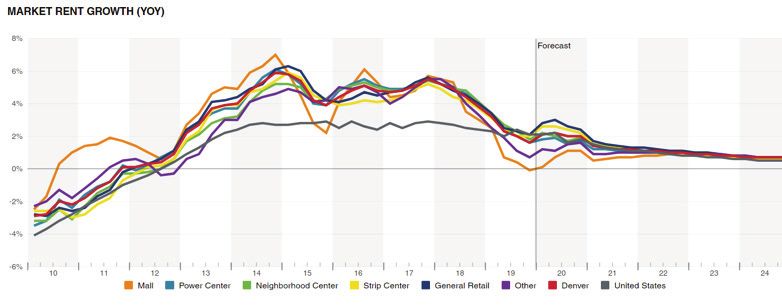
MARKET REPORT                                                                                                                                THE
                                                                                                                                              THEWHEELHOUSE
                                                                                                                                                  WHEELHOUSEREPORT:
                                                                                                                                                             REPORT:July
                                                                                                                                                                      July2019
                                                                                                                                                                           2019
Retail Market Analysis: Denver Metro Q4 2019

Wheelhouse Commercial has compiled and analyzed the most recent retail market data from the last
quarter. The table below reports some of the key market indicators from 11 submarkets across the
greater Denver retail market, during Q4 2019.

                                                                    RETAIL MARKET DATA: DENVER METRO Q4 2019*

                       VACANCY         AVAILABILITY       MARKET          ANNUAL               INVENTORY            12-MONTH            UNDER CONSTR.           UNDER CONSTR.              12-MONTH NET
  SUBMARKET
                         RATE              RATE           RENT/SF       RENT GROWTH                SF              DELIVERED SF              SF                 % OF INVENTORY             ABSORPTION SF

Overall Denver           4.6%              5.8%           $22.96             2.1%                155M                  825K                  1.1M                      0.7%                     -322K

West                     5.1%              6.6%           $20.32             2.4%            24,072,417               43,878                53,812                     0.2%                    -97,740

Central                  3.1%              4.6%           $23.04             2.6%            21,132,203              131,083               130,946                     0.6%                    -29,088

Northwest                5.9%              6.7%           $20.71             2.0%            24,718,505              157,040               105,854                     0.4%                   -202,515

South                    4.6%              5.6%           $28.22             1.5%            18,326,781               63,097                97,136                     0.5%                    10,660

Southeast                4.8%              4.9%           $25.16             2.2%            15,361,520              114,102                42,345                     0.3%                    -88,904

Northeast                5.0%              6.4%           $21.18             2.3%            15,149,389               78,182               321,935                     2.1%                    148,298

Aurora                   5.6%              5.7%           $16.95             2.4%            12,148,974              108,471                93,350                     0.8%                    -32,670

Southwest                3.5%              5.9%           $20.57             2.2%            10,348,186              100,263                 7,740                     0.1%                    120,887

 Colorado Bl/
                         4.7%              5.2%           $42.52             1.2%             5,143,741                6,555                    0                      0.0%                   -105,631
 Cherry Ck

 Downtown                3.0%              8.4%           $31.73             1.0%             3,444,550                   0                206,240                     6.0%                    -75,226

 Southwest
                         2.8%              5.4%           $17.22             2.1%             1,257,082                   0                     0                      0.0%                     9,880
 Outlying

* Source: CoStar. The information contained in this newsletter is obtained from sources deemed reliable; however, Wheelhouse Commercial cannot guarantee the accuracy of the information provided.

THE WHEELHOUSE REPORT | FEBRUARY 2020                                                                                                                                                                PAGE 4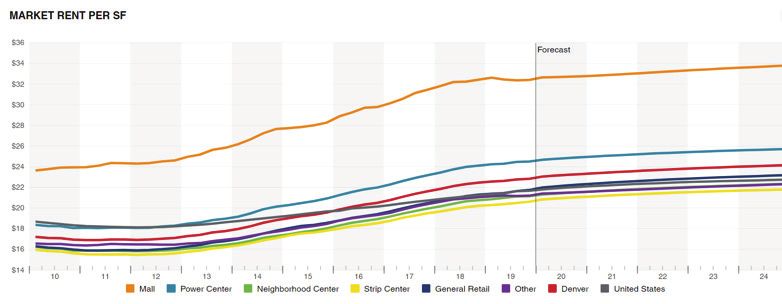
MARKET REPORT

Retail Market Analysis: Denver Metro Q4 2019                                            (from previous page)

MARKET RENTS
Retail rents began to moderate in 2019, with annual rent growth falling below 1% for the first time since
2011. However, considering that Denver experienced a six-year run of 5% annual rent growth this is not
unexpected. And, all of the submarkets that we track regularly in this report, which constitute the core
of the Denver metro area, saw at least 1% growth and some submarkets still clocking in at over 2% rent
growth in 2019. It seems we have reached a level of stability which is forecast to remain the same for the
foreseeable future.

THE WHEELHOUSE REPORT | FEBRUARY 2020                                                                 PAGE 5
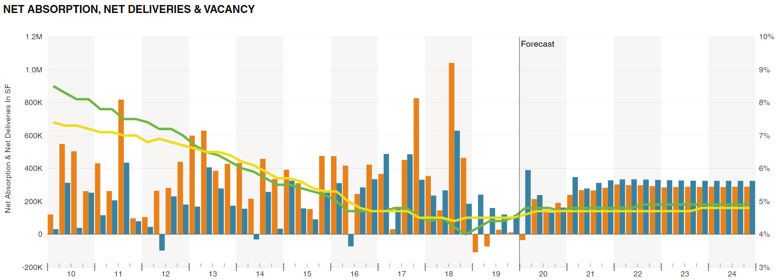
MARKET REPORT

Retail Market Analysis: Denver Metro Q4 2019                                             (from previous page)

VACANCY
The Denver market retail vacancy rate stands at 4.6%, which is up slightly since the third quarter of 2019.
However, Denver remains one of the strongest retail markets in the nation. Denver did see an overall
negative net absorption in 2019, which was primarily due to large box retailers shuttering (Safeway,
Kmart, Sears) and little new development under construction in this cycle.

With the headwinds caused by online shopping, developers have been very hesitant to embark on new
projects, which is probably prudent; but our strong economy and demographics have balanced out the
negative effects that e-commerce has had on brick-and-mortar retail in other markets.

As with rent growth, the forecast is to now enter into a leveling-off period, with vacancy rates trending
only slightly up or down, depending on the type of retail (mall, neighborhood center, strip center, etc.)

THE WHEELHOUSE REPORT | FEBRUARY 2020                                                                  PAGE 6
QUESTIONS?
                                                                                 COMMENTS?
                                                                                 WANT MORE INFO?

                                                                                 Feel free to reach out
                                                                                 if you’d like more
                                                                                 information on our
                                                                                 services, have questions
                                                                                 or have comments on our
                                                                                 newsletter content.

                                                                                 303.518.7406
                                                                                 info@wheelhousecommercial.com

                                                                                 A TRADITION OF EXCELLENCE
                                                                                 Wheelhouse Commercial
                                                                                 is proud to be a part of
                                                                                 the Wheelhouse Family
ASK AN EXPERT
                                                                                 of Companies, continuing
Property Tax Increases for Colorado Retail                                       a tradition of excellence
                                                                                 in commercial real estate
                                                                                 investing, management,
Q: My Colorado retail building’s property taxes went up quite bit this
                                                                                 leasing and construction.
year. Will this happen again in two years?

A: Most likely yes. The County Assessor uses the comparable sales method         • Wheelhouse Commercial
to determine a building’s value. With the Denver real estate market still red-   • Wheelhouse Construction
                                                                                 • Wheelhouse Apartments
hot, properties keep trading higher and higher (appreciating). These most
                                                                                 • Boutique Apartments
recent sales prices will be used during the next assessment, which begins in
the summer of 2020.

If you have a burning question or concern about commercial property
management, drop us a line. We’ll feature one question from our readership
in our newsletter. Send your questions to info@wheelhousecommercial.com.
                                                                                 574 Santa Fe Dr, Suite 300
                                                                                 Denver, CO 80204
                                                                                 303.518.7406
                                                                                 wheelhousecommercial.com
You can also read