PREDICTING THE MATCH OUTCOME IN ONE DAY INTERNATIONAL CRICKET MATCHES, WHILE THE GAME IS IN PROGRESS
←
→
Page content transcription
If your browser does not render page correctly, please read the page content below
©Journal of Sports Science and Medicine (2006) 5, 480-487
http://www.jssm.org

Research article

The 8th Australasian Conference on Mathematics and Computers in Sport, 3-5 July 2006,
Queensland, Australia

PREDICTING THE MATCH OUTCOME IN ONE DAY

INTERNATIONAL CRICKET MATCHES, WHILE THE GAME IS

IN PROGRESS

Michael Bailey 1             and Stephen R. Clarke 2
1
    Department of Epidemiology & Preventive Medicine, Monash University, Australia
2
    Swinburne University of Technology, Melbourne, Australia.

Published (online): 15 December 2006

        ABSTRACT
        Millions of dollars are wagered on the outcome of one day international (ODI) cricket matches, with a
        large percentage of bets occurring after the game has commenced. Using match information gathered
        from all 2200 ODI matches played prior to January 2005, a range of variables that could independently
        explain statistically significant proportions of variation associated with the predicted run totals and match
        outcomes were created. Such variables include home ground advantage, past performances, match
        experience, performance at the specific venue, performance against the specific opposition, experience at
        the specific venue and current form. Using a multiple linear regression model, prediction variables were
        numerically weighted according to statistical significance and used to predict the match outcome. With
        the use of the Duckworth-Lewis method to determine resources remaining, at the end of each completed
        over, the predicted run total of the batting team could be updated to provide a more accurate prediction of
        the match outcome. By applying this prediction approach to a holdout sample of matches, the efficiency
        of the “in the run” wagering market could be assessed. Preliminary results suggest that the market is
        prone to overreact to events occurring throughout the course of the match, thus creating brief
        inefficiencies in the wagering market.

        KEY WORDS: Linear regression, live prediction, market efficiency, betting .

INTRODUCTION                                                    innings to score more than the target set in the first
                                                                innings. The high scoring nature of ODI matches
The first official one day international (ODI) match            ensures that team totals and differences between
was played in 1971 between Australia and England                scores can be well approximated by a normal
at the Melbourne Cricket Ground. Whilst ODI                     distribution. As shown by (Bailey, 2005), this
cricket has developed over the past 35 years (2300              facilitates the use of multiple linear regression to
matches), the general principles have remained the              predict a margin of victory (MOV) prior to the
same. Both sides bat once for a limited time                    commencement of the match. Using a similar
(maximum 50 overs) with the aim in the first innings            approach, a multiple linear regression is also used to
to score as many runs as possible, and in the second            predict the number of runs scored by the team
Predicting ODI’s while in progress 481
Table 1. Percentage of resources available for overs remaining and wickets lost.
Overs Wickets lost
remaining 0 1 2 3 4 5 6 7 8 9
50 100.0 93.4 85.1 74.9 62.7 49.0 34.9 22.0 11.9 4.7
40 89.3 84.2 77.8 69.6 59.5 47.6 34.6 22.0 11.9 4.7
30 75.1 71.8 67.3 61.6 54.1 44.7 33.6 21.8 11.9 4.7
25 66.5 63.9 60.5 56.0 50 42.2 32.6 21.6 11.9 4.7
20 56.6 54.8 52.4 49.1 44.6 38.6 30.8 21.2 11.9 4.7
15 45.2 44.1 42.6 40.5 37.6 33.5 27.8 20.2 11.8 4.7
10 32.1 31.6 30.8 29.8 28.3 26.1 22.8 17.9 11.4 4.7
5 17.2 17.0 16.8 16.5 16.1 15.4 14.3 12.5 9.4 4.6
1 3.6 3.6 3.6 3.6 3.6 3.5 3.5 3.4 3.2 2.5
batting first. With the use of (Duckworth and Lewis, given by Duckworth and Lewis (1999).
1999) approach of converting resources available Whilst the D-L approach was specifically
into runs, as each over is bowled, the current total designed to improve ‘fairness’ in interrupted one-
and the predicted total for the remaining overs are day matches, (de Silva et al., 2001) found that when
combined to produce an updated predicted total for used to quantify the MOV, the D-L approach
the batting team. The difference between the pre- sometimes overestimated the available resources
match predicted total and the updated predicted total when the second team to bat won easily, and
provides a measure of how the batting team is underestimated the available resources when the
performing through the course of their inning. This second team to bat only just won. By minimizing
difference is then used to provide an updated the Cramer-von Mises statistic for the differences
prediction for the MOV. between actual and predicted runs, de Silva derived
a formula to reduce bias by modifying the remaining
METHODS resources. This is given by
In ODI cricket the aim of the team batting first is to Rmod = (1.183 – 0.006R)R (1)
score as many runs as possible in the allotted time
(usually 50 six ball overs). If the first team scores where Rmod = modified resources and R =
resources given using D-L (see Table 1).
more runs than the second team, the MOV can
readily be expressed in terms of runs difference
When an ODI match is won by the team
between the two teams. The aim of the side batting
batting first, the MOV is readily determined by the
second is to score more runs than the first team.
difference in runs scored. When the match is won by
Because the game is deemed to be finished if the
the team batting second, the MOV can be found by
team batting second achieves their target, the MOV
multiplying the first innings run total by the
is usually expressed in terms of resources (wickets
corresponding modified percentage of resources
and balls) remaining, rather than runs. In order to
remaining as given by (1). By referencing the MOV
develop a predictive process for match outcomes, a
so that a ‘home’ win has a positive value and an
consistent measure of the MOV is required. This
‘away’ win has a negative value, it can be seen from
can be achieved by following the work of
Figure 1, that the underlying distribution for MOV
Duckworth and Lewis (1999) to convert resources
can be well approximated by a Normal distribution.
available into runs.
Frank Duckworth and Tony Lewis developed
Statistical analysis
a now well-known system for resetting targets in
All analysis was performed using SAS version 8.2
ODI matches that were shortened due to rain.
Although this system has undergone several (SAS Institute Inc., Cary, NC, USA). Multiple
refinements in recent years, the general way in linear regression models were constructed using a
which the Duckworth-Lewis (D-L) method is stepwise selection procedure and validated a
calculated has not changed, with wickets and balls backward elimination procedure. To increase the
remaining expressed as resources available and robustness of the prediction models a reduced level
converted to runs. Table 1 shows an abbreviated of statistical significance was incorporated with all
version of the remained resources (R) for wickets variables achieving a level of significance below p =
lost and balls remaining. A complete tables and 0.005. Comparisons between continuously normally
detailed account of the derivation of this table is distributed variables were made using student t-tests.482 Bailey and Clarke
17.5
15.0
12.5
Percent
10.0
7.5
5.0
2.5
0
-275 -225 -175 -125 -75 -25 25 75 125 175 225 275
MOV
Figure 1. Histogram of MOV referenced against the home team in 2200 matches played prior to Jan 2005.
Prediction models for MOV variation in ODI outcomes (R-square: 23.4% vs.
Using match and player information from 1800 19.6% p < 0.0001).
ODIs played prior to Jan 2002, (Bailey, 2005) Because the MOV in the regression model is
combined measures of recent form, experience, nominally structured in favour of the home team, the
overall quality and home ground advantage (HA), to intercept term in the regression equation reflects
produce a prediction model that was successfully HA. It can be seen from Table 2 that HA is
used to identify inefficiencies the betting market for equivalent to about 14 runs and is highly statistically
ODI matches. Using 2200 matches played prior to significant (p < 0.0001). Because one third of all
January 2005 an updated version of this model was ODI have been played at neutral venues, a binomial
created and compared to the original. indicator variable was created to negate the HA for
Prediction variables of experience, quality and these games. As the regression process requires a
form were derived by developing separate measures ‘Home’ and ‘Away’ team, when playing at neutral
for both teams and then subtracting the away team venue, the team with the most experience at the
values from the home team values. This effectively venue was assigned to be the ‘Home’ team. If all
references the final result in term of the home team. matches played at neutral venues were devoid of HA
Indicator variables were created to identify matches then the binomial variable for a neutral venue would
played at a neutral venue and matches where the two be the exact negative of the intercept term. This was
competing teams were clearly from different class not the quite the case, with the neutral variable
structures (established nation versus developing equivalent to about eight runs, suggesting a HA in
nation). neutral matches equivalent to about six runs. This
From Table 2 it can be seen that the results of six run difference could be thought of as a surrogate
ODI matches are becoming more predictable, with marker for the difference in familiarity between the
the updated model explaining 3.5% more of the competing teams.
Table 2. Multivariate models for MOV constructed with 1800 & 2200 ODI matches.
Bailey model (n = 1800) Updated Model (n = 2200)
Variable Estimate P-value Partial R2 Estimate P-value Partial R2
Intercept / HA 13.4 ± 1.9Predicting ODI’s while in progress 483
20.0
17.5
P
15.0
e
r 12.5
c
e 10.0
n
t 7.5
5.0
2.5
0
0 25 50 75 100 125 150 175 200 225 250 275 300 325 350 375 400 425
First innings total
Figure 2. Histogram of first inning scores in 2200 matches played prior to Jan 2005.
The difference in quality, as measured by the once again incorporated to determine a projected
difference in averages between the two teams for all total.
past matches, was by far the strongest predictor, Using past averages and exponential
explaining 20.7% of the variation in the updated smoothing, prediction variables relating to past
model. The best measure of current form was the performance were created. Using a multiple linear
difference in averages for the past 10 matches, regression, a six variable model was constructed.
whilst the difference in overall experience (games The resulting parameter values are given in Table 3.
played by the country) between the home and away Interestingly, when using a stepwise selection
team was also statistically significant. Whilst no procedure, the strongest predictor of the total scored
statistically significant difference could be found in by the team batting first was in fact the average of
parameter estimates, the difference in class (when a the past MOV between the two teams. The next
developing cricket nation played host to an strongest predictors in the model were derived from
established cricket nation) declined (29.6 runs vs. the past first innings scores achieved by the batting
25.1 runs) as developing nations gain more team as well as scores conceded by the bowling
experience. Similarly, the effect of HA rose slightly team. HA was the next predictor of importance, with
(13.4 runs vs. 13.9 runs) with more data, while the a team playing in it home country scoring an
effect of a neutral venue was slightly lower (8.6 runs additional 15 runs. A second surrogate marker for
vs. 8.2 runs). Not surprisingly, all variables in the the quality of the batting team was given by the
model achieved a higher level of statistical average past MOV for the batting team. The final
significant when additional data were used. variable that was found to be highly statistically
significant (p = 0.0004) was derived from all past
Prediction model for team totals first innings played at the venue. This helped
Figure 2 it shows that the total of the team batting account for pitch conditions and venue size.
first can be well approximated by a normal Whilst over 23% of the variation in MOV
distribution (mean = 229.7, SD = ± 1.2). When the could be explained by the multivariate model, the
score of the team batting first was shortened due to total of the team batting first was not as predictable,
rain, (about 13% of matches), the DL method was with an R-square statistic of 19.1%.
Table 3. Multivariate model predicting the total of the team batting first.
Variable Estimate P-value Partial R2
Ave. MOV against opposition .13 ± .04484 Bailey and Clarke
First Inning Second Inning
50
40
AA E(runs)
30
20
10
0
1 4 7 10 13 16 19 22 25 28 31 34 37 40 43 46 49
Overs
Figure 3. AAE for difference between predicted and actual total.
Using a holdout sample of 100 completed Figure 3 that the accuracy with which the total of the
matches played in the year 2005, the regression batting team can be predicted, progressively
model successfully predicted the winning team 71% improves throughout the course of the innings, with
of the time and had an Absolute Average Error first innings totals significantly more accurate that
(AAE) between the predicted and actual margin of those of the second innings.
55.8 ± 4.1 runs. These results compare favourably By subtracting the pre-match predicted total
against the original prediction model of (Bailey, from the updated prediction of the total, a
2005), who accurately identified the winning team performance indicator can be derived for whether
69.6% of the time, and had an AAE of 54.6 ± 0.9 each batting team is performing above or below
runs for a sample of 336 matches played between expectation.
2002 and 2004.
Using the same holdout sample of 100 Performance indicator = (updated total) –
matches, the AAE for the difference between the (pre-match predicted total) (4)
predicted and actual totals of the team batting first
was 42.5 ± 3.2 runs. By referencing the MOV in With the use the performance indicator, an
terms of the team batting first rather than the home updated prediction for the MOV can then be readily
team, a predicted total for the team batting second obtained
can be given by
Updated MOV = (Pre-match MOV) +
Predicted Total2 = (Predicted Total1) + (Performance indicators) (5)
(Predicted MOVordered) (2)
From Figure 4 it can be seen that during the
From the chosen holdout sample of 100 course of the first innings, the AAE for the
matches, the AAE for the difference between the difference between the predicted and actual MOV
predicted and actual totals of the team batting reduces by about 10 runs. In the second innings the
second was 47.1 ± 4.0 runs. reduction in AAE is much greater as the game draws
nearer to its conclusion.
RESULTS As shown by (Bailey, 2005), by dividing the
predicted MOV by its standard error and comparing
With the use of the D-L method to convert available with a standard Normal distribution, the approximate
resources into runs, at the completion of each over, probability that either side will win the match can be
an updated total for the team batting first is readily calculated.
calculated by combining the actual total with the Example: On December 7 2005, Australia
predicted total for the remainder of the innings. played New Zealand in a day/night match at
Westpac Stadium in Wellington. After winning the
Updated Total = (existing score) + (projected total toss and electing to bat Australia proceeded to score
for remaining resources) (3) a very respectable total of 322. The betting exchange
Betfair fielded a betting market for this match,
Using complete over by over information for with just over $1,000,000 AUD of matched bets
the 100 match holdout sample, it can be seen from occurring before the start of the game. As betting onPredicting ODI’s while in progress 485
First Innings Second Innings
60
50
40
AAE (runs
30
20
10
0
1 4 7 10 13 16 19 22 25 28 31 34 37 40 43 46 49
Ove rs
Figure 4. AAE for the difference between the predicted and actual MOV.
this match remains open for the duration of the batting, the predicted probability for Australia to win
game, by the completion of the Australian innings, was consistently below the market probability, with
just over $4,000,000 AUD of matched bets had only one inefficiency occurring throughout the
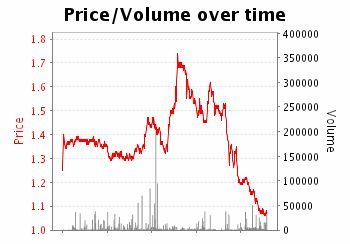
been placed. Figure 5 shows both the volume of bets course of the Australian innings.
placed and the price matched. From Figure 5 it can Chasing 323 runs to win the match, New Zealand
be seen that the opening price for Australia was started slowly. With some big hitting towards the
about $1.38, with the price dropping to $1.30 after end of the innings, the black caps clawed their way
Australia won the toss. After losing 3 early wickets, into contention and started the final over as
the price drifted out to $1.70, but as Australia favourites, only requiring six runs to win.
rallied, the price continued to drop and by the Unfortunately, two wickets falling in the final over
completion on the 50th over, the best price available gave victory to Australia by 2 runs. Figure 7 shows
for Australia to win was $1.08. that several inefficiencies were present in the betting
Using prediction models for the team total and market with the predicted probability of success
MOV, the predicted probability for Australia to win often exceeding the market price. By the completion
was calculated both before and during the match, of the 100th over, more than $9,000,000 AUD had
and compared with the market price offered by been wagered on the outcome of the match.
Betfair (market probabilities included 5% for
commission ). Where the predicted probability can DISCUSSION
be seen to exceed the market probability, the ‘in
play’ market can be thought to be inefficient. From In July 2005 the International Cricket Council (ICC)
Figure 6 it can be seen that while Australia was announced a new set of rules to be applicable to ODI
Figure 5. Betfair volume and price for Australia vs. New Zealand ODI 2302 (pre match until end over 50).486 Bailey and Clarke
P re d ic te d M a rke t
100%
75%
P robabilit
50%
25%
1 4 7 10 13 16 19 22 25 28 31 34 37 40 43 46 49
O vers
Figure 6. Predicted probability and market price for Australia to win against New
Zealand ODI 2302 (pre match until end over 50).
matches. An increase in fielding restrictions and the In Australia, federal laws prevent Australian
introduction of a substitute player (super-sub), citizens from placing bets over the internet after a
significantly increased the total achieved by the team sporting event has commenced. Paradoxically,
batting first by more than 20 runs. (252.7 ± 8.0 vs. Australian citizen can place bets ‘in the run’
229.7 ± 1.2 p = 0.002). As these changes occurred provided the bets are placed over the phone. This
within the holdout sample of the data used, it is inconvenience causes a greater delay between
unsure how these modifications would impact upon observing an inefficient price and actually placing a
the prediction process. bet.
Whilst the price and volume of bets traded are
available through Betfair (see Figure 5), this CONCLUSIONS
information is not time coded by over, ensuring that
if the efficiency of the market is to be accurately Multiple linear regression provides a useful way to
determined, information must be gathered manually assign the winning probabilities to the competing
at the completion of each over. This would teams in ODI matches. With the use of D-L
undoubtedly prove time consuming should a approach, this process can be readily modified to
definitive appraisal of the market inefficiency be produce ‘in the run’ predictions. Whilst a definitive
required. analysis of the efficiency of the betting market is yet
Predicted Market
100%
75%
Probability
50%
25%
51
67
83
89
53
55
57
59
61
63
65
69
71
73
75
77
79
81
85
87
91
93
95
97
99
Overs
Figure 7. Predicted probability and market price for Australia to win against New Zealand
ODI 2302 while New Zealand batted (overs 51-100).Predicting ODI’s while in progress 487
to be conducted, preliminary evidence suggest AUTHORS BIOGRAPHY
punters may be prone to over or under estimate the Michael J. BAILEY
true probability of the competing teams as the game Employment
progresses. Statistician, Department of Epidemiology & Preventive
Medicine, Monash University, Australia.
Degrees
REFERENCES PhD, MSc (Statistics), BSc(Hons).
Research interests
Bailey M., (2005) Predicting sporting outcomes: A Health, sport, gambling.
statistical approach: PhD thesis, Swinburne E-mail: Michael.Bailey@med.monash.edu.au
University, Melbourne. 212. Stephen R. CLARKE
de Silva, B., Pond, G. and Swartz, T. (2001) Estimation of Employment
the magnitude of victory in one-day cricket. Professor, Swinburne University of Technology,
Australian & New Zealand Journal of Statistics, Australia.
43, 259-268. Degrees
Duckworth, F. and Lewis, T. (1999) Your comprehensive PhD, M.A., B.Sc(Hons), Dip Ed..
guide to the Duckworth/Lewis method for Resetting Research interests
targets in one-day cricket, University of the West Modelling in sport, gambling.
of England. E-mail: sclarke@swin.edu.au
Michael J. Bailey
KEY POINTS Department of Epidemiology & Preventive Medicine,
Monash University, Australia.
• In excess of 80% of monies wagered on the
outcome of ODI matches are placed after the
match has commenced.
• Using all past data from ODI matches, multiple
linear regression models are constructed to
predict team totals and margin of victory.
• By combining match information with
prediction models, an ‘in the run’ prediction
process is created for ODI matches.You can also read