Fact-checking the Trump administrationʼs immigration fact sheet
←
→
Page content transcription
If your browser does not render page correctly, please read the page content below
Fact-checking the Trump administrationʼs immigration fact sheet - The Washington Post                                                   5/10/19, 1(25 PM

       Fact-checking the Trump
       administrationʼs immigration fact
       sheet
       Salvador Rizzo

       A person looks through the border wall toward the United States in San Diego. (Mike
       Blake/Reuters)

       When we see politicians or government officials writing fact checks of their
       own, we break out our magnifying glass.

       Today, weʼre inspecting a new “myths vs. facts” document from the
       Executive Office for Immigration Review (EOIR), the arm of the Justice

https://www.washingtonpost.com/politics/2019/05/10/fact-checking-trump-administrations-immigration-fact-sheet/?utm_term=.a3f3cb10a4fa       Page 1 of 13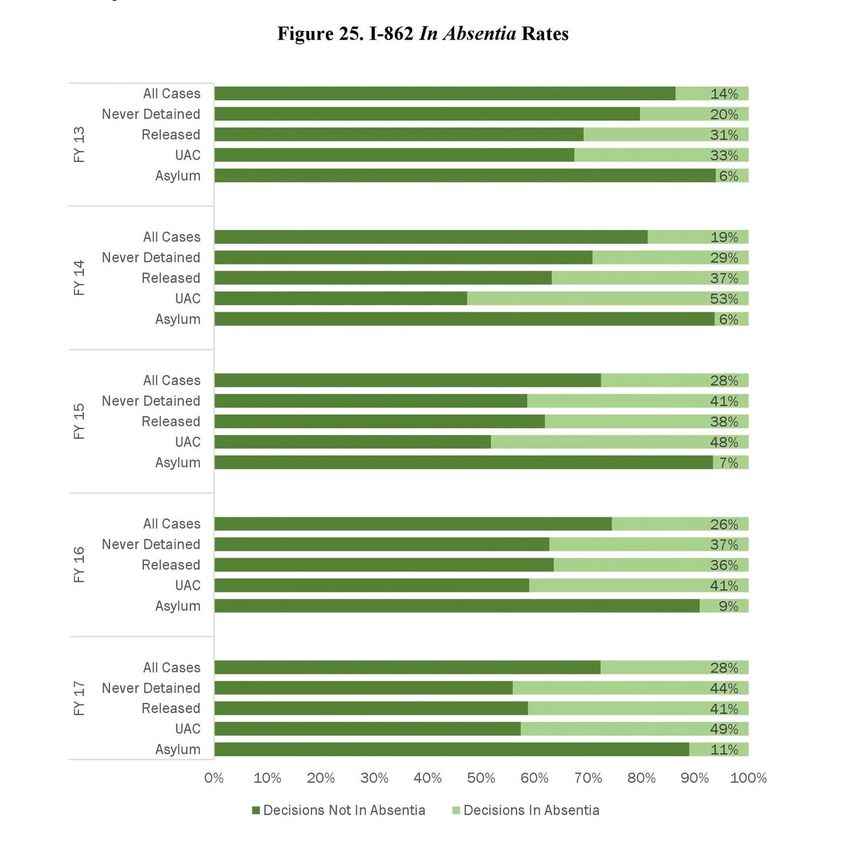
Fact-checking the Trump administrationʼs immigration fact sheet - The Washington Post                                                   5/10/19, 1(25 PM

       Department that runs the U.S. immigration court system.

       The Facts

       The five-page document, released this month, attempts to debunk 18
       claims about immigration to the United States.

       In some cases, it seems more as though EOIR officials are misusing the
       fact-checking format to make a point about issues that no one is
       mischaracterizing. For example, one of the supposed myths is that
       immigration judges and the attorney general “are prosecutors.” Weʼre not
       aware of any group, expert or journalist spreading this notion (and the
       attorney general is a prosecutor, despite his concurrent role as head of the
       immigration courts).

       In other cases, EOIR officials dispute common claims about immigration
       with cherry-picked data or questionable information. This is what we
       focused on, picking out four of the 18 claims.

            MYTH: There is wide discrepancy in asylum grant rates across all
            immigration courts.

            FACT: The median asylum grant rate for all immigration courts is eleven
            percent (11%). Eighty percent (80%) of immigration courts, 50 out of 62,
            have a grant rate of twenty-one percent (21%) or lower. Only 12 out of 62
            courts have grant rates more than ten percent (10%) above the median
            grant rate. Only 1 out of 62 courts has a grant rate above fifty percent
            (50%).

       Itʼs no myth that the rate of granting asylum varies widely by judge and by
       location.

https://www.washingtonpost.com/politics/2019/05/10/fact-checking-trump-administrations-immigration-fact-sheet/?utm_term=.a3f3cb10a4fa       Page 2 of 13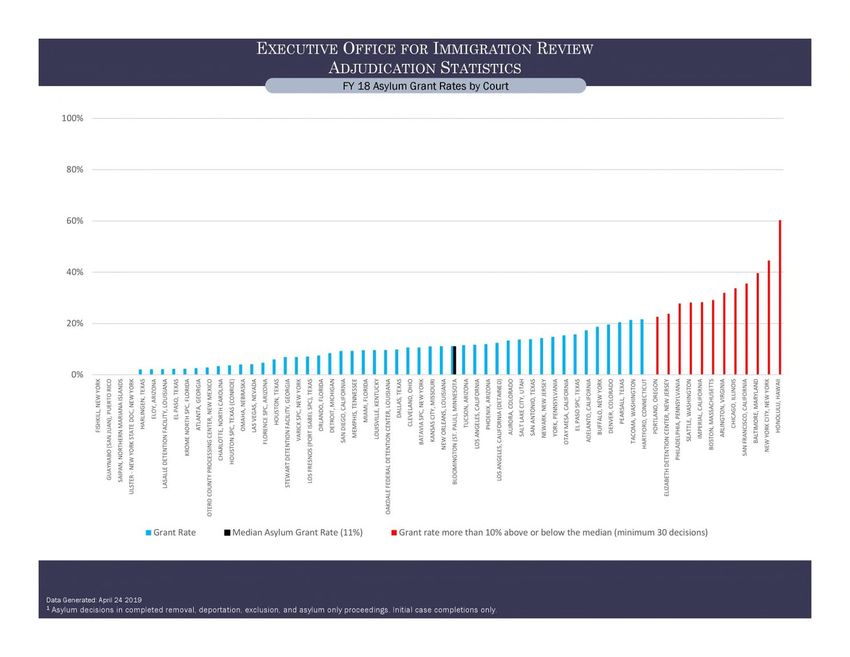
Fact-checking the Trump administrationʼs immigration fact sheet - The Washington Post                                                   5/10/19, 1(25 PM

       In a detailed data analysis of immigration judges who decided more than
       100 asylum cases from fiscal 2012 through 2017, the nonpartisan TRAC
       research center found that, out of the 35 immigration judges in New York,
       the one with the lowest denial rate (3 percent) and the highest (58.5
       percent) were still far apart from their peers in Los Angeles. In that city, the
       34 immigration judges ranged from a denial rate of 29.4 percent to 97.5
       percent.

       Those are two of the biggest immigration courts by case load, but these
       discrepancies also pop up in other parts of the country, as the EOIR chart
       below shows.

       (Executive Office for Immigration Review)

https://www.washingtonpost.com/politics/2019/05/10/fact-checking-trump-administrations-immigration-fact-sheet/?utm_term=.a3f3cb10a4fa      Page 3 of 13
Fact-checking the Trump administrationʼs immigration fact sheet - The Washington Post 5/10/19, 1(25 PM
The median grant rate for asylum claims was 11 percent in fiscal 2018.
Some localities were lower (Atlanta, El Paso, Las Vegas). The cities
represented by red bars (Baltimore, Boston, Chicago, New York) were much
higher than the median. Honolulu was above 60 percent — five times the
median rate.
“Eighty percent of immigration courts are clustered within 10 percent of the
median grant rate,” said EOIR spokeswoman Kathryn Mattingly. “Although
12 courts are outliers, EOIR does not consider 12 out of 62 to reflect a wide
discrepancy.”
MYTH: Few aliens fail to attend their immigration court proceedings.
FACT: Forty-four percent (44%) of all non-detained removal cases end
with an in absentia order of removal due to an alienʼs failure to attend a
scheduled immigration court hearing.
Immigration judges typically issue deportation orders “in absentia” when
immigrants fail to show up for their scheduled hearings.
At first glance, this seems like a case of cherry-picking data. The EOIR
document focuses on in absentia orders for 44 percent of “non-detained
removal cases.” Thatʼs one of several categories tracked by immigration
officials. The numbers look different when measuring asylum cases alone or
when combining all the different categories.
Judges ordered in absentia removals in 14 percent of all cases in fiscal
2013, a rate that grew to 28 percent in fiscal 2017. Looking at asylum cases
alone, the rate was 6 percent in 2013 and 11 percent in 2017. That means
the vast majority of asylum applicants did show up.
https://www.washingtonpost.com/politics/2019/05/10/fact-checking-trump-administrations-immigration-fact-sheet/?utm_term=.a3f3cb10a4fa Page 4 of 13Fact-checking the Trump administrationʼs immigration fact sheet - The Washington Post 5/10/19, 1(25 PM
(Executive Office for Immigration Review)
Asked why EOIR officials focused on non-detained cases, Mattingly said the
asylum category includes some immigrants who are in custody and unable
to skip their hearings, though she did not break down what share of the
total they represent. Mattingly did not address the “all cases” category in
her response.
https://www.washingtonpost.com/politics/2019/05/10/fact-checking-trump-administrations-immigration-fact-sheet/?utm_term=.a3f3cb10a4fa Page 5 of 13Fact-checking the Trump administrationʼs immigration fact sheet - The Washington Post 5/10/19, 1(25 PM
“Only non-detained aliens are potentially subject to an in absentia order of
removal,” she wrote in an email responding to detailed questions. “By
definition, a detained alien generally would not be subject to an in absentia
removal order because the Department of Homeland Security is responsible
for ensuring all aliens in its custody attend hearings. Consequently,
including detained aliens in a measure of the in absentia rate would present
a misleading picture of how many aliens attend hearings.” (Yet this is what
EOIR does in its own statistics yearbook.)
This item in the EOIRʼs document nonetheless contradicts President
Trumpʼs repeated claim that immigrants “never show up” for their court
hearings.
After we published this fact check, a policy analyst at the American
Immigration Council, Aaron Reichlin-Melnick, pointed out another issue with
this EOIR claim.
The “in absentia” rates are not a fully accurate measure of immigrants who
fail to attend a scheduled hearing. Instead, these rates track “initial case
completions” in a given year.
In other words, some immigrants are appearing in court but — since there
are more than 850,000 backlogged cases — their hearings are
rescheduled. In that scenario, their court appearances would not be
factored into the in absentia rates.
“An example I often give to illustrate this is to imagine 10 people are
scheduled for court on a given day,” Reichlin-Melnick said. "Of that 10, one
person fails to appear, and his case is ‘completedʼ when the judge orders
him removed ‘in absentia.ʼ The other nine then appear in front of the judge,
who ‘completesʼ one other case and reschedules the remaining eight
people for another hearing.
https://www.washingtonpost.com/politics/2019/05/10/fact-checking-trump-administrations-immigration-fact-sheet/?utm_term=.a3f3cb10a4fa Page 6 of 13Fact-checking the Trump administrationʼs immigration fact sheet - The Washington Post 5/10/19, 1(25 PM
“For that day, despite just 10 percent of people missing court, 50 percent of
‘completionsʼ were for missing court. ... But when EOIR used this
measurement in their ‘Myths vs. Factsʼ document, they do not make this
clear, which falsely implies that almost half of non-detained immigrants
skipped out on court. When you look the governmentʼs data more precisely,
you see that the vast majority of immigrants appear for their court
hearings.”
MYTH: Most aliens with representation are granted asylum in
immigration proceedings.
FACT: The asylum grant rate for cases with representation is
approximately twenty-one percent (21%). The asylum denial rate for
cases with representation is approximately forty-eight percent (48%).
These rates are essentially the same as the national averages.
This portion of the EOIR document lacks necessary context, since it focuses
only on asylum grants for immigrants with lawyers. Missing is a side-by-side
comparison with immigrants who donʼt have lawyers.
In lieu of that comparison, the EOIR document says the grant rates for
lawyered-up immigrants “are essentially the same as the national averages.”
But the word “essentially” is being stretched beyond meaning.
“Having a lawyer makes a huge difference across the immigration court
system,” Reichlin-Melnick wrote in a Twitter thread analyzing the “myths vs.
facts” document.
The TRAC research center has a table comparing asylum applicants who
did and didnʼt have lawyers from fiscal 2012 through 2017. Overwhelmingly,
those with legal representation had a higher success rate.
https://www.washingtonpost.com/politics/2019/05/10/fact-checking-trump-administrations-immigration-fact-sheet/?utm_term=.a3f3cb10a4fa Page 7 of 13Fact-checking the Trump administrationʼs immigration fact sheet - The Washington Post 5/10/19, 1(25 PM
Asylum denial rates by nationality, fiscal years 2012-2017
20% 40% 60% 80%
China
Lawyer 18
No Lawyer 79
El Salvador
Lawyer 73
No Lawyer 96
Guatemala
Lawyer 68
No Lawyer 95
Honduras
Lawyer 70
No Lawyer 94.5
Mexico
Lawyer 82.5
No Lawyer 97
Source: TRAC THE WASHINGTON POST
Take the top five countries for asylum applications: China, El Salvador,
Guatemala, Honduras and Mexico. In each case, denial rates were
appreciably higher for asylum applicants without representation. Chinese
nationals were the biggest group of applicants. Those without lawyers were
denied asylum in 79 percent of cases, yet for those with lawyers, the rate
https://www.washingtonpost.com/politics/2019/05/10/fact-checking-trump-administrations-immigration-fact-sheet/?utm_term=.a3f3cb10a4fa Page 8 of 13Fact-checking the Trump administrationʼs immigration fact sheet - The Washington Post 5/10/19, 1(25 PM
was a fraction of that — 18 percent.
“Multiple sources have claimed that representation makes an alien more
likely to win an asylum case; however, the grant rate for represented asylum
cases mirrors the national average overall, and most asylum applications are
not granted regardless of representation,” Mattingly said.
MYTH: VTC [video-teleconference technology] is unreliable, and its use
violates due process.
FACT: VTC has been used by EOIR since the 1990s, and its use was
expressly authorized by statute in 1996. It is used widely throughout
many federal agencies, and federal courts have consistently rejected
general challenges to its use as a violation of due process. There is no
indication of a statistically significant difference in outcomes between
VTC cases and in-person cases. Less than one-tenth of one percent
(.0052%) of EOIR VTC hearings, 310 out of nearly 60,000, are continued
due to a VTC malfunction.
In support of this claim about holding hearings remotely via video-
teleconference, Justice Department officials tabulated data for cases
postponed due to technical difficulties (“less than one-tenth of one
percent”), though we note that the time period for this statistic is not
included in the “myths vs. facts” document.
Is that the right metric to assess reliability and fairness?
A 2017 report by the Government Accountability Office found that “EOIR
has not adopted the best practice of ensuring that its VTC program is
outcome-neutral because it has not evaluated what, if any, effects VTC has
on case outcomes.”
https://www.washingtonpost.com/politics/2019/05/10/fact-checking-trump-administrations-immigration-fact-sheet/?utm_term=.a3f3cb10a4fa Page 9 of 13Fact-checking the Trump administrationʼs immigration fact sheet - The Washington Post 5/10/19, 1(25 PM
The GAO also noted that a federal government manual for internal controls
(known as “the Green Book”) says “agencies must have relevant, reliable,
and timely information relating to internal as well as external events to
manage the agencyʼs operations. EOIR, though, does not collect reliable
data on (1) the number of hearings it conducts by VTC, (2) respondent
appeals related to the use of VTC in their cases, or (3) motions filed by
respondents requesting in-person instead of VTC hearings.”
The GAO report indicates that salient data points were missing in 2017, such
as the number of video-teleconference hearings conducted, the number of
appeals related to the use of this technology, and motions requesting in-
person hearings. Yet EOIR says “there is no indication of a statistically
significant difference in outcomes between VTC cases and in-person
cases.” Mattingly did not address whether anything had changed in the two
years since the GAO report.
“Case outcomes do not measure due process, as a respondent may receive
due process regardless of whether an application for relief is granted or
denied,” Mattingly said. “No court has held that the use of VTC by itself is a
due process violation.”
She added: “Regarding case outcomes, no study has demonstrated a
statistically significant difference in outcomes at agencies which use VTC
for hearings.”
Mattingly pointed to two research studies on video-teleconference
hearings, one focused on the Social Security Administration and the other a
2015 law review article about EOIRʼs system. Researcher Ingrid V. Eagly
found “there was no statistically significant evidence that judges
adjudicated deportation cases more harshly over a video screen.”
“Televideo cases were more likely to result in deportation, yet there was no
https://www.washingtonpost.com/politics/2019/05/10/fact-checking-trump-administrations-immigration-fact-sheet/?utm_term=.a3f3cb10a4fa Page 10 of 13Fact-checking the Trump administrationʼs immigration fact sheet - The Washington Post 5/10/19, 1(25 PM
statistically significant evidence that judges adjudicated deportation cases
more harshly over a video screen,” Eagly also wrote. “Instead, when
compared with similar detained in-person cases, detained televideo cases
exhibited depressed engagement with the adversarial process. Televideo
litigants were less likely to retain counsel, pursue an application for
permission to remain lawfully in the United States (known as relief), or seek
the right to return voluntarily (known as voluntary departure).”
The Pinocchio Test
We were on the fence between Two and Three Pinocchios. Taken
individually, each of the four claims we analyzed relies on a dubious read of
the data or tells only part of the story, which tips the scale toward Two
Pinocchios. The effect is more pernicious when considering all four claims
together, which is an argument for Three Pinocchios.
The Trump administrationʼs “myths vs. facts” document says itʼs wrong to
claim a wide disparity in outcomes depending on which immigration court
hears a case. But the data shows there is such a discrepancy. Compare
Houston with San Francisco, Atlanta with Chicago, Las Vegas with Boston
or El Paso with New York.
We donʼt see how the grant rate for asylum seekers with lawyers is
“essentially the same” as the national average, when the data
overwhelmingly shows a higher success rate for immigrants with lawyers,
compared with those who lack legal representation.
The other two claims are more defensible. It seems reasonable to focus on
non-detained cases rather than asylum cases when discussing in absentia
orders, since the asylum metric includes people in custody who have little
choice but to attend their hearings. However, EOIR should include a
https://www.washingtonpost.com/politics/2019/05/10/fact-checking-trump-administrations-immigration-fact-sheet/?utm_term=.a3f3cb10a4fa Page 11 of 13Fact-checking the Trump administrationʼs immigration fact sheet - The Washington Post 5/10/19, 1(25 PM
breakdown of detained asylum seekers in its reports if officials believe the in
absentia statistic for asylum cases by itself is misleading.
As for video-teleconference hearings, we note that the GAO report said that
“EOIR has not adopted the best practice of ensuring that its VTC program is
outcome-neutral because it has not evaluated what, if any, effects VTC has
on case outcomes.” But, on the other hand, a comprehensive and
independent study found “there was no statistically significant evidence
that judges adjudicated deportation cases more harshly over a video
screen.”
The overall effect is more “half the story” rather than “mostly false,” so Two
Pinocchios are in order.
Two Pinocchios
(About our rating scale)
Send us facts to check by filling out this form
Sign up for The Fact Checker weekly newsletter
The Fact Checker is a verified signatory to the International Fact-
Checking Network code of principles
Do you rate this claim as true or false? More Pinocchios for false, fewer based on your opinion of
the statement's truthfulness. (The check mark means you think the statement is true, not that you
agree with the rating.)
This is a non-scientific user poll. Results are not statistically valid and cannot be assumed to
reflect the views of Washington Post users as a group or the general population.
https://www.washingtonpost.com/politics/2019/05/10/fact-checking-trump-administrations-immigration-fact-sheet/?utm_term=.a3f3cb10a4fa Page 12 of 13Fact-checking the Trump administrationʼs immigration fact sheet - The Washington Post 5/10/19, 1(25 PM https://www.washingtonpost.com/politics/2019/05/10/fact-checking-trump-administrations-immigration-fact-sheet/?utm_term=.a3f3cb10a4fa Page 13 of 13
You can also read


