The 2020 Presidential Election: September Update - Wells Fargo
←
→
Page content transcription
If your browser does not render page correctly, please read the page content below
September 18, 2020

 Economics Group

Special Commentary
                                                                                                    Michael Pugliese, Economist
                                                                                   michael.d.pugliese@wellsfargo.com ● (212) 214-5058

The 2020 Presidential Election: September Update
Executive Summary
The race for control of the White House has tightened somewhat, as Joe Biden’s lead in most polling
averages has declined moderately from its summer highs. But, with roughly a six point lead
according to the Real Clear Politics (RCP) national polling average, Biden still appears to be in the
driver’s seat. As of this writing, PredictIt betting markets imply Joe Biden has roughly a 59% chance
of winning, while FiveThirtyEight’s model is more bullish on Biden, giving him a 76% chance of
winning. It is perhaps worth remembering that even if Biden has a 76% chance of winning, Trump’s
24% probability of winning the election is about the same odds as flipping a coin twice and getting
heads both times. While unlikely, that is far from a one-in-a-million event.
Of course, President Trump could chip away at Joe Biden’s lead in the remaining weeks of the
campaign. And furthermore, we do not believe President Trump needs to pull even in the national
vote to win the election. Indeed, he won the 2016 race while losing the national vote by about
three percentage points. In 2016, key swing states like Pennsylvania, Michigan, Wisconsin and
Florida voted roughly 3-4 points to the right of the nation, helping to swing the Electoral College to
Trump despite his popular vote loss.
As things stand today, a 2016-sized polling error in these key swing states would still yield a Biden
victory, holding the rest of the electoral map from 2016 constant and using the current RCP polling
average for each state. But the election is not being held today, and circumstances could change
significantly in the weeks ahead. As always, we will continue to keep our readers informed of the
latest developments, and in our next piece we will compare some of the key economic policy
proposals of the two major party candidates.
Biden Maintains the Lead, but Will It Hold Come Election Day?
In mid-July, we published a summer update on the state of the 2020 U.S. national election. At that
point in time, Democratic nominee Joe Biden had about a nine point lead in the RCP polling
average. In the key swing states of Wisconsin, Michigan, Pennsylvania and Florida, Biden’s lead
ranged from +5.2 in Florida to +7.5 in Michigan.
Fast forward to today and the race has narrowed somewhat. At present, Joe Biden’s lead in the RCP
national polling average is +5.9, a tightening of a few points relative to his summer highs (Figure 1).          The race for
At this point in 2016, the race was actually polling quite closely, with Hillary Clinton up just                 control of the
+1.5 on September 18 (Figure 2). We continue to be struck by the relative stability of 2020 polling.             White House
As can be seen in the two charts below, the 2016 race was marked by considerable swings over the                 has tightened
course of the year, oscillating between periods where Hillary Clinton polled well ahead of Donald                somewhat.
Trump and periods where the race appeared tied or Trump even had a small lead. Contrast that
with 2020, where Joe Biden has led pretty much the whole year by a decent margin.

 This report is available on wellsfargo.com/economics and on Bloomberg WFRE.
The 2020 Presidential Election: September Update WELLS FARGO SECURITIES
September 18, 2020 ECONOMICS GROUP
Figure 1 Figure 2
2020 General Election: Trump versus Biden 2016 General Election: Trump versus Clinton
Real Clear Politics Polling Average Real Clear Politics Polling Average
55% 55% 55% 55%
50% 50% 50% 50%
45% 45% 45% 45%
40% 40% 40% 40%
35% 35% 35% 35%
Joe Biden: Sep-18 @ 49.0% Hillary Clinton: Nov-08 @ 46.8%
Donald Trump: Sep-18 @ 43.1% Donald Trump: Nov-08 @ 43.6%
30% 30% 30% 30%
Jan-2020 Mar-2020 May-2020 Jul-2020 Sep-2020 Jan-2016 Mar-2016 May-2016 Jul-2016 Sep-2016 Nov-2016
Source: Real Clear Politics and Wells Fargo Securities
Of course, President Trump could chip away at Joe Biden’s lead in the remaining weeks of the
campaign. As we noted in our previous report, Donald Trump closed well in 2016, cutting Hillary
We do not Clinton’s national polling lead in half in the final weeks of the campaign. Exit polls also provided
believe Donald additional evidence that Trump won a majority of voters who decided in the final month of the race.
Trump needs to And furthermore, we do not believe Donald Trump needs to pull even in the national vote to win
pull even in the the election. Indeed, he won the 2016 race while losing the national vote by about three percentage
national vote to points, in line with the RCP polling average on Election Day. In 2016, swing states like
win the Pennsylvania, Michigan, Wisconsin and Florida voted roughly 3-4 points to the right of the nation
election. as a whole. Thus, if 2016 is any guide, Donald Trump could be within striking distance of a win even
if Biden is polling 3-4 points ahead at the national level.
Furthermore, although the polling at the national level proved to be fairly accurate in 2016, there
were some polling issues at the state level, particularly in Wisconsin and Michigan. These were two
states that were generally considered fringe swing states at best: prior to 2016 no Republican
presidential candidate had won Michigan since 1988, and a Republican candidate had not won
Wisconsin since 1984. This led us to ask a question: what if the key swing states see a polling error
about the size of the ones that occurred in 2016? What would that do the electoral map, holding
everything else equal?
Figure 3
How Might a 2016 Swing State Polling Error Influence the 2020 Race?
RCP 2016 Polling Average Actual 2016 Result Polling Error RCP Polling Average as of Sept. 18
Michigan Clinton +3.6 Trump +0.3 3.9 ppts Biden +4.8
Wisconsin Clinton +6.5 Trump +0.7 7.2 ppts Biden +6.7
Pennsylvania Clinton +2.1 Trump +0.7 2.8 ppts Biden + 4.3
Florida Trump +0.4 Trump +1.2 0.8 ppts Biden +1.6
Arizona Trump +4.0 Trump +3.5 -0.5 ppts Biden +5.0
Source: Real Clear Politics and Wells Fargo Securities
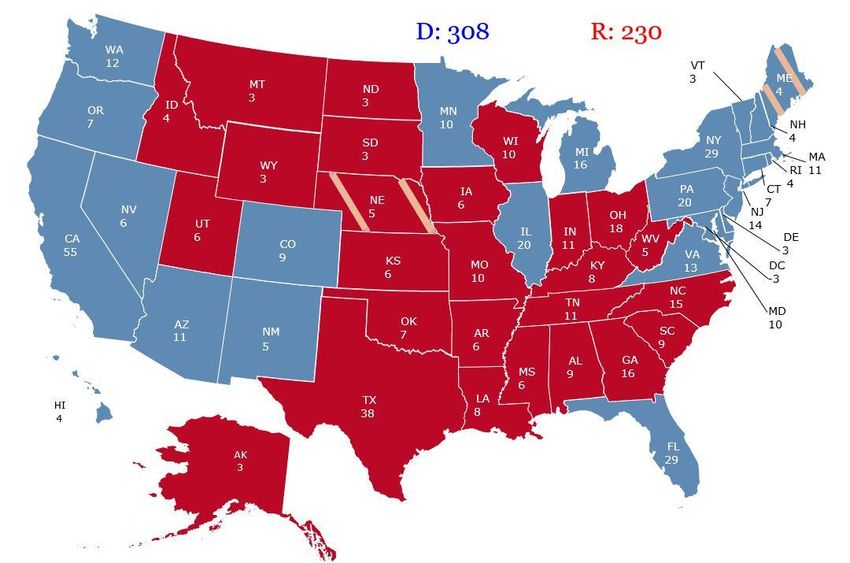
Figure 3 looks at the five states in the 2016 election that had the closest margins and were won by
Donald Trump. As can be seen in the third column, the polling errors seen in these five states varied
significantly. In Wisconsin and Michigan, the errors were fairly large at roughly seven and four
points, respectively. In contrast, the Florida polling was fairly accurate, and in Arizona Trump
actually slightly underperformed the polls. The far right column in Figure 3 shows the current RCP
polling average as of September 18. As things stand today, a 2016-sized polling error in each of
these five states would lead to Biden winning all but Wisconsin. Holding the rest of the electoral
map from 2016 constant, that would yield the hypothetical scenario seen below in Figure 4.
2The 2020 Presidential Election: September Update WELLS FARGO SECURITIES
September 18, 2020 ECONOMICS GROUP
Figure 4
Source: Wells Fargo Securities
While this should probably be considered encouraging news for Joe Biden, the race remains far
from a slam dunk for the challenger. Although we do not consider it especially likely, it is certainly
possible that state-level polling errors could be even bigger in 2020. Alternatively, and perhaps
more likely, the race could tighten a few more percentage points in the weeks ahead. A few more
points of tightening and a fairly normal sized polling error in some key states could very well put
Donald Trump on the road to another narrow victory. As of this writing, PredictIt betting markets
imply Joe Biden has a 59% chance of winning, while FiveThirtyEight’s model is more bullish on
Biden, giving him a 76% chance of winning. It is perhaps worth remembering that even if Biden has
a 76% chance of winning, Trump’s 24% probability of winning the election is about the same odds
as flipping a coin twice and getting heads both times. While unlikely, that is far from a one in a There is always
million event. the possibility
One final point we believe it is important to keep in mind is that polling errors can swing both ways. that the polling
In 2012, for instance, the race appeared quite close on election day, with the Real Clear Politics error could
national polling average showing President Obama up just +0.7 over Republican candidate Mitt swing back the
Romney. Many political analysts projected a fairly close race in both the popular vote and the other direction
Electoral College. President Obama went on to win fairly comfortably, winning the popular vote by and understate
about four percentage points and winning the Electoral College 332-206. We remind our readers Joe Biden’s
that there is always the possibility that the polling error could swing back the other direction and support.
understate Joe Biden’s support.
Congressional Outlook
What about the outlook for control of Congress? For a description of what each party needs to either
retain or capture the House/Senate, see our mid-July report. In short, the polling has improved a
bit for Republicans here too, though in an absolute sense it still remains fairly favorable for the
Democrats. In generic ballot polling, the Democrats had an +11 point lead at the time of our mid-
3The 2020 Presidential Election: September Update WELLS FARGO SECURITIES
September 18, 2020 ECONOMICS GROUP
July update according to the RCP polling average. At present, the spread is +5.7 points for
Democrats (Figure 5). This tightening makes some intuitive sense to us; the mid-July reading of
+11 signaled a more favorable environment than 2008, when Barack Obama won the presidency
with sizable majorities in both chambers of Congress. A spread of +5.7 is still much stronger for
Democrats than what the polls signaled in 2016, where Democrats had only a slight edge on
The generic Election Day in the generic ballot.
ballot polling
data are In our view, the generic ballot polling data are consistent with a race that has tightened moderately
consistent with since mid-July but that remains more favorable to Democrats than the 2016 environment. PredictIt
a race that has betting markets give the Democrats a 56% chance of taking the Senate and an 84% chance of
tightened keeping the House of Representatives. Political analyst Larry Sabato’s widely-followed Crystal Ball
moderately projections currently rate the Senate as 49-48 for the Republicans, with three states (North
since mid-July. Carolina, Maine and Iowa) considered toss-ups. Of course, the race for control of the House and
Senate, like the race for control of the White House, could change significantly in the weeks ahead.
Figure 5
U.S. Presidential Elections: The Generic Ballot
Real Clear Politics Average on Election Day, 2020 Data as of Sept. 18
14% 14%
Bars = Spread between R's and D's in generic ballot
12% 12%
Actual House
10% 10%
Result: D +10.7
8% 8%
6% 6%
Result: ???
Dems +9
4% 4%
Dems +5.7
Actual House
2% Actual House 2%
Result: R +1.1
Result: D +1.2
Dems +0.6
GOP +0.2
0% 0%
2008 2012 2016 2020
Source: Real Clear Politics and Wells Fargo Securities
4Wells Fargo Securities Economics Group
Jay H. Bryson, Ph.D. Chief Economist (704) 410-3274 jay.bryson@wellsfargo.com
Mark Vitner Senior Economist (704) 410-3277 mark.vitner@wellsfargo.com
Sam Bullard Senior Economist (704) 410-3280 sam.bullard@wellsfargo.com
Nick Bennenbroek International Economist (212) 214-5636 nicholas.bennenbroek@wellsfargo.com
Tim Quinlan Senior Economist (704) 410-3283 tim.quinlan@wellsfargo.com
Azhar Iqbal Econometrician (212) 214-2029 azhar.iqbal@wellsfargo.com
Sarah House Senior Economist (704) 410-3282 sarah.house@wellsfargo.com
Charlie Dougherty Economist (704) 410-6542 charles.dougherty@wellsfargo.com
Michael Pugliese Economist (212) 214-5058 michael.d.pugliese@wellsfargo.com
Brendan McKenna International Economist (212) 214-5637 brendan.mckenna@wellsfargo.com
Shannon Seery Economist (704) 410-1681 shannon.seery@wellsfargo.com
Jen Licis Economic Analyst (704) 410-1309 jennifer.licis@wellsfargo.com
Hop Mathews Economic Analyst (704) 383-5312 hop.mathews@wellsfargo.com
Nicole Cervi Economic Analyst (704) 410-3059 nicole.cervi@wellsfargo.com
Sara Cotsakis Economic Analyst (704) 410-1437 sara.cotsakis@wellsfargo.com
Coren Burton Administrative Assistant (704) 410-6010 coren.burton@wellsfargo.com
Wells Fargo Securities Economics Group publications are produced by Wells Fargo Securities, LLC, a U.S. broker-dealer registered with the
U.S. Securities and Exchange Commission, the Financial Industry Regulatory Authority, and the Securities Investor Protection Corp.
Wells Fargo Securities, LLC, distributes these publications directly and through subsidiaries including, but not limited to,
Wells Fargo & Company, Wells Fargo Bank N.A., Wells Fargo Clearing Services, LLC, Wells Fargo Securities International Limited,
Wells Fargo Securities Canada, Ltd., Wells Fargo Securities Asia Limited and Wells Fargo Securities (Japan) Co. Limited.
Wells Fargo Securities, LLC. is registered with the Commodities Futures Trading Commission as a futures commission merchant and is a
member in good standing of the National Futures Association. Wells Fargo Bank, N.A. is registered with the Commodities Futures Trading
Commission as a swap dealer and is a member in good standing of the National Futures Association. Wells Fargo Securities, LLC. and
Wells Fargo Bank, N.A. are generally engaged in the trading of futures and derivative products, any of which may be discussed within this
publication. Wells Fargo Securities, LLC does not compensate its research analysts based on specific investment banking transactions.
Wells Fargo Securities, LLC’s research analysts receive compensation that is based upon and impacted by the overall profitability and
revenue of the firm which includes, but is not limited to investment banking revenue. The information and opinions herein are for general
information use only. Wells Fargo Securities, LLC does not guarantee their accuracy or completeness, nor does Wells Fargo Securities, LLC
assume any liability for any loss that may result from the reliance by any person upon any such information or opinions. Such information
and opinions are subject to change without notice, are for general information only and are not intended as an offer or solicitation with
respect to the purchase or sales of any security or as personalized investment advice. Wells Fargo Securities, LLC is a separate legal entity
and distinct from affiliated banks and is a wholly owned subsidiary of Wells Fargo & Company © 2020 Wells Fargo Securities, LLC.
Important Information for Non-U.S. Recipients
For recipients in the EEA, this report is distributed by Wells Fargo Securities International Limited ("WFSIL"). WFSIL is a U.K. incorporated
investment firm authorized and regulated by the Financial Conduct Authority. For the purposes of Section 21 of the UK Financial Services
and Markets Act 2000 (“the Act”), the content of this report has been approved by WFSIL, an authorized person under the Act. WFSIL does
not deal with retail clients as defined in the Directive 2014/65/EU (“MiFID2”). The FCA rules made under the Financial Services and
Markets Act 2000 for the protection of retail clients will therefore not apply, nor will the Financial Services Compensation Scheme be
available. This report is not intended for, and should not be relied upon by, retail clients.
SECURITIES: NOT FDIC-INSURED/NOT BANK-GUARANTEED/MAY LOSE VALUEYou can also read