Why We Doubt Inflationary Dynamics Will Revert to What They Were Pre-Pandemic - JULY 15, 2021

Page created by Michelle Hansen
 
CONTINUE READING
Why We Doubt Inflationary Dynamics Will Revert to What They Were Pre-Pandemic - JULY 15, 2021
Why We Doubt Inflationary
Dynamics Will Revert to What
They Were Pre-Pandemic
JULY 15, 2021

GREG JENSEN
JASON ROTENBERG
NINA LOZINSKI

© 2021 Bridgewater Associates, LP
Why We Doubt Inflationary Dynamics Will Revert to What They Were Pre-Pandemic - JULY 15, 2021
W
           e think the 2020s are unlikely to be anything like the 2010s, and
           yet, that is what is discounted when we look at the combination
           of low rates and inflation. The big change, in our view, is that
policy makers are finding out how potent MP3 policies (aggressive fiscal
policy accommodated by printing) are and that in the US, these policies have
already transformed private sector balance sheets, changed the trajectory of
the economy, and made the economy less reliant on low rates.
When we look through history, we see that the common pattern across decades is for big reversals. There
are logical reasons for this, as excesses lead to extrapolation and busts, and vice versa. Policy makers also
learn from their recent experience and/or are forced to react to intolerable conditions, and policy mistakes (in
retrospect) are more likely to be in the opposite direction than the same one. The 2010s were a deleveraging
deflationary decade when fiscal policy was tightened too fast, and central banks learned multiple times through
trial and error that tightening wasn’t yet possible. The economy was already looking different by the end of the
last decade, and then the pandemic and, more importantly, the policy responses to it put these changes into
hyperdrive. And we see the odds of an overshoot as being significantly higher than those of an undershoot. The
table and charts below put into context the profound shift that has occurred in the underlying forces governing
inflation. They show: a massive transformation in both sides of the household balance sheet (record-high
wealth and very low debt service), more widely shared prosperity, the tightest labor market in decades, higher
inflation (even excluding base effects), and the easiest monetary and fiscal policy ever, let alone into a booming
economy. By comparison, interest rate markets are lagging the changes that we think are occurring, and setting
up some of the best trades we’ve seen in a long time.

                                         2010s Avg   Start of 2020   Today   Today vs 2020

 Inflation
   12m Core Inflation*
 Policy
   Nominal Short Rate
   US QE (%GDP)
   US Fiscal Support to Economy (%GDP)
 Pricing
   Nominal Long Rate
   Real Long Rate
   BEI
 Household Financial Conditions
   Household Net Wealth (%GDP)
   Net Worth of HHs in Bottom
   60% by Income (%GDP)
   Savings Rate
   Household Debt Service (%GDP)
 Labor Market
   Unemployment Rate
   Job Opening Rate (JOLTS)

   Voluntary Quit Rate (JOLTS)

   Avg Hourly Earnings (Y/Y)

© 2021 Bridgewater Associates, LP                                                                                1
Interest Rate Markets Are Discounting a Return to Normal
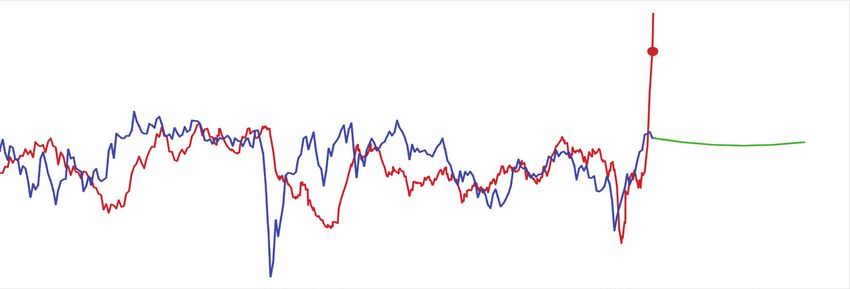
Despite what we see as fundamentally changed conditions, interest rate markets seem to be looking through
current inflation, and pricing in very little chance of an overshoot. Core inflation, even excluding base effects,
is already the highest it has been in decades. Yet breakeven inflation is priced to remain at levels similar to
those seen over the last decade and well below current inflation rates.

                                                      Breakeven Inflation vs Inflation
                                     BEI         Discounted BEI             12m Core Inflation      ex-Base Effect

                                                                                                                                    4.5%

                                                                                                                                    4.0%

                                                                                                                                    3.5%

                                                                                                                                    3.0%

                                                                                                                                    2.5%

                                                                                                                                    2.0%

                                                                                                                                    1.5%

                                                                                                                                    1.0%

                                                                                                                                    0.5%

                                                                                                                                    0.0%
2000                  2005                   2010                    2015                        2020                 2025

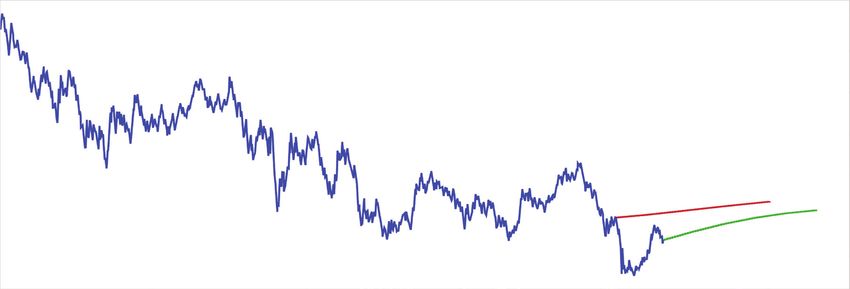
Similarly, long rates are not priced to return to pre-pandemic levels for years.

                                                Nominal Long Rate with Discounted Path
                                    Nominal Long Rate           Discounted Jan 2020                Discounted Today

                                                                                                                                       7%

                                                                                                                                       6%

                                                                                                                                       5%

                                                                                                                                       4%

                                                                                                                                       3%

                                                                                                                                       2%

                                                                                                                                       1%

2000                  2005                     2010                     2015                        2020                     2025

Overall, interest rate markets appear to be discounting a return to normal at the same time as underlying
conditions have fundamentally changed, setting up some of the best trades we’ve seen in a long time. On top of
that, rising interest rates are probably the biggest risk we see to most assets, so to us, a short treasury position
has a high expected return and can probably hedge the biggest risk in financial markets today, which is that
policy makers end up being limited by inflation/currency risk.
For more perspective on this pricing, below we walk through how radically different conditions are relative to
what they were prior to the pandemic.

© 2021 Bridgewater Associates, LP                                                                                                           2
Monetary and Fiscal Policy Is Extremely Stimulative
As a result of the shift to the MP3 paradigm of near-zero interest rates and coordinated monetary and fiscal
policy, the US economy now faces extremely stimulative policy relative to conditions. Short-term interest rates
are near zero and priced to not change much for years. Long-term interest rates have fallen to lows, especially
in real terms. This pricing is discounted to be much weaker than what had been priced in prior to the pandemic
and does not reflect the huge underlying improvement that we are seeing across the economy.

                                                              Jan 2020     Today
             Nominal Short Rate            Discounted Today
             Discounted Jan 2020                                                     Nominal Long Rate               Real Long Rate
                                                                                                                                      8%
                                                                                                                                      7%
                                                              6%
                                                                                                                                      6%
                                                              5%                                                                      5%

                                                              4%                                                                      4%
                                                                                                                                      3%
                                                              3%
                                                                                                                                      2%
                                                              2%                                                                      1%

                                                              1%                                                                      0%
                                                                                                                                      -1%
                                                              0%
                                                                                                                                      -2%
2000       2005       2010          2015       2020                      2000      2005         2010          2015         2020

Moreover, the US has entered an era of MP3 policy, which we expect to stay with us. Even with the economy
recovering, the government is running historically large peacetime deficits, funded by QE that is roughly on
par with the peak levels in the 2010s. Looking ahead, we expect that we have turned a corner where each new
downturn will be met with further rounds of stimulus. The $4 trillion package of infrastructure and social
spending that is likely to be passed by Congress even as the economy rapidly recovers is an indication that the
attitude toward fiscal stimulus has evolved.

                                                              Jan 2020     Today
                             US QE Index                                                  US Fiscal Support to Economy (%GDP)
                                                              50%                                                                     14%

                                                                                                                                      12%
                                                              40%
                                                                                                                                      10%

                                                              30%                                                                     8%

                                                                                                                                      6%
                                                              20%                                                                     4%

                                                                                                                                      2%
                                                              10%
                                                                                                                                      0%

                                                              0%                                                                      -2%
2008           2012          2016              2020                      2008        2012              2016            2020

© 2021 Bridgewater Associates, LP                                                                                                           3
Policy Support Has Fueled Broad-Based Improvement in
Household Balance Sheets
This policy shift is already having a transformative effect on households’ ability to spend as well as tolerate
higher interest rates. In the last decade, the gains from QE (MP2) accrued mainly to wealthy asset holders, who
were marginally less likely to convert gains into spending. Today, the shift to fiscal stimulus means that the
gains are accruing to a much wider income distribution. As you can see in the chart below on the right, the net
worth of households in the bottom 60% is increasing at the fastest pace relative to incomes in recent history.

                                                                  Jan 2020     Today
                          Household Net Wealth (%GDP)                                   Net Worth of HHs in Bottom 60% by Income (%GDP)
                                                                  650%                                                                65%

                                                                  600%

                                                                                                                                      60%
                                                                  550%

                                                                  500%
                                                                                                                                      55%
                                                                  450%

                                                                  400%
                                                                                                                                      50%

                                                                  350%

                                                                  300%                                                                45%
1960    1970       1980      1990      2000        2010    2020              1970       1980    1990     2000      2010     2020

High savings rates today tell us that households have not yet gone back to normal spending behavior due
to a combination of having more cash thrown at them than they can spend quickly and lingering effects of
the pandemic. On the right below we show debt service, which had already fallen to low levels before the
pandemic due to both lower household debt levels and lower rates. As we get past the pandemic, we expect
that the combination of radically improved balance sheets, elevated savings rates, and accumulated cash will
unleash an inflationary wave of spending into the real economy.

                                                                  Jan 2020      Today
                                    Savings Rate                                                 Household Debt Service (%GDP)
                                                                  30%                                                                     11%

                                                                  25%
                                                                                                                                          10%
                                                                  20%

                                                                  15%                                                                     9%

                                                                  10%
                                                                                                                                          8%
                                                                  5%

                                                                  0%                                                                      7%
1980        1990            2000          2010            2020               1980        1990       2000        2010       2020

© 2021 Bridgewater Associates, LP                                                                                                               4
We Have the Tightest Labor Market in Decades
This wave of spending will hit labor markets that are already extremely tight, worsening the inflationary
challenge. Despite unemployment being at 5.9%, job openings are at multidecade highs, as is the percentage of
workers voluntarily quitting their jobs.
                                                      Jan 2020      Today
                         Unemployment Rate                                                 Job Opening Rate (JOLTS)
                                                                                           Voluntary Quit Rate (JOLTS)
 12%                                                  0%             7%                                                         3.5%

 10%                                                                 6%
                                                      10%                                                                       3.0%

  8%                                                                 5%
                                                      20%                                                                       2.5%
  6%                                                                 4%
                                                      30%                                                                       2.0%
  4%                                                                 3%

                                                      40%                                                                       1.5%
  2%                                                                 2%

  0%                                                  50%             1%                                                        1.0%
     1980      1990      2000       2010     2020                       2000                    2010                     2020

Early in the pandemic, the wage numbers were heavily distorted by lower-wage workers falling out of the
labor force. But increasingly, this labor market tightness is starting to lead employers to raise wages in order to
attract workers. A labor shortage with rising wages would present additional inflation risks.
                                                       Jan 2020     Today
                                                Annual Chg in Avg Hourly Earnings (Y/Y)
                                                                                              7%

                                                                                              6%

                                                                                              5%

                                                                                              4%

                                                                                              3%

                                                                                              2%

                                                                                              1%

                                                                                              0%
                                    1980      1990         2000        2010         2020

© 2021 Bridgewater Associates, LP                                                                                                      5
Commodity Prices Already Reflect Building Pressures
The rally across commodities over the last year both reflects and adds to these inflationary risks. On average,
commodities are up 35% since the beginning of 2020, relative to 5% for a broad commodity index throughout
the entire 2010s. The breadth of this year’s rally across commodity markets only underscores the fundamental
nature of inflationary pressures today. Prices of some commodities are still not as high as they were during the
Chinese boom in the years following China’s entry into the WTO, but they are all much higher than they were
in the last decade.

                                                          Jan 2020       Today
                    Oil Price                              Natural Gas Price                             Copper Price
                                      $160                                       $16                                          $12,000
                                      $140                                       $14
                                                                                                                              $10,000
                                      $120                                       $12
                                                                                                                              $8,000
                                      $100                                       $10
                                      $80                                        $8                                           $6,000
                                      $60                                        $6
                                                                                                                              $4,000
                                      $40                                        $4
                                                                                                                              $2,000
                                      $20                                        $2
                                      $0                                         $0                                           $0
00     05    10    15     20     25            00   05   10    15    20     25            00   05   10   15    20        25

                    Zinc Price                                Aluminum Price                              Nickle Price
                                      $3,500                                     $5,000                                       $60,000
                                                                                 $4,500
                                      $3,000                                                                                  $50,000
                                                                                 $4,000
                                                                                 $3,500                                       $40,000
                                      $2,500
                                                                                 $3,000
                                                                                                                              $30,000
                                                                                 $2,500
                                      $2,000
                                                                                 $2,000                                       $20,000
                                      $1,500                                     $1,500
                                                                                                                              $10,000
                                                                                 $1,000
                                      $1,000                                     $500                                         $0
00     05    10    15     20     25            00   05   10    15    20     25            00   05   10   15    20        25

© 2021 Bridgewater Associates, LP                                                                                                       6
This research paper is prepared by and is the property of Bridgewater Associates, LP and is circulated for informational and educational purposes
only. There is no consideration given to the specific investment needs, objectives or tolerances of any of the recipients. Additionally, Bridgewater’s
actual investment positions may, and often will, vary from its conclusions discussed herein based on any number of factors, such as client investment
restrictions, portfolio rebalancing and transactions costs, among others. Recipients should consult their own advisors, including tax advisors, before
making any investment decision. This report is not an offer to sell or the solicitation of an offer to buy the securities or other instruments mentioned.

Bridgewater research utilizes data and information from public, private and internal sources, including data from actual Bridgewater trades. Sources
include, the Australian Bureau of Statistics, Bloomberg Finance L.P., Capital Economics, CBRE, Inc., CEIC Data Company Ltd., Clarus Financial
Technology, Conference Board of Canada, Consensus Economics Inc., Corelogic, Inc., CoStar Realty Information, Inc., CreditSights, Inc., Credit
Market Analysis Ltd., Dealogic LLC, DTCC Data Repository (U.S.), LLC, Ecoanalitica, Energy Aspects, EPFR Global, Eurasia Group Ltd., European
Money Markets Institute – EMMI, Evercore, Factset Research Systems, Inc., The Financial Times Limited, GaveKal Research Ltd., Global Financial
Data, Inc., Harvard Business Review, Haver Analytics, Inc., The Investment Funds Institute of Canada, ICE Data Derivatives UK Limited, IHS Markit,
Impact-Cubed, Institutional Shareholder Services, Informa (EPFR), Investment Company Institute, International Energy Agency (IEA), Investment
Management Association, JP Morgan, Lipper Financial, Mergent, Inc., Metals Focus Ltd, Moody’s Analytics, Inc., MSCI, Inc., National Bureau of
Economic Research, Organisation for Economic Cooperation and Development (OCED), Pensions & Investments Research Center, Qontigo GmbH,
Quandl, Refinitiv RP Data Ltd, Rystad Energy, Inc., S&P Global Market Intelligence Inc., Sentix GmbH, Spears & Associates, Inc., State Street Bank
and Trust Company, Sustainalytics, Totem Macro, United Nations, US Department of Commerce, Verisk-Maplecroft, Vigeo-Eiris (V.E), Wind
Information(HK) Company, Wood Mackenzie Limited, World Bureau of Metal Statistics, and World Economic Forum. While we consider information
from external sources to be reliable, we do not assume responsibility for its accuracy.

The views expressed herein are solely those of Bridgewater as of the date of this report and are subject to change without notice. Bridgewater may
have a significant financial interest in one or more of the positions and/or securities or derivatives discussed. Those responsible for preparing this
report receive compensation based upon various factors, including, among other things, the quality of their work and firm revenues.

© 2021 Bridgewater Associates, LP                                                                                                                      7
You can also read