THE NEWBORN BLOOD SPOT SCREENING IN THE NETHERLANDS - RIVM
←
→
Page content transcription
If your browser does not render page correctly, please read the page content below
>
    THE NEWBORN BLOOD SPOT
    SCREENING IN THE NETHERLANDS
    MONITOR 2018

      The Newborn Blood Spot screening programme (NBS) was introduced in the Netherlands
      in 1974. The programme is coordinated by the Centre for Population Screening (CvB) of the
      National Institute for Public Health and the Environment (RIVM). The aim of the NBS is the
      early detection of certain serious congenital disorders in newborns. Children with these
      (rare) disorders benefit from early interventions such as medication or a diet, which can
      prevent or limit irreparable health damage.

      The national monitor with main results of the NBS is carried out annually by TNO at the
      request of the RIVM-CvB. The monitor enables insight into the functioning of all aspects
      of the NBS as well as insight into a possible need for extra measures to allow for an
      improvement in functioning of the screening program.
>   T H E N E W B O R N B LO O D S P OT S C R E E N I N G I N T H E N E T H E R L A N D S – M O N I TO R 2 01 8

    Parties involved in the realization of the NBS are presented in figure 1. The NBS is carried
    out by a youth health care worker, maternity nurse or midwife. When the baby is admitted to
    the hospital during the first week after birth, the newborn blood spot is collected by a hospi-
    tal health care worker.

                                                                           RIVM-DVP
                                    RIVM-CvB
                                                                            Regional
                                  National control                        coordination
                                                                          of execution

              Paediatrician                                                                 Maternity care
                                                                                               worker
           Responsible for the
              diagnosis and                                                              Provides information
           treatment of a child                                                           and leaflet during
                                                                                              pregnancy

                      Screening                                                   Local Council
                      laboratory                                                 Hands out leaflet
                   Analyses the blood                                             again at birth
                                                                                   registration
                                                         Screener                                                 Figure 1
                                                       Collects blood                                             Parties involved in the execution of the NBS
                                                     through heel prick

    SUMMARY
    • The results of most of the indicators matched the defined target or signal values and the
      results of most indicators are in line with the results of previous years.
    • NBS participation rate was 99.1% in 2018 (n=168,565) and is just above the target value
      of 99.0%. Participation has fallen by 0.3% since 2013. This is mainly explained by an
      increase in the number of objections by parents to participate in the NBS and because the
      NBS has been performed abroad more often.
    • 524 children were referred to a paediatrician (0.3%), of which at least 145 (28% of 524
      referred children and 0.086% of the total number of participants) had one of the target
      group diseases.
    • The timeliness target value of the 1st heelprick was not reached: 98.6% was carried
      out within 168 hours after birth against a target value of 99.0%. The percentage was also
      below 99% in the years 2011-2017 with the exception of 2013. 37% of the heelpricks was
      performed in the recommended period of 72-96 hours after birth.
    • The target values concerning the percentage of children who needed a repeat 1st heel-
      prick were reached for all conditions in 2018.
    • CH: The diagnostic data has not yet been delivered from 45% (n=112) of the 248 referred
      children. As a result, the CH and total detection rate, specificity and positive predictive
      value must be interpreted with caution.
    • In previous years, the number of children detected with CH through screening has always
      been more than 70. Only 26 were discovered in 2018. This is a low number, even after
      accounting for the missing diagnostic data of 45% of children referred for CH.
    • After exclusion for missing data, the total screening programme has a detection rate of
      0.86 cases with the target group disease per 1000 screened children in 2018, a positive
      predictive value of 40%, a sensitivity of 100% and a specificity of 99.87%. The detection
      rate is presumably higher, because many CH patients may still be unknown due to missing
      diagnostic data.
    • All conditions reached the target values in terms of specificity, sensitivity and positive
      predictive value.

                                                                                                                                                                 2
>   T H E N E W B O R N B LO O D S P OT S C R E E N I N G I N T H E N E T H E R L A N D S – M O N I TO R 2 01 8

    • The target values for timeliness of diagnostics (≥90%) were not achieved for CAH (77%),
      CH (85%), CF (77%) and metabolic diseases (76%) in 2018.
    • The number of parents who object to the storage of blood remnants for scientific research
      purposes rose slightly in 2018 to 6.2%. In 2013 this was 4.6%.
    • In 2018 screening costs per child (diagnostic costs excluded), were €99: they show a ris-
      ing trend mainly because of the indexation of the costs for blood collection and laboratory
      analysis.

    RECOMMENDATIONS
    New recommendations:
    • For CH it is important to find out why so many diagnostic data are (still) missing, and to
      complement these data.
    • The participation rate of the screening programme has declined slowly in the last years to
      just above the target value. It is advisable to ascertain why this decline has occurred.

    Existing recommendations that are still valid:
    • Continue or intensify measures to improve the timeliness of the 1st heelprick.
    • Gain more insight into the background of objections against the heelprick and objections
      against the use of blood remnants for scientific research.
    • Continued attention for timeliness and clarity of registration of diagnostic data.
    • Improvement of the timeliness of diagnostics in CAH, CH, CF and metabolic diseases.

    DATA SOURCES

    The screening data in this monitor originate from the Praeventis registration system of the
    RIVM. Diagnostic data originate from the NEORAH registration system of the NVK (the Dutch
    Society of Paediatrics) and the RIVM (http://www.neorah.nl).
    In previous years the diagnostic CH data was registered by TNO; from 2018, pediatricians
    register these diagnostic CH data in Neorah. The NEORAH data related to metabolic dis-
    eases have been retrieved from the Dutch Diagnosis Registration Metabolic Diseases
    (www.ddrmd.nl). Notifications of the Dutch Pediatric Surveillance System (NSCK) have been
    used to detect possible missed cases. This monitor concerns children who have been born
    in 2018 (Praeventis reference date: 22-3-2019, NEORAH: 4-7-2019 or later1).

    READING GUIDE

    This monitor differentiates between the 1st heelprick, a repeat 1st heelprick, a 2nd heelprick
    and a repeat 2nd heelprick.
    • 1st heelprick: the first heelprick that has been carried out.
    • Repeat 1st heelprick: the newborn blood spot collection that is repeated when insuffi-
      cient blood has been collected during the 1st heelprick in order to carry out the required
      laboratory analyses or when a child received a blood transfusion within 24 hrs before the
      heelprick was carried out. If a blood transfusion with erythrocytes has been carried out,
      the heelprick needs to be repeated after 91 days to exclude haemoglobinopathies (HbP).
    • 2nd heelprick: carried out if the 1st heelprick gives an inconclusive laboratory result.
    • Repeat 2nd heelprick: as in repeat 1st heelprick.

    In this monitor the colours green and red indicate whether the results meet the prior indicat-
    ed signal or target values.
    • The values which fall within the indicated limits, are indicated in green.
    • Values outside the formulated limits are indicated in red. If possible, actions can be taken
       to improve the results or to get the results to fall within the limits of the target value.
    • Signal or target values for trends do not exist. Trends which require vigilance are indicated
       in orange. Stable trends are indicated in green.

    1
      The reference date was 4-7-2019 for MZ, 17-7-2019 for CAH, 19-7-2019 for HbP, 1-8-2019 for CF and
    26-8-2019 for CH.

                                                                                                                  3
>   T H E N E W B O R N B LO O D S P OT S C R E E N I N G I N T H E N E T H E R L A N D S – M O N I TO R 2 01 8

    DIFFERENCE COMPARED TO PREVIOUS MONITORS

    As a result of a renewal in the analysis equipment and test kit, the cut-off limits for abormal
    TYR-1 screening results have been changed from SA≥1,20 µmol/l to SA≥0,90 µmol/l per
    1-1-2018.

    From 2018 onwards, the aim of CAH screening is to detect all patients with a classic form of
    CAH, so both the classic salt-wasting form and the classic non-salt-wasting form (simple-viri-
    lising). Previously, only children with a classic salt-wasting form belonged to the target group.

    An improved methodology for MSUD (XEvo MSMS and the Neobase 2-assay) was introduced
    on 1-1-2018, with immediate use of new cut-off limits of 340 µmol/l for valine en leucine
    (the official date of change of the cut-off limit is April 1st, 2019).

    WHICH CONDITIONS ARE INCLUDED IN THE SCREENING?

    • Congenital adrenal hyperplasia (CAH)
    • Cystic fibrosis (CF)
    • Congenital hypothyroidism (CH)
    • Hemoglobinopathies (HbP):
      - Sickle cell disease (SCD)
      - HbH-disease (HbH), a form of alpha-thalassemia
      - Beta-thalassemia major (bTM)
    • Metabolic diseases (MD):
      - 3-Methylcrotonyl-CoA carboxylase deficiency (3-MCC)1
      - Biotinidase deficiency (BIO)
      - Galactosemia (GAL)
      - Glutaric acidemia type 1 (GA-1)
      - HMG-CoA lyase deficiency (HMG)1
      - Isovaleric acidemia (IVA)
      - Maple syrup urine disease (MSUD)
      - Medium-chain acylCoA dehydrogenase deficiency (MCAD)
      - Multiple CoA carboxylase deficiency (MCD)1
      - Phenylketonuria (PKU)
      - Trifunctional Protein deficiency/ Long-chain hydroxyacyl-CoA dehydrogenase deficiency
        (TFP/LCHAD)
      - Tyrosinemia type 1 (TYR-1)
      - Very-long-chain acyl-CoA dehydrogenase deficiency (VLCAD)
      - Carnitine transporter (OCTN2) deficiency (OCTN2)2

    More information about these conditions can be found on the RIVM website:
    https://www.rivm.nl/Onderwerpen/H/Hielprik

    1
        These three conditions are reported altogether under one name: 3-MHM, since they have the same marker.
    2
        OCTN2-deficiency is not part of the NBS: it is considered an incidental finding.

                                                                                                                  4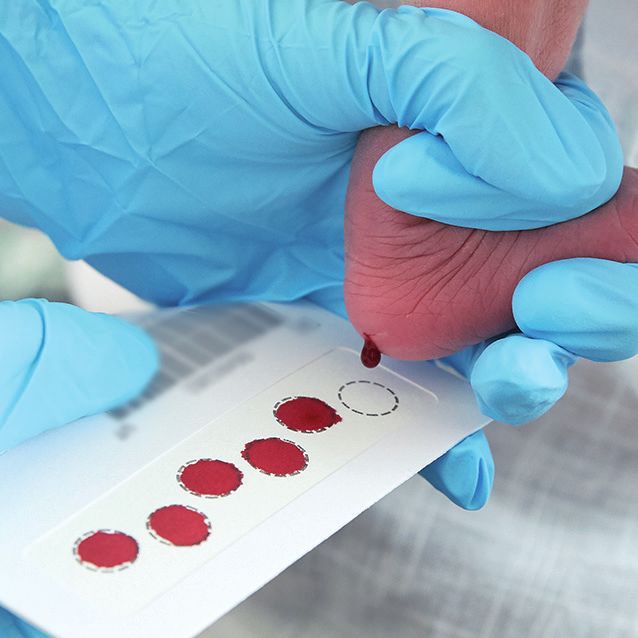
99,5

>    T H E N E W B O R N B LO O D S P OT S C R E E N I N G I N T H E N E T H E R L A N D S – M O N I TO R 2 01 8
          99,0

      0,898,5
     PARTICIPATION
          98,0
     In 2018 170,057 children were eligible to participate in the NBS. Newborn blood was collect-
                   2012        2013        2014          2015       2016        2017
     ed in 168,565 children. This means that the participation rate in 2018 is 99.1%, which is
                                              Geboortejaar
     just
       0,6higher than the target percentage of 99.0% (figure 2).

         100.0
                                                                                        Onbekend
        99.5                                                                            Vertrokken
    % 0,4

          99.0                                                                          Bezwaar
                                                                                                                   Figure 2
                                                                                        Onderzoek elders           Participation rate of the neonatal screening
        98.5                                                                                                       programme by year of birth (2013-2018); to
                                                                                        Totaal
      0,2                                                                                                          support readability the y-axis starts at 98%. The
        98.0                                                                                                       blue line indicates the target value
                   2013          2014          2015                2016     2017        2018
                                                   Year of birth

       0,0 2013 to 2018 a slight decrease from 99.4% to 99.1% is visible. Figure 3 shows that
     From
               2012       2013      2014       2015     2016       2017
     this is mainly explained by an increase in the number of objections by parents to partic-
                                      Geboortejaar
     ipate in the NBS (0.46% in 2018 versus 0.28% in 2013) and because the heelprick has
     been carried out more often abroad.

         1.0

         0.8

         0.6
                                                                                          Unknown

     %                                                                                    Left the country
                                                                                          Objection
         0.4                                                                              NBS abroad
                                                                                          Total

         0.2

                                                                                                                   Figure 3
                                                                                                                   Reasons for non-participation in the neonatal
                                                                                                                   screening programme by year of birth (2013-
         0.0                                                                                                       2018)
                 2013       2014        2015          2016           2017    2018
                                           Year of birth

                                                                                                                                                                   5
98
> %
T H E N E W B O R N B LO O D S P OT S C R E E N I N G I N T H E N E T H E R L A N D S – M O N I TO R 2 01 8
97
TIMELINESS
96 OF BLOOD COLLECTION
Timing of the NBS is crucial. The heelprick should be carried out within 168 hours (7 days)
after95birth, but ideally between 72 and 96 hours. In 2018 the percentage of 1st heelpricks
2012 168 hours
carried out within 2013 (7 days) 2014
after birth is 2015 2016 of at least
98.6%. The target 201799.0% was
Geboortejaar
therefore not reached. This was also the case in previous years with the exception of the year
2013 (figure 4). In 37% of children, newborn blood spots were collected in the recommended
period between 72-96 hours after birth.
100
99
98
%
976
Figure 4
Timeliness of the blood spot collection by year
5
of birth (2013-2018). Children born outside
96
4 the Netherlands are excluded (the blue line
indicates the target value; to support readability
% 3 the y-axis starts at 95%)
95
2 2013 2014 2015 2016 2017 2018
Year of birth
1
0
OBJECTIONS AGAINST STORAGE
2012 2013 OF2014
NEWBORN 2015
BLOOD 2016 2017
In 2018 6.2% of parents objected againstGeboortejaar
the storage of the NBS blood remnants for the
purpose of (anonymous) scientific research. This percentage shows a rising trend from 4.6%
in 2013 to 6.2% in 2018 (figure 5).
7
6
5
4
%
3
2 Figuur 5
Objection of parents against the storage of NBS
1 remnants for anonymous scientific research, by
0 year of birth (2013-2018)
2013 2014 2015 2016 2017 2018
Year of birth
6> T H E N E W B O R N B LO O D S P OT S C R E E N I N G I N T H E N E T H E R L A N D S – M O N I TO R 2 01 8
REPEAT FIRST HEELPRICK
Some of the blood spot collections needed to be repeated, for example because insufficient
blood was collected on the blood spot card. In 2018, the target values for all conditions were
achieved for the first time since 2014 (table 2).
Table 1
Repeat first heelpricks according to year of birth (2013-2018)
% of repeat Number in
2013 2014 2015 2016 2017 2018 Target value
1st heelpricks 2018
CAH 0.09 0.10 0.09 0.10 0.09 0.08 (137) ≤0.50
CH 0.29 0.38 0.56 0.55 0.503 0.42 (712) ≤0.50
CF 0.33 0.48 0.58 0.61 0.52 0.42 (702) ≤0.50
HbP 0.58 0.71 0.82 0.82 0.70 0.59 (992) ≤0.80
MD PKU 0.11 0.14 0.14 0.18 0.17 0.14 (229) ≤0.50
3-MHM 0.16 0.17 0.20 0.22 0.20 0.18 (304) ≤0.50
BIO 0.29 0.42 0.51 0.54 0.46 0.37 (623) ≤0.50
GAL 0.23 0.31 0.31 0.27 0.23 0.18 (308) ≤0.50
GA-1 0.16 0.17 0.20 0.22 0.20 0.18 (305) ≤0.50
IVA 0.16 0.17 0.20 0.22 0.20 0.18 (305) ≤0.50
MSUD 0.11 0.14 0.18 0.18 0.17 0.14 (229) ≤0.50
MCAD 0.16 0.17 0.20 0.22 0.20 0.18 (305) ≤0.50
TFP/LCHAD 0.16 0.17 0.20 0.22 0.20 0.18 (305) ≤0.50
TYR-1 0.11 0.14 0.18 0.18 0.17 0.14 (229) ≤0.50
VLCAD 0.14 0.17 0.20 0.22 0.20 0.18 (305) ≤0.50
OCTN2 0.11 0.14 0.18 0.18 0.17 0.14 (229) ≤0.50
SECOND HEELPRICK
In 2018 0.072% of the CAH results indicated the need for a 2nd heelprick. This means that
the target value for this indicator (≤0.090%) was reached (table 2).
In 2018 0.36% of the CH results indicated the need for a 2nd heelprick. The target value for
this indicator (≤0.50%) was also reached, just like last year.
Table 2
Second heelprick according to birth year (2013-2018)
Number in
2013 2014 2015 2016 2017 2018 Target value
2018
CAH % of 2nd heelpricks 0.096 0.070 0.079 0.078 0.065 0.072 (122) ≤0.09
CH % of 2nd heelpricks 0.55 0.74 0.82 0.53 0.21 0.36 (607) ≤0.50
7> T H E N E W B O R N B LO O D S P OT S C R E E N I N G I N T H E N E T H E R L A N D S – M O N I TO R 2 01 8
REFERRALS
In 2018 the NBS resulted in 524 referrals (table 3). This includes 18 referrals for the inciden-
tal finding OCTN21. This gives a referral rate of 0.31% of the total number of screened chil-
dren in 2018. This is, just like in 2017, a lower percentage when compared to previous years.
The referral rate for 3-MHM is high in 2018 compared to previous years. However, similar
fluctuations have been seen in the last ten years, so this outlier is probably due to chance.
The number of referrals for MSUD are low in 2018: in 2013-2017 6 to 20 children per year
were referred for MSUD, in 2018 only 3. This decrease might possibly be explained by the
introduction of an improved testing methodology.
Table 3
Referrals according to birth year (2013-2018)
Number in
% referrals 2013 2014 2015 2016 2017 2018 Trend
2018
CAH 0.024 0.014 0.015 0.015 0.016 0.016 (27) stable
CH 0.19 0.22 0.31 0.21 0.13 0.15 (248) fluctuates
CF 0.023 0.019 0.020 0.0261 0.016 0.021 (35) fluctuates
HbP 2
0.041 0.040 0.027 0.035 0.0236 0.0324 (54) stable
SCD 2
0.014 6
0.018 (31)
HbH2 0.005 0.007 (12)
bTM2 0.004 0.007 (11)
MD PKU 0.009 0.011 0.012 0.012 0.008 0.0105 (17) stable
3-MHM 0.003 0.004 0.004 0.003 0.005 0.009 7
(16) 2018 high
BIO 0.006 0.007 0.011 0.010 0.018 0.0137 (22) 2018 reduction
GAL 0.032 0.035 0.041 0.019 0.021 0.025 (42) reduction3
GA-1 0.002 0.001 0.001 0.001 0.001 0 7
(0) stable
IVA 0.001 0.002 0.001 0.004 0.002 0.002 7
(4) stable
MSUD 0.005 0.005 0.007 0.012 0.010 0.0025 (3) 2018 reduction
MCAD 0.013 0.012 0.011 0.012 0.011 0.012 7
(21) stable
TFP/LCHAD 0.001 0.001 0.001 0 0.001 0.001 (2) stable
TYR-1 0.001 0.001 0.002 0.002 0.002 0.001 (2) stable
VLCAD 0.009 0.003 0.011 0.005 0.011 0.008 (13) fluctuates
OCTN28 0.008 0.006 0.005 0.012 0.009 0.011 (18) fluctuates
Total referral rate 0.37 0.38 0.48 0.37 0.29 0.31 (524)
1
CF: Possibly due to change of reference values for CF per 1-7-2016.
2
HbP: Until and including 2016: Concerns HPLC patterns appropriate to sickle cell disease, and incidental findings of alpha-thalassemia
and beta-thalassemia. From 1-1-2017, HbH disease and beta-thalassemia major also belong to the target group diseases of screening
and are reported accordingly.
3
GAL: Possibly as a result of adapted reference values for GAL per 01-07-2015.
4
HbP: Excluding a child with an abnormal heelprick result that died before referral could take place.
5
PKU, MSUD: Excluding two children who were not referred, because they died shortly after the heelprick.
6
An error was made in the number of referrals for SCD in the 2017 monitor. A child appeared to be from Aruba and was wrongly included in
the report. The figures have been corrected in this monitor.
7
3-MHM, BIO, GA-I, IVA, MCAD: Excluding a child who was not referred, because he/she died shortly after the heelprick was carried out.
8
OCTN2: Is not part of the screening program, but is included in the calculation of the total referral rate.
1
OCTN2 is not a target disease of the screening programme but is an incidental finding. The level of C0 is
nevertheless determined in each child, because a possible deficiency makes the acylcarnitine profile unreli-
able, which may cause that children with the metabolic conditions MCAD, VLCAD, TFP/LCHAD, IVA, GA-I and
3-MHM remain undetected.
8> T H E N E W B O R N B LO O D S P OT S C R E E N I N G I N T H E N E T H E R L A N D S – M O N I TO R 2 01 8
DIAGNOSTIC RESULTS
In 2018, 506 children (excluding 18 referrals for OCTN2) were referred for a target condition
that is part of the screening program. In 145 (29%) cases one of the condition was confirmed
(table 4). This is lower than in 2017 (38%), which can largely explained by the fact that many
diagnostic data (45%, n=112) from CH were not delivered. The diagnostic outcomes of CH
and Total should therefore by interpreted with caution.
Children with a referral for OCTN2 deficiency (n=18, of which two are diagnosed with OCTN2)
are not included in these numbers, because this condition is not a target condition of the
screening program, but an incidental finding.
In 2018 one child with CAH was reported as missed. The result of the first heelprick of this
child was inconclusive. A second heelprick was not performed, because the child was already
in treatment for CAH before the first heelprick was carried out. The child is therefore not
considered as false-negative or missed.
Table 4
Diagnostic results of referred children born in 20181
False-
negative (test
Diagnosis
Diagnosis No target improperly Missed/
2018 Referred (still)
confirmed disease indicates other
unknown
no need for
referral
CAH 27 92 16 2 0 17
CH 248 26 102 1203 0 0
CF 4
35 24 4
9 2 0 0
HbP SCD 31 26 15 4 0 0
HbH 12 0 9 3 0 0
bTM 11 3 46 4 0 0
MD PKU 17 16 0 1 0 0
3-MHM 16 5 11 0 0 0
BIO 22 2 19 1 0 0
GAL 42 3 37 2 0 0
GA-1 0 0 0 0 0 0
IVA 4 4 0 0 0 0
MSUD 3 2 0 1 0 0
MCAD 21 19 2 0 0 0
TFP/LCHAD 2 0 2 0 0 0
TYR-1 2 0 2 0 0 0
VLCAD 13 6 5 2 0 0
Total 506 145 219 142 8
0 17
1
This table does not include 18 referrals for OCTN2-deficiency (n=18, two confirmed). Since 2018, both
the classic salt-wasting form and the classic non-salt-wasting form of CAH are considered as a target
condition.
2
CAH: All children have the classic salt-wasting form.
3
CH: For eight children the diagnosis is (still) unknown, and for 112 children (45%) the diagnostic data
are not registered in NEORAH.
4
CF: Including four children with meconium ileus.
5
SZ: Carrier of mild alpha-thalassemia.
6
bTM: Two children have a mild form of bèta-thalassemia (HBEE). One child has bèta-thalassemie inter-
media. One child is carrier of bTM. These four children do not belong to the target group of the screening.
7
Already under treatment for CAH (non-classical form) before the first heelprick was carried out.
8
Of which 112 children (referred for CH) have no reported diagnostic data. Among 30 children diagnostic
data were delivered, but diagnosis is (still) unknown.
9> T H E N E W B O R N B LO O D S P OT S C R E E N I N G I N T H E N E T H E R L A N D S – M O N I TO R 2 01 8
DETECTION RATES AND VALIDITY
Table 5 shows the detection rates (per 1000 screened children), the positive predictive value
(PPV), the sensitivity (Sens) and Specificity (Spec) of the programme.
The detection rates are comparable to that of previous years since 2013 (stable) in most
cases. The detection rate for every 1000 children screened for CH (0.154) is much lower
compared to 2014-2018 (0.388), which means that the total detection rate is also much low-
er (0.861 in 2018 and 1.04 in 2014-2018). This difference can largely be explained by the
fact that many diagnostic data for CH are missing in 2018 (45%, 112 children). As a result,
the total number of children with a abnormal blood spot for CH is unknown and the detection
rate is presumably higher. Based on the detection rate for CH in previous years (±0,42), 71
children with CH are expected in 2018. The number of 26 CH patients found is still low even
when the 45% missing diagnoses are taking into account.
The PPV target values have been reached for CAH (>15%), CH (>15%), SCD (>90%), PKU
(>60%) and MCAD (>70%) in 2018.
The PPV value for CH is still uncertain, because many diagnostic data are missing.
The target values for sensitivity and specificity have been reached for all conditions in 2018.
Table 5
Detection rate, positive predictive value (PPV), sensitivity (Sens) and specificity (Spec) in children born in 2018 and the period 2014-20181,2
2018 2014-2018 Trend
Detection rate PPV 3
Sens Spec Detection rate PPV Sens Spec detection rate
(per 1000) (%) (%) (%) (per 1000) (%) (%) (%) 2013-2018
CAH 0.053 36 100 99.991 0.044 33 100 99.991 stable
CH 0.154 20 100 99.9394 0.378 22 99.385 99.863 reduction
CF excl. MI 0.119 69 100 99.995 0.011 62 92.079 99.993 stable
incl. MI 0.142 73 100 99.995 0.134 66 93.496 99.993 stable
HbP SCD 0.154 96 100 99.999 0.159 96 100 99.999 stable
HbH 0 - 99.995 - - - - -
bTM 0.018 100 99.997 - - - - -
MD2 PKU 0.095 100 100 100 0.090 90 100 99.999 stable
3-MHM 0.030 100 99.994 0.020 41 100 99.997 stable
BIO 0.012 100 99.989 0.025 21 100 99.991 stable
GAL 0.018 100 99.978 0.008 3 100 99.973 stable
GA-1 0 - - 0.000 14 100 99.999 stable
IVA 0.024 100 100 0.015 72 100 99.999 stable
MSUD 0.012 100 100 0.006 9 100 99.994 stable
MCAD 0.113 90 100 99.999 0.110 95 100 99.999 stable
TFP/LCHAD 0 - 99.999 0.004 43 100 100 stable
TYR-1 0 - 99.999 0.005 27 100 99.999 stable
VLCAD 0.036 100 99.997 0.028 40 96.000 99.996 stable
Total 0.861 40 100 99.870 1.035 33 98.775 99.790
1
Since 2018, the PPV, Sens and Spec of five years combined are calculated, because for some conditions only few children are found per year. For these
conditions a calculation over several years gives a more stable outcome.
2
The incidental finding OCTN2 is not included in this table.
3
Only a few children per year are referred for HbH, bTM and for many of the metabolic diseases. There are therefore no target values for the PPV of these
diseases.
4
In 2018, 45% (n=112) of the diagnostic data was not delivered. If we assumed that all of these 112 children had a false positive heelprick result, the
specificy would be 99.87%. This is still above the target value of 99.84%.
10> T H E N E W B O R N B LO O D S P OT S C R E E N I N G I N T H E N E T H E R L A N D S – M O N I TO R 2 01 8
TIMELINESS DIAGNOSTICS
From 2017 onwards, the timeliness of diagnostics has been calculated in the total popula-
tion of children that have been referred to paediatricians for all diseases. Until 2016, only
children with the condition were included in the calculation for CAH, CH and CF.
The target values for the conditions CAH, CH, CF and MD were not achieved in 2018 (Table 6).
Table 6
Timeliness of diagnostic results in children born in 2018
% < diagnosed in time Target value
CAH 77 ≥90%> T H E N E W B O R N B LO O D S P OT S C R E E N I N G I N T H E N E T H E R L A N D S – M O N I TO R 2 01 8
> January 2020
AUTHORS
Kitty van der Ploeg
Sophie Wins
Paul H. Verkerk
PROJECT NUMBER
060.37671
REPORT NUMBER
TNO 2020 R10016
COMMISSIONED BY
RIVM
TNO.NL
EARTH, LIFE & SOCIAL SCIENCES
Schipholweg 77-89
2316 ZL Leiden
Postbus 3005
2301 DA Leiden
www.tno.nl
T +31 88 866 90 00You can also read